

Satellite Crop Advisory in Kenya: A Maize Case Study
A three-plot maize grower in northern Kenya onboarded to JEEVN AI and, within two weeks and four satellite visits, had a field-by-field irrigation, fertilizer and pest plan running before a single seedling had emerged. Here is exactly what the satellite crop advisory in Kenya told them, and why they said yes across the board.
Most satellite crop-advisory case studies describe a season already underway — a grower correcting course mid-crop. This one starts earlier. The grower behind this account signed up for JEEVN AI, Farmonaut’s satellite crop advisory platform, at the start of September and had three maize plots mapped across Samburu and Marsabit counties within days. By the time the first seeds went into the ground, the platform had already run soil, moisture and pest models against each field and handed back a plan for water, nutrients and pests — not after the fact, but at the exact moment those decisions were being made.
Two weeks and four satellite visits later, the grower filled in Farmonaut’s short in-app feedback form. All three “did this help?” questions — irrigation, fertilizer, pest — came back Yes. Asked to estimate how much the advisory had optimised their decisions, they put irrigation in the 50–70% band and fertilizer above 70%. No comment was left, and none is invented here: this case study exists to show why those numbers are plausible, by walking through exactly what the satellite advisory told this grower, field by field, in the two weeks before and after planting.
This is a first-cycle result. The grower had zero months of tenure on the platform when they gave this feedback — four satellite visits, one soil read, one irrigation calendar, one fertilizer plan per field. Nothing here required a full season to prove out; the value showed up on day one, before the maize had a single true leaf.
Farming a Dry Corridor: Why Samburu and Marsabit Need Precision, Not Guesswork
Samburu and Marsabit are two of Kenya’s driest and most agro-ecologically demanding counties — semi-arid rangeland where rainfall is erratic, irrigation water is a limited resource, and a maize crop’s survival often comes down to getting the first two to three weeks exactly right. Sow into soil that is already saturated and the seed rots before it germinates. Under-water a stand at emergence and it never recovers its stand count. Miss the narrow window when Fall Armyworm larvae are small enough for an organic control to work, and a chemical rescue spray becomes the only option.
None of that is unique to this grower — it is the baseline reality of smallholder maize production across Kenya’s semi-arid north. What is unique is that this grower had, from the very first week, a live read on soil moisture, canopy signal and nutrient status for each of their three plots, rather than a single blanket recommendation borrowed from a regional extension leaflet. That distinction — per-field precision instead of a one-size-fits-all programme — is the thread that runs through every section below.
The harder problem for a grower managing more than one plot is not a lack of general advice — extension guidelines for maize in semi-arid Kenya are well documented — it is that ground scouting cannot keep pace with fields that are geographically spread and each drying, wetting or greening up on their own timeline. A weekly walk-through of one field tells a grower nothing about the moisture state of a second field a county away. Satellite revisit closes exactly that gap: every mapped plot gets the same weekly read, on the same schedule, regardless of how far apart the fields sit or how many of them there are.
Inside JEEVN AI: Turning Satellite Signal Into a Field-by-Field Plan
JEEVN AI, Farmonaut’s satellite-based crop advisory product, does not start from a generic crop calendar. For each mapped plot it pulls Sentinel-2 optical imagery (NDVI canopy signal, NDWI moisture signal, SAVI where the canopy is still too sparse for NDVI to be reliable), Sentinel-1 radar soil moisture (RSM), and a temperature/radiation-driven evapotranspiration model (Penman-Monteith or Hargreaves depending on data availability) to work out where a specific field actually sits — not where a generic calendar assumes it should be.
For this grower’s plots, that starting point was the same for all three: pre-sowing / not-yet-established. The satellite read NDVI values of roughly 0.22–0.23 across the fields — just background vegetation and bare-soil reflectance, not an emerged crop — alongside high radar soil moisture (RSM readings of 0.69–0.83, on a 0–1 scale). From that single combination, the advisory engine derived three separate, field-specific programmes: an irrigation calendar tuned to each field’s own moisture and evapotranspiration trend, a five-nutrient fertilizer plan built from each field’s own soil-reflectance baseline, and a pest and disease watch-list weighted to the pre-emergence and sowing growth stage specifically — not a generic “maize pest list.”
The engine deliberately swaps its vegetation index depending on canopy cover: NDVI is reliable once a crop closes canopy, but at pre-emergence it is dominated by soil colour and residue. Below that threshold, JEEVN AI switches its fertilizer and soil models to SAVI (Soil-Adjusted Vegetation Index), which corrects for exactly that background noise — a detail that matters most for a brand-new field where every other index would otherwise be unreliable.
Irrigation: Two Fields, Two Completely Different Water Stories
This is where the “50–70% optimised” self-estimate is easiest to trace, because the advisory did not treat this grower’s plots the same way at all — it read each one’s own soil moisture and prescribed the opposite strategy on paper-adjacent farms.
On the Samburu County plot, radar soil moisture came back high (RSM 0.83) heading into the sowing window. A blanket irrigation schedule — water every day, or every other day, regardless of conditions — would have pushed water onto a seedbed that was already close to saturated, risking exactly the rot and poor emergence that semi-arid growers most fear. Instead, the advisory’s 7-day forecast recommended furrow irrigation on only 3 of the next 7 days, explicitly skipping the 4 intermediate days “to avoid waterlogging” while soil moisture worked its way down naturally.
On the Marsabit County plot, the read was different: lower NDWI and a sowing-stage crop with a genuine daily water requirement. Here the advisory recommended daily drip irrigation with zero rain-skips across the full 7-day window — but it also compared irrigation methods side by side and found that drip delivered the same crop-water outcome at 3.5 mm per day, against 5.0 mm per day for furrow/basin irrigation and 4.2 mm for sprinkler on the same field. That is a 30% reduction in daily water volume for an equivalent result, purely from matching the delivery method to the field’s own moisture-retention profile.
Put together, one field’s plan saved water by skipping over half its scheduled irrigation events outright, and the other saved water by recommending a more efficient delivery method at full frequency. Averaged across a three-plot portfolio, a grower comparing that against a flat daily-watering habit — still the default for many smallholder maize growers in this corridor — would plausibly land an optimisation estimate somewhere in the 50–70% band this grower reported. That figure is the grower’s own estimate, not a Farmonaut-metered number, but the mechanism behind it is concrete and traceable to the advisory’s own day-by-day output.
Fertilizer: Closing the Exact Gap, Nutrient by Nutrient
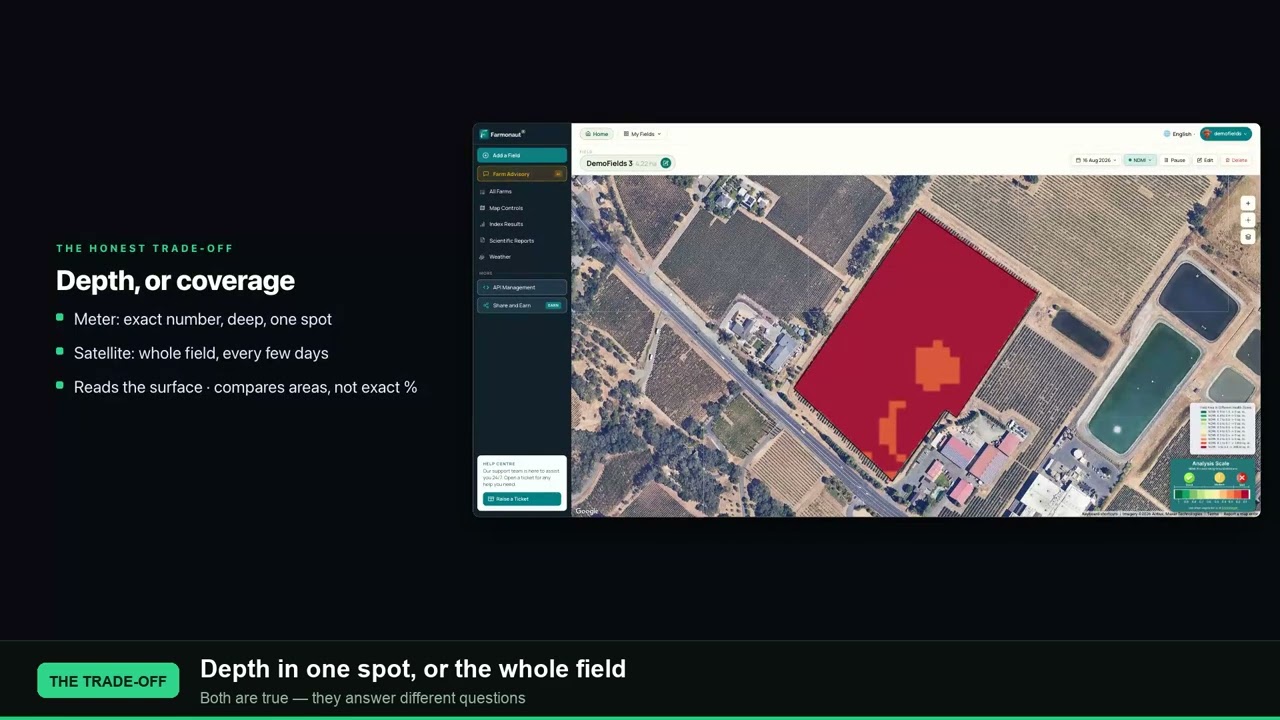
The fertilizer plan is where this grower’s “above 70% optimised” estimate has the clearest mechanical explanation, because JEEVN AI does not hand back a single blanket compound-fertilizer bag size. It estimates each field’s current soil composition for five separate elements — nitrogen, phosphorus, potassium, sulfur and zinc — from satellite-derived soil reflectance, compares each one against an ideal target range for maize at that growth stage, and calculates the exact kilogram-per-acre gap for each nutrient individually.
On the Samburu plot, for example, nitrogen tested at roughly 50% of its ideal target, phosphorus at 45%, potassium at 68%, sulfur at 53% and zinc at 51%. Rather than applying a single flat NPK ratio to close all five gaps at once — the common smallholder default, which almost always over-corrects some nutrients while leaving others short — the advisory prescribed five separate rates: roughly 24.7 kg/acre of DAP-sourced nitrogen, 43.5 kg/acre of phosphorus, 60.1 kg/acre of potassium via MOP, 26.7 kg/acre of sulfur via ammonium sulphate, and 4.2 kg/acre of zinc sulphate — each one sized to close that specific field’s specific gap, no more and no less.
The advisory also priced two ways to close every one of those five gaps — a chemical source (DAP, MOP, ammonium sulphate, zinc sulphate) and a farmyard-manure or compost equivalent for each nutrient — so the grower could choose the input actually available to them without losing the precision of the underlying calculation. The Marsabit plot received its own independent five-nutrient breakdown, with its own soil baseline, its own gaps, and its own recommended Urea, DAP, MOP, ammonium sulphate and zinc sulphate rates suited to fertigation through the same drip system already irrigating that field.
Every one of the five nutrient reads on both plots came back in the same “moderate” range — not depleted, not excessive. That is exactly the profile of freshly registered, lightly-farmed semi-arid land, and it is why the advisory’s basal, pre-planting correction plan matters most right now: get the starting nutrient balance right before the crop’s root system is established, and every later top-dressing decision this season inherits a more accurate baseline.
Pest and Disease: Watching Fall Armyworm Before It Ever Reaches a Leaf
The third “did this help?” Yes covers pest and disease, and here the advisory’s value is less about a percentage and more about timing. Across all three of this grower’s plots, Fall Armyworm (Spodoptera frugiperda) — the single most damaging maize pest in East Africa — was flagged at a 45% probability at the pre-emergence and sowing stage, months before it would show visible whorl damage. Turcicum Leaf Blight, Maize Lethal Necrosis Disease, African Maize Stalk Borer and two site-specific weed pressures (Blackjack and either Purple Nutsedge or Witchweed, depending on the field) rounded out each plot’s individual watch-list.
What makes this credible rather than a generic pest checklist is that the advisory tied its reasoning explicitly to each field’s own growth stage and moisture signal: elevated soil moisture at sowing (RSM 0.69–0.83) was read as favouring early fungal pathogens and the earliest instar of Fall Armyworm specifically — the exact window when an organic control like neem oil or Beauveria bassiana still works, before a heavier chemical rescue treatment becomes necessary. Each risk came paired with both an organic and a chemical response option, mirroring the same dual-pathway approach used in the fertilizer plan.
The same weekly read also flagged weed pressure on all three plots — Blackjack (Bidens pilosa) at 70–75% probability, alongside a second, field-specific weed (Purple Nutsedge on the Samburu plot, Witchweed on the Marsabit plot). The advisory’s own reasoning ties this directly to the same soil-moisture signal driving the irrigation plan: high radar soil moisture ahead of crop emergence creates ideal germination conditions for fast-growing broadleaf and sedge weeds, before the maize canopy is established enough to shade them out. Flagging that risk in the same pre-emergence window as the pest watch-list gives the grower one combined priority list — weeds, pests and disease — for the same early field walk, rather than three separate ones spread across the season.
Every probability on a JEEVN AI pest, disease and weed card is a modelled risk score from canopy and moisture signal — not a confirmed infestation. That is the intended use: a scouting priority list for the grower’s own field walk, timed to when intervention is still cheap, not a diagnosis to spray against blind.
What the Grower Told Us — In Their Own Answers
No first-person quote appears in this case study, because none was given. The feedback record behind this grower’s account carries no free-text comment — only three Yes/No questions and two percentage-band estimates, submitted through Farmonaut’s in-app feedback form two weeks after signing up. Rather than inventing a testimonial voice that was never provided, here is exactly what was recorded:
| Metric | Samburu plot | Marsabit plot |
|---|---|---|
| Crop & stage | Maize (Corn) — not yet established | Maize (Corn) — sowing |
| Field size | ~4.6 acres | ~2.0 acres |
| Irrigation method recommended | Furrow, 3 of 7 days | Drip, 7 of 7 days |
| Irrigation logic | Rain/moisture-gated skips | Lower-volume daily precision |
| Radar soil moisture (RSM) | 0.83 (high) | 0.69 (moderate) |
| Nutrients flagged (of 5) | 5 — N, P, K, S, Zn, all moderate gap | 5 — N, P, K, S, Zn, all moderate gap |
| Soil pH / organic carbon | 6.8 (medium) / 0.13% (low) | 6.5 (medium) / 0.14% (low) |
| Top flagged pest | Fall Armyworm, 45% | Fall Armyworm, 45% |
| Local yield potential range | 1,200–2,400 kg/acre | 1,200–2,400 kg/acre |
The self-reported bands sit alongside those answers: irrigation optimisation in the 50–70% range, fertilizer optimisation above 70%. These are the grower’s own estimates of how much better their decisions were versus what they would otherwise have done — not a figure Farmonaut measured with a flow meter or a soil probe. Read against the mechanisms above — rain-gated irrigation skips on one field, method-efficiency savings on the other, and a five-nutrient gap-fill replacing a blanket fertilizer bag on both — both numbers sit comfortably inside what the advisory data actually shows.
Why Day-One Satellite Data Matters for a Brand-New Farm
It would be easy to read “zero months of tenure” as a caveat. It is closer to the opposite. The single most consequential decisions in a maize season — whether to sow into a wet or a drying seedbed, how much basal fertilizer to bank before the roots are down, which pest to start scouting for first — all happen in the first two to three weeks, exactly the window this grower’s four satellite visits covered. A satellite advisory that only became useful after a full season of calibration would have missed the highest-leverage moment on the calendar entirely.
Scaled across three plots and roughly 11.6 acres, that day-one read also means the grower did not have to build separate irrigation, fertilizer and pest judgement for each field from scratch. The Samburu and Marsabit plots received opposite irrigation instructions in the same week because their own soil moisture readings genuinely differed — a distinction a grower relying on a single regional rule of thumb would have no way to make without a soil probe in every field, every week.
The same per-field logic that produced this grower’s first plan keeps running every week the satellite revisits — as the maize moves from pre-sowing through emergence, vegetative growth and tasseling, the irrigation, fertilizer and pest models update against the crop’s own advancing NDVI and NDWI signal, without the grower having to re-request an assessment.
Growth and Yield Outlook: Confirming the Season Starts on Track
Alongside the irrigation, fertilizer and pest plans, each field’s advisory carried an early yield outlook derived from local agro-ecological potential for the surrounding zone, cross-referenced against regional soil-nutrient benchmarks. For the Samburu plot, that baseline sits at roughly 2,100 kg/acre; for the Marsabit plot, roughly 2,050 kg/acre — both comfortably inside the wider local potential range of 1,200–2,400 kg/acre for the surrounding growing zone, and each carrying a projected harvesting window (early 2027) tied to this season’s actual sowing date rather than a generic crop-calendar assumption.
That outlook is not a guarantee — it is a starting reference point the same advisory engine will keep updating as canopy signal replaces soil-baseline estimates over the season. But for a grower two weeks into a brand-new account, having a credible, field-specific yield expectation on record from day one — instead of waiting until harvest to find out whether the season’s decisions paid off — is itself part of what “optimised” means in this case study.
Bring Satellite-Guided Advisory to Your Own Fields
This grower’s experience is the standard JEEVN AI workflow, not a bespoke build: map a field’s boundary, and the platform pulls the same satellite optical, radar and evapotranspiration stack to generate an irrigation calendar, a per-nutrient fertilizer plan, and a growth-stage-aware pest and disease watch-list — refreshed on every satellite revisit. Explore JEEVN AI → to see what a first satellite read of your own field would show, or talk to our team → about mapping a multi-plot portfolio the way this grower did.

See Your Own Field’s Satellite Read
Every recommendation in this case study came from the same JEEVN AI pipeline available on sat.farmonaut.com today — irrigation calendars, per-nutrient fertilizer plans, and growth-stage pest watch-lists, refreshed with every satellite pass.
- NDVI (Normalized Difference Vegetation Index)
- A satellite measure of canopy greenness and vigour, built from how much red and near-infrared light a crop reflects. Reliable once a crop has emerged and closed canopy; unreliable at pre-emergence, when bare soil dominates the signal.
- NDWI (Normalized Difference Water Index)
- A satellite measure of vegetation and surface water content, used alongside NDVI to flag moisture stress in the growing crop.
- SAVI (Soil-Adjusted Vegetation Index)
- A variant of NDVI that corrects for soil-background reflectance, used in this advisory in place of NDVI while the fields were still at pre-emergence and sparsely vegetated.
- RSM (Radar Soil Moisture)
- A Sentinel-1 radar-derived estimate of soil moisture at or near the surface, on a 0–1 scale, unaffected by cloud cover — the primary signal behind this case study’s irrigation skip-day and method decisions.
- ET₀ (Reference Evapotranspiration)
- The modelled rate at which a reference crop loses water to the atmosphere under current temperature and radiation conditions, estimated here via the Penman-Monteith or Hargreaves method depending on available data. Combined with a crop coefficient (Kc), it sets each field’s baseline water requirement.
- Kc (Crop Coefficient)
- A stage-specific multiplier applied to ET₀ to estimate a particular crop’s actual water need at its current growth stage — low at pre-sowing, rising through vegetative growth and peaking around tasseling.
Frequently Asked Questions
What does a satellite crop advisory in Kenya actually measure?
JEEVN AI combines Sentinel-2 optical imagery (canopy vigour via NDVI/SAVI, moisture via NDWI), Sentinel-1 radar soil moisture, and a temperature-and-radiation-driven evapotranspiration model for each mapped field. Together these estimate a field’s growth stage, water need, nutrient status and pest/disease risk without a physical site visit.
Can satellite advisory work before a crop has even emerged?
Yes — this case study covers exactly that window. At the pre-sowing and sowing stage, canopy signal is limited, so the models lean more heavily on radar soil moisture, SAVI (which corrects for bare-soil interference) and baseline soil reflectance to time irrigation and calculate basal fertilizer needs before the crop is visually established.
How does JEEVN AI decide when to skip an irrigation event?
It compares radar-measured soil moisture and modelled evapotranspiration for that specific field against the crop’s water need at its current growth stage. When soil moisture is already high relative to that need, the system schedules a skip rather than adding water the field does not require — as it did for four of seven forecast days on this grower’s Samburu plot.
Why did the two fields in this case study get opposite irrigation plans?
Because their own radar soil-moisture readings genuinely differed — 0.83 on the Samburu plot versus 0.69 on the Marsabit plot — in the same week, under the same regional weather. A single blanket schedule cannot reflect that kind of field-to-field variation; a per-field satellite read can.
Is the fertilizer plan the same as a standard NPK recommendation?
No. A standard blanket NPK application uses one fixed ratio for an entire crop type. JEEVN AI estimates nitrogen, phosphorus, potassium, sulfur and zinc independently for each field from soil-reflectance data, compares each against its own ideal target range, and calculates a separate gap-filling rate — in both a chemical and an organic-source option — for every nutrient.
Are the pest probabilities on a JEEVN AI advisory a confirmed diagnosis?
No. They are modelled risk scores derived from canopy signal, soil moisture and growth stage, intended to prioritise a grower’s own field scouting toward the pests and diseases most likely to appear next — not a substitute for an on-the-ground inspection before any treatment decision.
Is the 50–70% irrigation optimisation figure something Farmonaut measured?
No — it is this grower’s own self-reported estimate, given through an in-app feedback form, of how much the advisory improved their irrigation decisions versus their prior approach. Farmonaut does not meter a grower’s actual water use; the figure is presented here exactly as reported, alongside the underlying advisory mechanism that makes it plausible.
Does JEEVN AI’s advisory cover more than irrigation, fertilizer and pests?
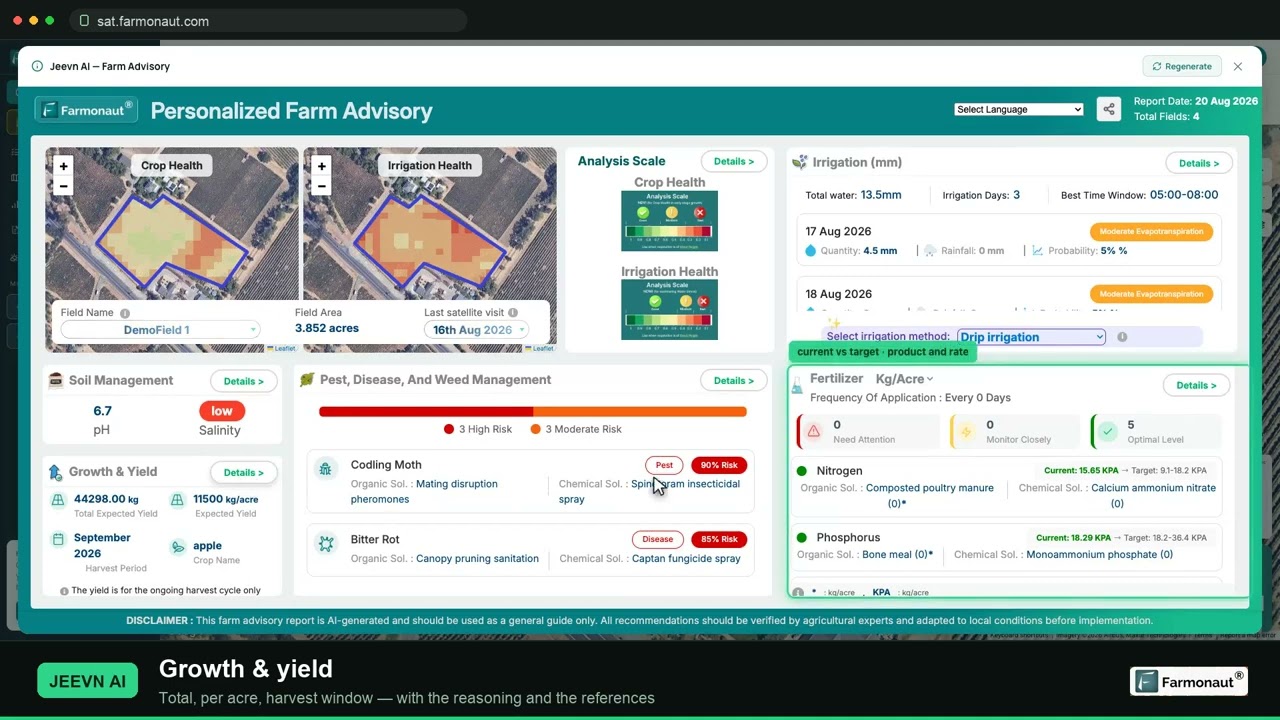
Yes. The same weekly advisory also includes a soil management read (pH, salinity, organic carbon), a weed-risk watch-list, and a growth-and-yield outlook for each field, all generated from the same satellite pass. This case study focuses on the three areas the grower was specifically asked about in their feedback form.
This case study is built entirely from this grower’s own JEEVN AI advisory records and in-app feedback, submitted two weeks after signing up. To protect the individual’s privacy, no name, contact detail, exact coordinates or field-level address is published; the region is stated at county level only. Reported optimisation percentages are the grower’s own self-assessment and are not independently metered by Farmonaut. Pest and disease probabilities are modelled risk scores, not confirmed field diagnoses, and should inform — not replace — a grower’s own scouting before any treatment decision.
Discussion
Questions, corrections or field experience? Share them below. First-time comments are reviewed before they appear, and your email is never published.
No comments yet. Be the first to add a question or your experience.

 Click2Cloud
 TVS Electronics
 BW Pipelines
 WICO
WICO Gen Chayat
 Chimera Innovation
 SkyHarvest
 Polaris Digitech
 Teledarbas
 Wild Oak Farm
 SFX
SFX BACF Africa
 Doodlakine
 Exurbia Geospatial
 FieldZero
 Indico Company
