

Lithium funds · Comparison
Lithium ETFs Compared: LIT, BATT, LITP, ILIT Fees
None of these four lithium funds holds only lithium. LIT puts 22.57% in Rio Tinto, BATT has 7.89% in lithium, and ILIT and LITP are small miner-only funds. Fees, size and holdings side by side.
Key takeaways
- LIT has US$1.37 billion of assets, a 0.75% fee and 41 holdings; Rio Tinto is 22.57% of it (Global X, 14 Oct 2026).
- BATT charges 0.59%; lithium is 7.89% of it and copper 23.26% (Amplify, 30 Sep 2026).
- ILIT (0.47%) had US$11.2 million of assets and LITP (0.65%) US$29.6 million: small funds, so check spreads (iShares, 14 Oct; StockAnalysis, 15 Oct 2026).
- Lithium carbonate fell in China to 104,400 yuan a tonne on 15 Oct 2026, 21% lower in a month and 43% higher than a year earlier (Trading Economics).
- World lithium mine output was about 290,000 tonnes in 2025; Australia, China and Chile mined 210,000 of it (USGS, 2026).
In this article
- Lithium ETFs side by side
- How we chose these funds
- What LIT really holds
- BATT: lithium is one slice of a battery fund
- ILIT and LITP: the miner-only funds
- Lithium stocks that sit inside these funds
- Where lithium is mined, and why it shapes fund holdings
- What moves the price of a lithium ETF
- Fees, spreads and the true cost of holding a fund
- How to choose between lithium ETFs: five checks
- Where satellite data fits
- Frequently asked questions
None of the four lithium ETFs compared here holds only lithium. They hold company shares, and the mix differs a lot: Global X LIT (0.75% fee, US$1.37 billion of assets on 14 October 2026) puts 22.57% of its money in Rio Tinto, a diversified miner, while Amplify BATT shows only 7.89% in lithium companies and 23.26% in copper companies (Global X; Amplify). The two miner-only funds, iShares ILIT and Sprott LITP, track the lithium price more closely but are much smaller. This page lays out fees, size, holdings and risks side by side so you can see what each fund really owns before you look at a price chart.
Lithium ETFs side by side
An ETF (exchange-traded fund) is a basket of shares that trades on an exchange like a single share. The expense ratio is the yearly fee, taken from the fund’s assets. Net assets show how large the fund is. All figures below are from the issuer pages on 14 or 15 October 2026 unless a row says otherwise.
| Ticker | Fund and index | Expense ratio | Net assets | Holdings | What it holds |
|---|---|---|---|---|---|
| LIT | Global X Lithium & Battery Tech ETF; Solactive Global Lithium Index | 0.75% | US$1.37 billion | 41 | Lithium miners and refiners, plus battery makers and equipment makers |
| BATT | Amplify Lithium & Battery Technology ETF; EQM Lithium & Battery Technology Index | 0.59% | US$107.6 million | 53 | Battery makers, electric-vehicle makers and battery-metal miners (copper, nickel, lithium, cobalt) |
| ILIT | iShares Lithium Miners and Producers ETF; STOXX Global Lithium Miners and Producers Index | 0.47% | US$11.2 million | 46 | Lithium miners and compound makers; 86.09% in materials companies |
| LITP | Sprott Lithium Miners ETF; Nasdaq Sprott Lithium Miners Index | 0.65% | US$29.6 million (15 Oct 2026) | 42 | Lithium miners; top holdings SQM, Albemarle and Ganfeng Lithium |
Sources: Global X (LIT), Amplify (BATT), iShares (ILIT), and StockAnalysis (LITP, 15 October 2026). Sprott’s own page blocked our check, so the LITP row comes from this data provider and should be confirmed on Sprott’s site.
Best for, pros and cons
- LIT, for the widest and largest fund. Pros: by far the biggest of the four and a long record (listed 22 July 2010), with a median bid-ask spread of 0.26% over 30 days. Cons: the highest fee here, more than a fifth of the money sits in one diversified miner, and battery and equipment makers dilute the lithium link.
- BATT, for the battery value chain. Pros: the lowest fee of the two diversified funds; the index covers battery makers, vehicle makers and battery metals. Cons: lithium is under a tenth of the portfolio, the fund is small, and its median bid-ask spread was 0.47%.
- ILIT, for a miner-only basket at the lowest fee. Pros: 0.47% fee and a narrow lithium focus. Cons: only US$11.2 million of assets, so a small fund that can be thinly traded; check the spread before you place an order.
- LITP, for a miner-only basket from a specialist issuer. Pros: concentrated in lithium producers. Cons: small, and its top three holdings alone were about 32% of the fund on 15 October 2026 (SQM 11.62%, Albemarle 10.81% and Ganfeng 9.66%).
“Best for” describes what each fund holds. It is not a recommendation to buy or sell.
How we chose these funds
We kept US-listed funds whose index is built around lithium or lithium batteries, and read each issuer’s own page on 14 or 15 October 2026. We left out broad metals-and-mining funds because lithium is a small part of them, and we left out funds where we could not open a current fact sheet. Net assets, holdings and fees change often, so treat the table as a dated snapshot. Fund names and holdings also change through mergers and renames, which is why we check each against the issuer.
What LIT really holds
LIT follows the Solactive Global Lithium Index, which picks 20 to 40 companies that earn or expect to earn significant revenue from lithium mining or lithium battery production (Global X). On 14 October 2026 it held 41 names. The surprise is the top line: Rio Tinto, at 22.57%. Rio Tinto completed its purchase of Arcadium Lithium for US$5.85 a share in cash in March 2025, and Arcadium’s shares were delisted from the NYSE and the ASX; the business is now Rio Tinto Lithium and includes the Rincon project (Global Mining Review). Arcadium is therefore no longer a stock you can buy, and fund holders now get that lithium business inside a company that also mines iron ore and copper.
Chart
LIT: eight largest holdings
Per cent of net assets, 14 October 2026
The ten largest holdings made up about 69% of net assets (calculated from the issuer’s weights). By sector, materials were 44.23%, information technology 20.79%, industrials 18.19% and consumer discretionary 15.29%. The non-materials sectors add up to about 54% (calculated), so more than half of LIT is battery, equipment and vehicle companies rather than miners.
Past results, from the same page, to 30 September 2026: NAV return of 21.42% over one year, 8.29% a year over three years and -2.78% a year over five years. NAV is net asset value, the value of the fund’s holdings per share. Past performance does not predict future results.
BATT: lithium is one slice of a battery fund
Amplify describes BATT as a basket of companies tied to lithium battery technology: battery storage, battery metals and materials, and electric vehicles. On 30 September 2026 the largest market segment was copper at 23.26%, ahead of electric vehicles at 18.70% and nickel at 14.91%; lithium came to 7.89%. By country, China was 27.48%, the US 25.54%, Australia 15.10% and Canada 9.55%. The top holdings on 15 October 2026 were Tesla (8.20%), BHP (7.11%), Freeport-McMoRan (6.43%) and CATL (5.31%) (Amplify).
Chart
BATT: what the fund is exposed to
Per cent of fund by market segment, 30 September 2026
That makes BATT a battery-supply-chain fund. Its NAV returned 13.93% over one year and 11.10% a year over three years, but -0.75% a year over five years, to 30 September 2026. If you want to follow the lithium price, the lithium slice here is small; if you want a broader electrification basket, the mix is the point.
ILIT and LITP: the miner-only funds
ILIT (Nasdaq) and LITP follow indexes of lithium miners and producers. iShares reports 46 holdings in ILIT on 14 October 2026 and net assets of US$11.2 million. The fund launched on 21 June 2023, and its fee is 0.47% (iShares). Sprott’s LITP, which began on 1 February 2023, charges 0.65%; StockAnalysis lists 42 holdings and US$29.6 million of assets on 15 October 2026, with SQM (11.62%), Albemarle (10.81%), Ganfeng Lithium (9.66%) and PLS Group (8.50%) as the four largest (StockAnalysis).
The trade-off is simple. A miner-only fund moves more with the lithium price, up and down, and a handful of companies drive most of the result. Both funds are small, so look at the bid-ask spread (the gap between the buy and sell price) and the premium or discount to NAV before you trade.
Lithium stocks that sit inside these funds
This page compares funds. For individual company analysis, see our page on top lithium stocks and our guide to how to evaluate lithium mining stocks. Four facts matter for fund holders because they change what the funds own:
- Albemarle (NYSE: ALB) is a top-ten holding of LIT at 3.95% and the second-largest holding of LITP. For the second quarter of 2026 it reported net income of US$480 million and adjusted EBITDA of US$858 million (Albemarle, 5 August 2026).
- SQM is the largest LITP holding on 15 October 2026. Its second-quarter 2026 report shows record lithium sales of about 84,100 tonnes LCE and lithium revenue of US$1,779.2 million, with its Chile sales now made through Nova Andino Litio, the joint company of SQM and Codelco (SQM filing with the SEC).
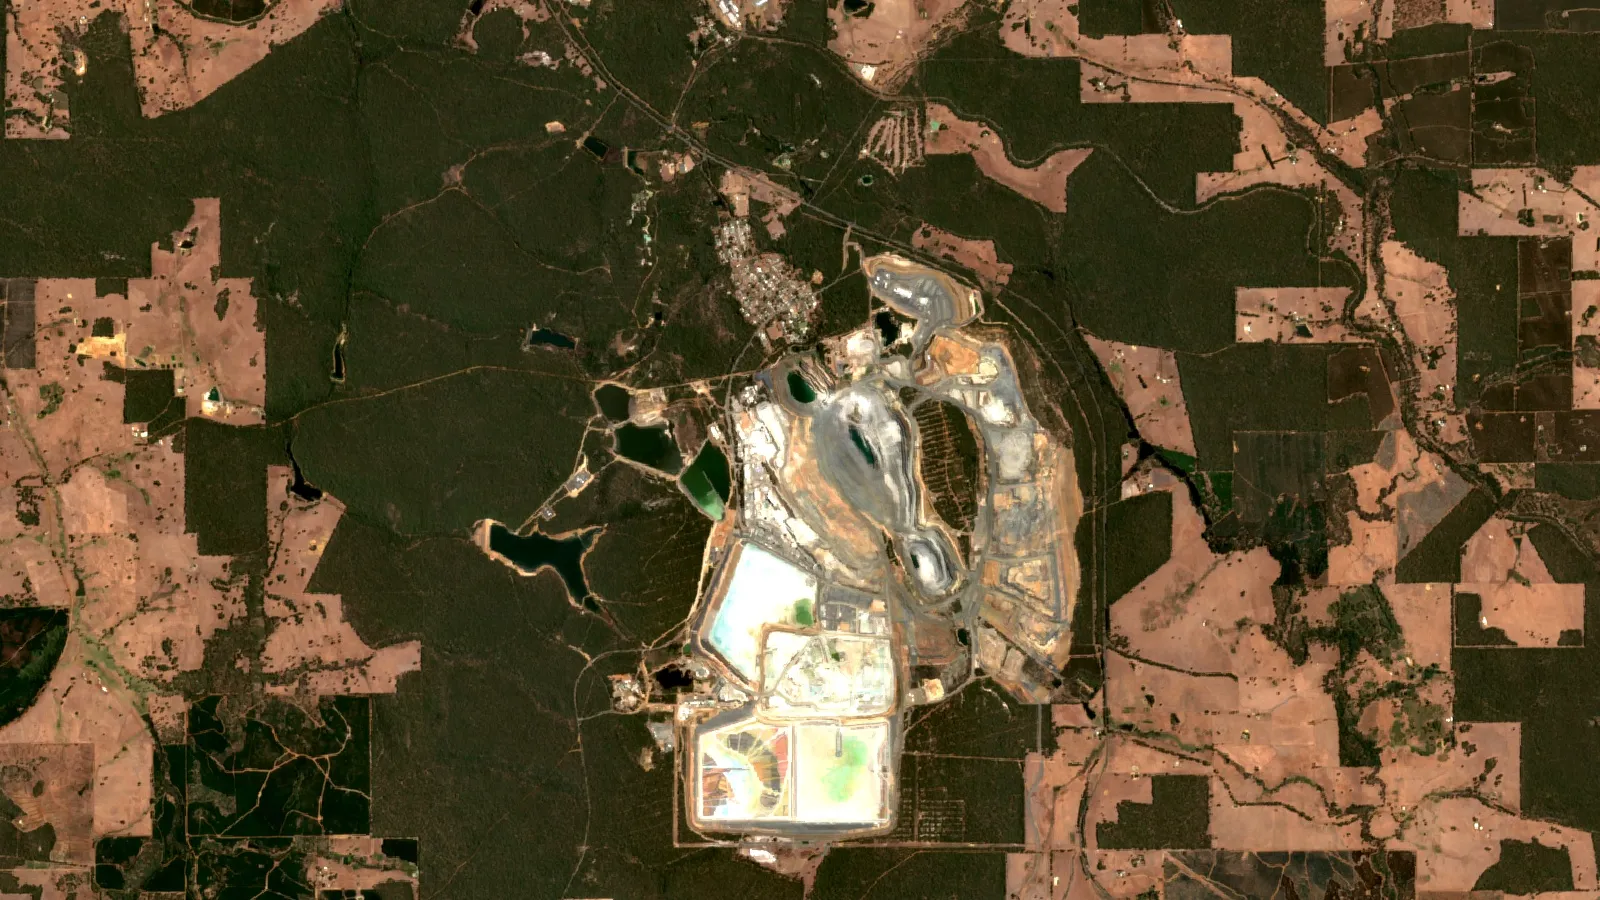
- PLS Group (ASX: PLS) is LITP’s fourth-largest holding. It runs the Pilgangoora operation in Western Australia and the Colina project in Brazil (PLS June 2026 quarterly report, ASX, 30 July 2026). It was Pilbara Minerals Limited until its November 2025 name change (FilingReader summary).
- Arcadium Lithium no longer trades, as described above, so older articles that list it as a pick are out of date.
Where lithium is mined, and why it shapes fund holdings
The USGS estimates world lithium mine output at about 290,000 tonnes of lithium content in 2025, up from 222,000 tonnes in 2024. Australia mined 92,000 tonnes, China 62,000 and Chile 56,000 (USGS Mineral Commodity Summaries 2026). Batteries took 88% of lithium use. That is why fund holdings lean towards Australia, China, Chile and the battery makers that buy the product.
Chart
Lithium mine production by country, 2025
Tonnes of lithium content (estimates), eight largest producers
Producers differ by rock type. The USGS counts seven mineral (hard-rock) operations in Australia and two brine operations in Chile among the sources of most world output. Spodumene is the lithium-bearing mineral mined from pegmatite veins; brine is salty water pumped from underground and evaporated. Lithium carbonate equivalent (LCE) is the unit that puts both on one scale. For how hard-rock projects are found, see our guide to spodumene pegmatites in James Bay.

▶ A satellite-based study of lithium potential in Nigeria, showing how exploration targets are mapped from space. · 10:49
What moves the price of a lithium ETF
Share prices of lithium companies follow the price of lithium carbonate, and that price has swung hard. The USGS puts the average US price of battery-grade lithium carbonate, in constant dollars, at US$63,700 a tonne in 2022 and US$9,000 in 2025 (USGS, 2026). In China, lithium carbonate was trading at 104,400 yuan a tonne on 15 October 2026, down 21.03% over a month but 43.01% above a year earlier (Trading Economics). In July 2026 the most active Guangzhou futures contract fell to a five-month low of 136,800 yuan, nearly 30% below its mid-May high above 200,000 yuan, as mine restarts raised fears of oversupply in 2027; the earlier rally had followed the shutdown of CATL’s Jianxiawo mine (Mining.com, 22 July 2026). The yuan and US-dollar series are different markets and are not directly comparable.
Chart
Lithium carbonate price, US annual average
US$ per tonne, battery-grade, constant dollars
Also read our lithium price page for more on price drivers. For a diversified fund such as LIT, the lithium price is only one driver: electric-vehicle sales, chip-equipment demand and interest rates also move the battery and equipment holdings.
Fees, spreads and the true cost of holding a fund
The expense ratio is not the only cost. You also pay the bid-ask spread each time you trade, and the market price can differ from NAV. The US Securities and Exchange Commission’s investor site explains that an ETF’s market price is typically a little above or below its NAV, called a premium or a discount (Investor.gov). On 14 October 2026 LIT closed at US$66.38 against a NAV of US$67.00, a discount of 0.924%, and BATT closed at US$13.88 against a NAV of US$14.07, a discount of 1.34%.
The calculator below turns a fee and a lithium weight into dollars. It uses a flat fund value, so it understates or overstates fees if your holding grows or falls.
Calculator
What does a lithium ETF fee cost you?
Enter your amount, the fund’s fee and its lithium share.
- Fees over the years held (flat value): $600
- Money in lithium companies: $1,000
- Yearly fee as a share of the lithium money: 6.0 %
Example values only, not any fund’s figures or a forecast. Take the fee and the lithium share from the issuer’s page (for example BATT shows 0.59% and 7.89%). Fund value is held flat, so growth and falls are ignored; spreads and taxes are not included.
How to choose between lithium ETFs: five checks
- Open the holdings file. Read the top ten names and sum their weights. For LIT that is about 69%.
- Find the lithium share. Ask what percentage is lithium producers. BATT states 7.89%; for the others, use the issuer’s sector data.
- Compare fee and size. A lower fee helps, but a very small fund can close.
- Check the spread and discount. Use the issuer page for the 30-day median spread.
- Read the risks. Amplify’s page warns that a fund concentrated in one industry can be more volatile and that metals-and-mining companies can be speculative.
Where satellite data fits
Fund managers follow mine output and price. Exploration companies need to know where lithium might be found before they drill. Farmonaut turns satellite imagery into exploration targets for mining licence holders and consultants through its satellite mineral detection service; these are targets, not resource estimates. To scope a project, use the mining query form. A video from our channel shows how satellites were used in a lithium study in Nigeria, and another covers what AI does and does not do in exploration.

▶ Explains what AI does in mineral exploration, where it fails and how to check any claim. · 4:37
For a closer look at a related question, see our guide: Critical Minerals ETFs Compared: Holdings and Fees.
Frequently asked questions
What is the largest lithium ETF?
Of the four compared here, Global X Lithium & Battery Tech ETF (LIT) is the largest, with US$1.37 billion of net assets on 14 October 2026 (Global X).
Is there an ETF that holds only lithium?
None of the four US-listed funds here holds only lithium. ILIT and LITP hold lithium miners and producers; LIT and BATT also hold battery and vehicle makers.
Which lithium ETF has the lowest fee?
ILIT, at 0.47%, then BATT at 0.59%, LITP at 0.65% and LIT at 0.75%, based on issuer and data-provider pages in October 2026. Fees change, so check before you trade.
Why is Rio Tinto the top holding in LIT?
Rio Tinto bought Arcadium Lithium in March 2025 and now owns its lithium business. Its large weight reflects the size of the company, not that lithium is most of its output.
Do lithium ETFs hold physical lithium?
The funds here hold company shares, as their index descriptions state, not stored metal.
What does LCE mean?
Lithium carbonate equivalent, a unit that converts lithium from brine, spodumene and other forms to a single scale. Albemarle, for example, reports energy storage sales in kilotonnes of LCE.
Is Arcadium Lithium still a stock?
No. Rio Tinto completed its acquisition and Arcadium’s shares were delisted from the NYSE and ASX.
Why did lithium prices fall?
The USGS average price in constant dollars fell from US$63,700 a tonne in 2022 to US$9,000 in 2025 as supply grew. Prices in China have since moved sharply again.
Where is most lithium mined?
Australia, China and Chile led 2025 output with 92,000, 62,000 and 56,000 tonnes of lithium content (USGS, 2026).
How can I check an ETF’s premium or discount?
Look at the issuer’s fund page, which shows NAV and market price, and read the Investor.gov explainer on ETFs.
This page is for information only. It is not investment advice. Fund fees, holdings and prices change; confirm them on the issuer’s page. Past performance does not predict future results.
Farmonaut mining
Map a lithium project area from space
Send your area as a KML, KMZ or polygon and get a satellite exploration report with prospectivity maps.

Mining Pro sample view, synthetic data
Keep reading
Sources
- USGS, Mineral Commodity Summaries 2026: Lithium: pubs.usgs.gov
- Global X, Lithium & Battery Tech ETF (LIT) fund page, 14 Oct 2026: globalxetfs.com
- Amplify ETFs, BATT fund page, 14-15 Oct 2026: amplifyetfs.com
- iShares, Lithium Miners and Producers ETF (ILIT) fund page: blackrock.com
- StockAnalysis, Sprott Lithium Miners ETF (LITP), 15 Oct 2026: stockanalysis.com
- Trading Economics, Lithium carbonate price, 15 Oct 2026: tradingeconomics.com
- Mining.com, Lithium price sinks to five-month low (22 Jul 2026): mining.com
- Investor.gov, Updated Investor Bulletin: Exchange-Traded Funds: investor.gov
- Global Mining Review, Rio Tinto completes acquisition of Arcadium Lithium (Mar 2025): globalminingreview.com
- Albemarle, Second quarter 2026 results (5 Aug 2026): albemarle.com
- FilingReader, Pilbara Minerals rebrands as PLS Group (28 Nov 2025): filingreader.com
- SQM, Form 6-K with second quarter 2026 earnings release (SEC): sec.gov
- PLS Group, June 2026 Quarterly Activities Report (ASX, 30 Jul 2026): announcements.asx.com.au
Discussion
Questions, corrections or field experience? Share them below. First-time comments are reviewed before they appear, and your email is never published.
No comments yet. Be the first to add a question or your experience.

 Almosi SARL
 SRK Consulting
 Berks Gold Limited
 Mwerezi Minerals Company Limited
 Mining SARL
 SenGold Invest SAS
 Sean Mining Limited
 NTS Group (Pty) Ltd
 Mine4Africa
 Lithspo Minerals Limited
 Tintina Mining Group
 Dalgety Minerals Pty Ltd
 Vortex Minerals Pty Ltd
 Faith At Work (Pty) Ltd
 Geotech Mining Solutions plc

 Licence holder · Nigeria · Gold + lithium










