

Copper producers · Company comparison
Freeport-McMoRan vs Southern Copper: Reserves and Costs
FCX produced 3,383 million lb of copper in 2025 against 2,108 million lb for Southern Copper, yet their reserves are close in size. Costs differ mainly because of by-product credits.
Key takeaways
- FCX reported 112.3 billion lb of recoverable copper reserves; Southern Copper reported 108.955 billion lb of contained copper, both at 31 December 2025 (company 10-K filings).
- FCX produced 3,383 million lb of copper in 2025, down about 20% after the Grasberg mud rush of 8 September 2025; Southern Copper produced 2,108.2 million lb, down 1.8%.
- Southern Copper’s 2025 cash cost was US$2.17/lb before by-products and US$0.58/lb after; FCX’s unit net cash cost was US$1.65/lb (10-K filings).
- FCX targets 80% of Grasberg capacity in mid-2027 and near-full capacity by the end of 2027 (FCX update, 2 October 2026).
- Chile (5.3 Mt) and Peru (2.7 Mt) lead 2025 mine output, out of about 23 Mt worldwide (USGS, 2026).
In this article
- Freeport-McMoRan vs Southern Copper at a glance
- Copper reserves compared: why the two figures do not match
- Copper output: FCX is larger, but Grasberg cut its volume
- Unit costs compared: what each company counts
- Copper prices behind the results
- Where each company mines
- Grasberg: the restart and what it means for FCX output
- Growth pipeline: where new copper is coming from
- Reserve life calculator
- How to use company reserve and cost numbers
- Frequently asked questions
Freeport-McMoRan (NYSE: FCX) mined more copper in 2025 than Southern Copper (NYSE: SCCO), but the two hold reserves of similar size. In 2025, FCX produced 3,383 million pounds of copper (about 1.53 million tonnes) against 2,108 million pounds (about 0.96 million tonnes) for Southern Copper. At 31 December 2025, FCX reported 112.3 billion pounds of recoverable copper reserves and Southern Copper reported 108,955 million pounds of contained copper. Reported costs differ sharply, largely because of by-product credits.
This page compares the two companies on the numbers an investor or mining consultant can check: reserves, output, unit costs, where the mines are, and what is changing at Grasberg. It ends with a reserve-life calculator and answers to common questions. A few terms first. A reserve is the part of a deposit that a company has shown can be mined at a profit under stated prices. Grade is the copper content of the ore, in percent. A by-product is a second metal (molybdenum, silver, gold, zinc) sold alongside copper, and its sales are credited against the cost of the copper. Cash cost is the cost to produce a pound of copper before depreciation, royalties and most taxes.
Freeport-McMoRan vs Southern Copper at a glance
The table sets the two companies side by side, using each company’s own annual report for 2025 unless the row says otherwise. Reserve and cost rows are not measured on the same basis, which the next sections explain.
| Item | Freeport-McMoRan (FCX) | Southern Copper (SCCO) |
|---|---|---|
| Headquarters and listing | Phoenix, Arizona; NYSE | Listed on the NYSE and the Lima Stock Exchange; 88.9% owned by Grupo Mexico at 31 December 2025 |
| Main copper mines | Grasberg district (Indonesia), Morenci (Arizona), Cerro Verde (Peru), plus Bagdad, Sierrita, Safford, Chino and El Abra | Toquepala and Cuajone (Peru); Buenavista, La Caridad and IMMSA (Mexico) |
| Copper production, 2025 | 3,383 million lb (consolidated, recoverable) | 2,108.2 million lb (mine production) |
| Copper reserves, 31 Dec 2025 | 112.3 billion lb recoverable (consolidated); 78.6 billion lb on a net equity basis; copper price assumption US$3.25/lb | 108,955 million lb contained in ore reserves; copper price assumption US$3.30/lb |
| Cash cost, 2025 | US$1.65/lb unit net cash cost, excluding US$0.17/lb of idle-facility and recovery costs | US$2.17/lb before by-products; US$0.58/lb after by-product credits |
| Main by-products | Gold (956,000 oz produced in 2025), molybdenum | Molybdenum, silver, zinc |
The table shows the first problem with a simple “who is bigger” answer. FCX leads on output, Southern Copper leads on cost, and the headline reserve figures are close (112.3 and 108.955 billion lb) but are measured on different bases, so they cannot be compared directly.
Copper reserves compared: why the two figures do not match
FCX reports recoverable reserves: the metal it expects to be paid for after mill and smelter losses. Its consolidated figure is 112.3 billion pounds, or about 50.9 million tonnes, and includes 17.5 billion pounds tied to a potential mill project at El Abra in Chile that still needs large capital. FCX also reports a net equity figure of 78.6 billion pounds (about 35.7 million tonnes), which removes the shares held by partners and minority holders, including the holders of the remaining 51.24% of PT Freeport Indonesia (PTFI). In the same filing, FCX says its Indonesian reserves are counted only through 2041. PTFI’s mining rights run to 2031, with rights to extend to 2041 if it meets smelter and fiscal conditions, and FCX’s reserves assume that extension.
Chart
Reserves at 31 December 2025, million tonnes of copper
Converted from pounds; the bases differ by company
Southern Copper reports contained copper: the metal in the ground before recovery losses. Its 108,955 million pounds (about 49.4 million tonnes) are split between Mexican open-pit mines (44,154 million), Peruvian operations (45,527 million) and development projects (19,274 million) that are not yet producing. Without the development projects, the producing mines hold about 40.7 million tonnes.
Both set their reserves at a copper price below recent market prices: US$3.25 per pound for FCX and US$3.30 for Southern Copper, against a 2025 London Metal Exchange average of US$4.51 per pound quoted in FCX’s filing. A company that uses a higher price can show a larger reserve, because more low-grade rock becomes profitable to mine. Neither filing uses a higher price, so the gap between the two is not caused by the price assumption. The two are similar in scale.
Copper output: FCX is larger, but Grasberg cut its volume
FCX’s 2025 copper production fell about 20% from 2024, from 4,214 to 3,383 million pounds. The cause was the mud rush at Grasberg on 8 September 2025, which stopped the Grasberg Block Cave underground mine. Grasberg district copper fell from 1.8 billion pounds in 2024 to 1.0 billion in 2025. Southern Copper’s mine output moved far less, down 1.8% to 2,108.2 million pounds, with lower grades at Toquepala, Cuajone and Buenavista.
Chart
Copper production, thousand tonnes
FCX consolidated recoverable copper vs Southern Copper mine output; pounds converted to tonnes
In 2026 the picture is shifting again. In its October 2026 operating update, FCX reported third-quarter copper production of about 830 million pounds and expected sales of 750 million pounds. Southern Copper’s production for the first half of 2026 was 461,206 tonnes, down 3.8% on the same period of 2025, mainly because of lower ore grades at its Peruvian mines, according to its second-quarter 2026 results. In April, the ICSG forecast 1.6% growth in world mine production for 2026, revised down from 2.3% mainly for the DRC, Chile and Indonesia, and said Grasberg output remained constrained by the 2025 incident. The International Copper Study Group put world mine production down 1% in the first seven months of 2026, with Indonesian concentrate output down 29% because of Grasberg.
Unit costs compared: what each company counts
Southern Copper reports a very low cash cost, and the number needs context. Its 2025 operating cash cost was US$2.17 per pound before by-product revenue. After crediting US$1.59 per pound of molybdenum, silver and zinc sales, the figure fell to US$0.58. In the second quarter of 2026 the credits were large enough to bring the net figure to US$0.05 per pound, and to minus US$0.03 for the half year.
Chart
Reported unit cash cost, US$ per pound of copper
Net of by-product credits; definitions differ
FCX also nets out by-products, mainly gold. Its 2025 unit net cash cost was US$1.65 per pound and its second-quarter 2026 cost was US$1.97 per pound; both exclude idle-facility and restoration costs from the Grasberg ramp-up (US$0.17 per pound in 2025, US$284 million in the second quarter of 2026). FCX expects US$1.90 per pound for 2026 as a whole. FCX attributes the rise from US$1.13 in the second quarter of 2025 mainly to lower copper volumes at PTFI during the Grasberg ramp-up. In its annual report, FCX says its cost estimate moves about US$0.03 per pound for each US$100 per ounce change in the gold price.
So the two net figures are built differently: different by-product mixes, different cost definitions, and different treatment of royalties and taxes. Comparing “US$0.58 vs US$1.65” without that note would mislead. Southern Copper has the lower reported cash cost, helped by large silver and molybdenum credits, and that FCX’s reported cost is sensitive to Grasberg volumes and the gold price.
Copper prices behind the results
Realized prices rose sharply between 2025 and 2026. FCX reported an average realized copper price of US$4.75 per pound for 2025 and US$6.17 per pound for the second quarter of 2026, and it expects more than US$6.50 per pound for the third quarter. Southern Copper reported record sales of US$4,289 million for the second quarter of 2026, up 40.6% from a year earlier, and US$8,540 million for the first half. Realized prices include timing effects from provisional pricing, so they differ from a single day’s exchange price. For the market itself, Mining.com reported on 14 October 2026 that cash copper on the London Metal Exchange settled at US$14,741 per tonne on 13 October and that the most-active COMEX contract had a record settlement of US$6.89 per pound on 9 September. Prices move daily, so check the exchange for the day’s price before using any figure in a model, and note its date.
Where each company mines
FCX’s copper is spread over three regions. Its 2025 filing reports its recoverable copper reserves as 42.5 billion lb in the United States, 45.6 billion in South America and 24.2 billion in Indonesia (about 38%, 41% and 22%), and 97% of its gold reserves sit in Indonesia. Southern Copper’s copper mines are in two countries, Peru and Mexico. The US Geological Survey estimates 2025 mine output at 5.3 million tonnes for Chile, 2.7 million for Peru, 1.0 million for the United States, 0.71 million for Indonesia and 0.69 million for Mexico, out of a world total of about 23 million tonnes.
Chart
Copper mine production, 2025 estimate, thousand tonnes
Countries where FCX or Southern Copper mine, USGS estimates
That country mix is the main risk difference. FCX’s largest recent shock came from a single Indonesian mine. Southern Copper’s largest development risks are in Peru: its filings and results describe delays at the Tia Maria project and illegal miners inside the Los Chancas project area.
Grasberg: the restart and what it means for FCX output
Grasberg is the main swing factor for FCX over the next 15 months. The company’s October 2026 update filed with the SEC gives these markers.
- Third-quarter 2026 mill throughput averaged about 140,000 tonnes of ore per day, roughly 67% of the rate before the September 2025 incident, with about 70,000 tonnes per day from the Grasberg Block Cave.
- FCX expects to reach 80% of capacity in mid-2027 and to approach full capacity by the end of 2027, with Production Block 1S targeted for mid-2027.
- PTFI’s smelter in Eastern Java, suspended after the incident, restarted in late August 2026.
- Third-quarter 2026 unit net cash costs are expected to be about 5% above the earlier US$2.00 per pound estimate, because gold sales were deferred.
FCX also says its US operations had lower operating rates in the third quarter because of flooding, power outages and wind. The third-quarter results are due on 27 October 2026.
Growth pipeline: where new copper is coming from
FCX is pursuing growth at existing mines. It is applying new leach methods at its US and South American mines, targeting an annual run rate of 300 million pounds by the end of 2026 from those initiatives, and it plans an investment decision on doubling Bagdad’s capacity by the end of 2026. It is also advancing the regulatory process for an El Abra expansion in Chile.
Southern Copper is building new mines. Its second-quarter 2026 release lists Tia Maria in Peru (120,000 tonnes of refined copper a year using solvent extraction and electrowinning, initial production in the second half of 2027, estimated cash cost US$1.16 per pound), Michiquillay in Peru (about 225,000 tonnes of copper a year, start-up targeted for 2032) and Los Chancas (130,000 tonnes a year, targeted for 2031). In Mexico, El Pilar (36,000 tonnes of cathode a year, production planned for the second half of 2029) has its environmental permits. Dates are company targets; the 10-K says Tia Maria has already faced delays.
To compare “organic growth”, read the project tables, not the headline. A project in a studies phase, like Michiquillay (which reports inferred resources, not reserves), is a long way from the producing mines in the reserve table. For a primer on the deposit types behind these mines, see our guide to porphyry copper deposits and our wider overview of copper deposit types and top producing countries.
▶ Farmonaut video explaining remote sensing for mining: how satellites measure ground from a distance. New copper projects like those above start with this kind of screening of a licence area, before drilling. · 2:01
Reserve life calculator
A quick test used by analysts is reserves divided by yearly output. It is a ratio, not a mine plan: it ignores grade decline, new reserves, and mines that close early or run past their reserves. Use the calculator below with the two companies’ figures, or with a company of your own. For example, FCX’s 112.3 billion pounds divided by its 2025 output gives roughly 33 years (about 27 years on 2024 output of 4,214 million pounds, before the mud rush), but its Indonesian reserves are tied to mining rights that run to 2031, with an extension to 2041 that FCX assumes. Southern Copper’s 108,955 million pounds divided by 2,108 million pounds gives about 52 years, but that figure is contained copper and includes development projects.
Calculator
How many years of output do the reserves cover?
Enter reserves and yearly output in million pounds, and your own price and cost.
- Revenue per year, US$ million: $8,000
- Cash margin per pound, US$: 2.50
- Cash margin per year, US$ million: $5,000
Defaults are round example numbers, not either company’s figures and not a forecast. Reserve life is reserves divided by output; it ignores grade decline and new reserves. The price and cash cost are examples: use today’s price and the cost definition you trust. Amounts in US dollars.
How to use company reserve and cost numbers
A short checklist for anyone reading either annual report.
- Check the basis. Recoverable, contained, consolidated and net equity are four different numbers.
- Check the price assumption behind the reserve, and the date of the statement.
- Check the cost definition and the by-product credits. Ask what the cost would be before credits.
- Look at the country and licence terms, not just the tonnes. PTFI’s licence runs to 2041 and an extension is described by FCX as something it believes would add reserves, not as a fact.
- Separate reserves from resources. Only reserves have passed the economic tests.
Satellite data does not replace a company’s reserve statement, but it is used before one exists. In the early stage of a copper project, satellite imagery screens a licence area for alteration minerals and structures that point to targets for sampling. Our satellite-based mineral detection service produces exploration targets ahead of any resource estimate, and a quote request starts with your licence boundary. The related Farmonaut piece on Freeport-McMoRan stock trends covers the company’s share history.
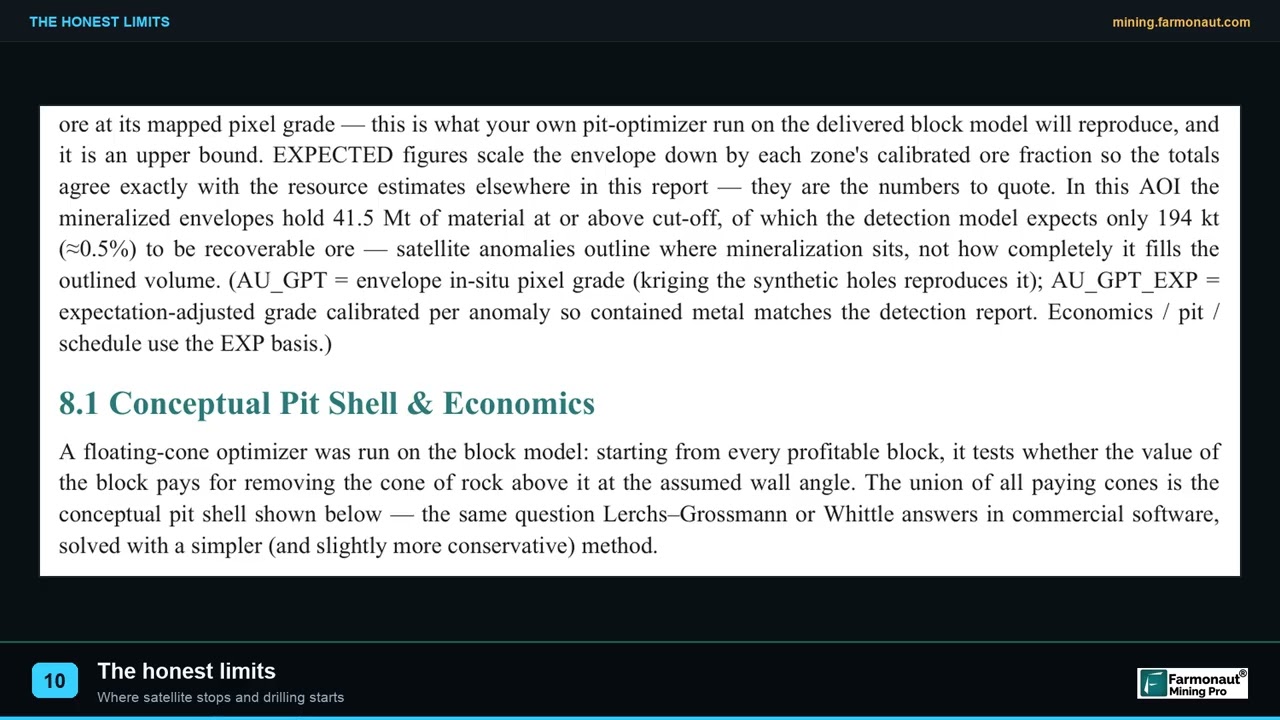
▶ Explains the three limits of satellite mineral exploration that matter in due diligence. · 2:08
Frequently asked questions
Which has more copper reserves, Freeport-McMoRan or Southern Copper?
They are close. FCX reports 112.3 billion pounds of recoverable copper (consolidated) and Southern Copper reports 108.955 billion pounds of contained copper, each as of 31 December 2025. FCX’s net equity figure is 78.6 billion pounds. The bases differ, so neither can be called larger without adjustment.
Who produces more copper, FCX or Southern Copper?
FCX, even in a year hit by the Grasberg mud rush: 3,383 million pounds against 2,108 million pounds in 2025. Before the incident, FCX produced 4,214 million pounds in 2024.
Why is Southern Copper’s cash cost so low?
Because of by-product credits. Before them, its 2025 cost was US$2.17 per pound. Molybdenum, silver and zinc sales credited US$1.59 per pound, leaving US$0.58.
Is SCC the same as Southern Copper?
Yes. Southern Copper Corporation trades on the NYSE under the ticker SCCO and is also listed in Lima. Searches for “SCC” usually mean the same company. Grupo Mexico owned 88.9% at the end of 2025.
Where are Freeport-McMoRan’s biggest mines?
Grasberg in Indonesia, Morenci in Arizona (FCX holds 72%) and Cerro Verde in Peru. Those three made up 70% of FCX’s 2025 consolidated copper production.
When will Grasberg return to full production?
FCX’s stated plan, as of 2 October 2026, is 80% of capacity in mid-2027 and near full capacity by the end of 2027. Third-quarter 2026 mill throughput averaged about 140,000 tonnes of ore per day, roughly 67% of the rate before the September 2025 incident, and PTFI’s smelter restarted in late August 2026.
How much of Southern Copper’s revenue is copper?
About 74.8% of its 2025 sales came from copper. Molybdenum, silver and zinc supply most of the rest, which is why their prices move its costs.
Does FCX produce gold as well as copper?
Yes. FCX produced 956,000 ounces of gold in 2025, and 97% of its gold reserves are in Indonesia.
Which company has the larger growth pipeline?
The two are pursuing different routes: FCX is expanding existing mines (leach technology, Bagdad, El Abra), while Southern Copper is developing new mines (Tia Maria, El Pilar, Michiquillay, Los Chancas). Timing and permits differ by project, so compare project by project.
Are these figures investment advice?
No. They are filing data with dates, and the page contains no price targets or recommendations. Company results change every quarter, so check the latest filing.
This page is for information only. It is not investment advice. It names no price targets and makes no recommendation to buy or sell any security.
Farmonaut mining
Screen a copper licence from space
Investors can see satellite-derived exploration targets for a licence area, ahead of any resource estimate.

Mining Pro sample view, synthetic data
Keep reading

Sources
- Freeport-McMoRan, Form 10-K for 2025: s22.q4cdn.com
- Southern Copper, Form 10-K for 2025: southerncoppercorp.com
- Southern Copper, second quarter and six months 2026 results: southerncoppercorp.com
- Freeport, second-quarter and six-month 2026 results (23 July 2026): s22.q4cdn.com
- Freeport, third-quarter 2026 operational update (2 October 2026): s22.q4cdn.com
- USGS, Mineral Commodity Summaries 2026: Copper: pubs.usgs.gov
- ICSG press release, Copper Market Forecast 2026/2027 (23 April 2026): icsg.org
- ICSG press release, preliminary data for July 2026 (24 September 2026): icsg.org
- Mining.com, Copper price forecasts lifted for 2026 (14 October 2026): mining.com
- Freeport, Form 8-K with third-quarter 2026 operational update (SEC EDGAR, 2 October 2026): sec.gov
Discussion
Questions, corrections or field experience? Share them below. First-time comments are reviewed before they appear, and your email is never published.
No comments yet. Be the first to add a question or your experience.

 Sahara Mining
 Sean Mining Limited
 NTS Group (Pty) Ltd
 Mine4Africa
 Lithspo Minerals Limited
 Tintina Mining Group
 Dalgety Minerals Pty Ltd
 Vortex Minerals Pty Ltd
 Faith At Work (Pty) Ltd
 Geotech Mining Solutions plc
 Vulcan International Limited
 Kidepo Associates
 GKY Mining
 Alkimy SARL
 Double A Trading
 GemSprout Metals Limited
 Qader Group
 Ileys General Trading
 SG Gold Mining LLC
 VRV Global Pte Ltd
 Omsri International FZE
 G.I.T.T.
 Jaunita Erss Ltd
 SRK Consulting
 Berks Gold Limited











