

Japan · Farm statistics guide
Agriculture in Japan: Farm Size, Yields and Trade Data
Japan farmed 4.24 million hectares in 2025, and its 836,000 farm businesses averaged 3.6 hectares: 33.7 in Hokkaido and 2.6 elsewhere (MAFF). Rice dominates, workers average 67.7 years, and Japan imports most feed grain and wheat.
Key takeaways
- Cultivated land fell from 4.471 million ha in 2016 to 4.239 million ha in 2025 (MAFF).
- The average farm business managed 3.6 ha in 2025: 33.7 ha in Hokkaido and 2.6 ha in other prefectures (MAFF census).
- Core farm workers fell from 1.363 million in 2020 to 1.036 million in 2025, with an average age of 67.7 (MAFF).
- Japan’s rough rice yield was about 7.0 t/ha in 2025/26, against about 8.5 t/ha in the US (USDA).
- Calorie self-sufficiency was 37% in FY2025; since February 2025 about 99% of Japan’s corn imports have come from the US (MAFF, USDA FAS).
In this article
- Agriculture in Japan at a glance
- How much farmland does Japan have?
- Farm size in Japan: Hokkaido versus the rest
- Japan's farm workforce and its age
- Crops and yields in Japanese agriculture
- Food self-sufficiency in Japan
- Japan's grain imports and the US farm trade link
- Japan vs US farm structure compared
- Calculator: compare your rice yield and farm size with Japan
- Technology and smart farming in Japan
- Sustainability and climate pressures on Japanese farms
- How to get newer numbers than this page
- FAQ
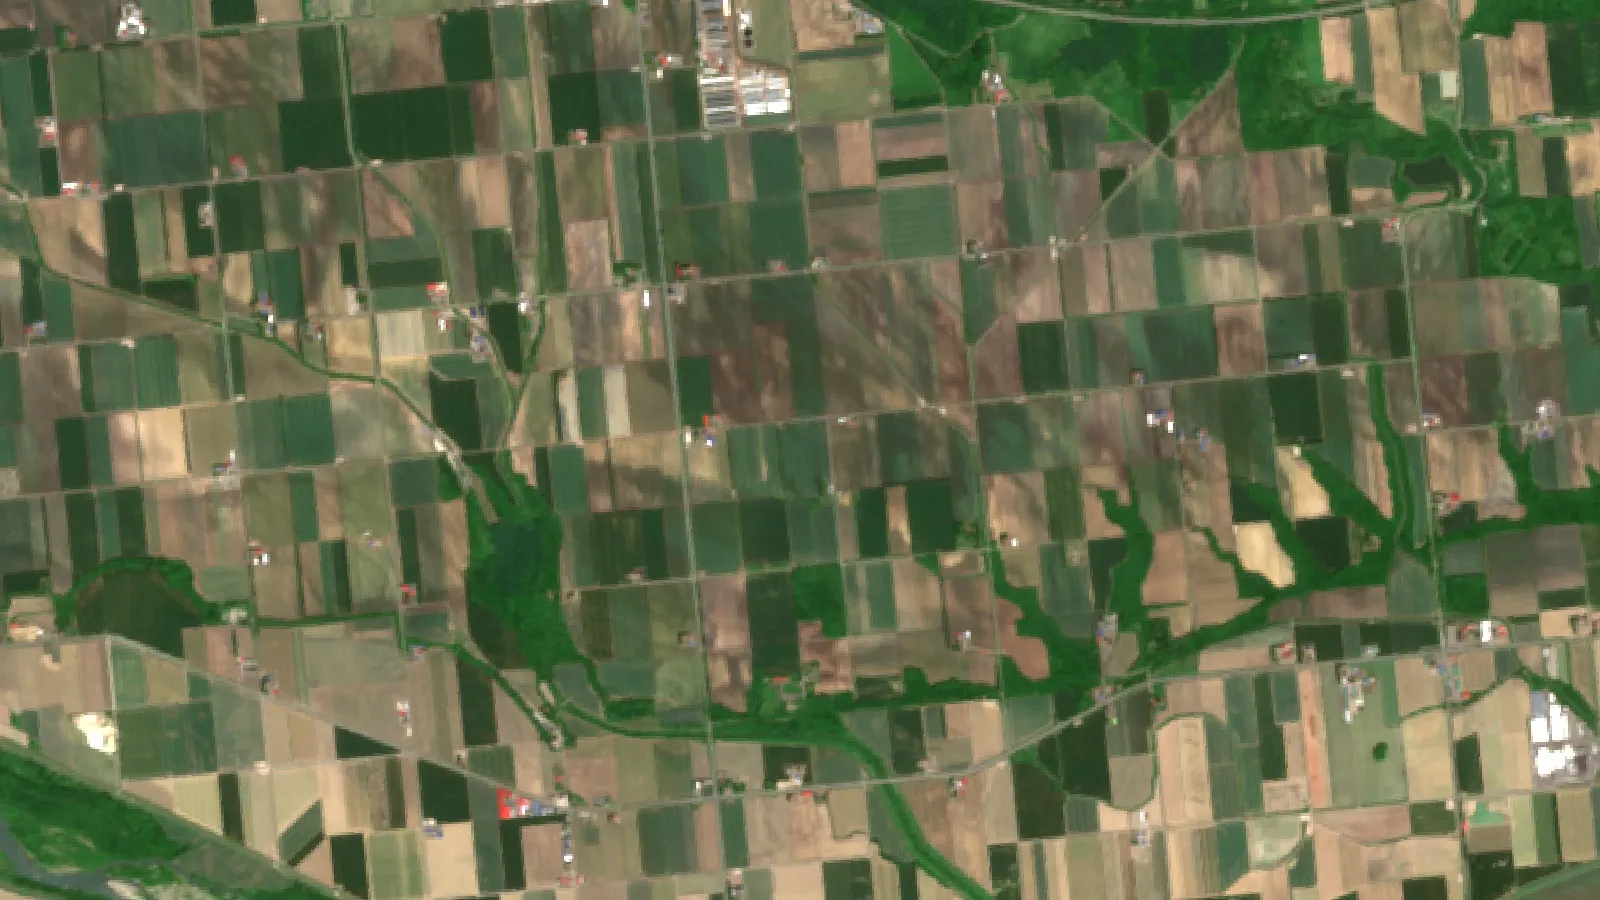
Agriculture in Japan runs on 4.24 million hectares of cultivated land (2025), worked by about 836,000 farm businesses whose average holding was 3.6 hectares, according to Japan’s Ministry of Agriculture, Forestry and Fisheries (MAFF). Farms in Hokkaido averaged 33.7 hectares, while farms in the rest of the country averaged just 2.6 hectares. Rice is still the main crop, and Japan buys most of its feed grain and wheat from abroad, much of it from the United States, Canada and Australia.
This page sets out the numbers behind that picture: farm size, land, workers, rice yields, food self-sufficiency and grain imports. Each figure has a date and a named source. You will also find four charts built from official data and a calculator that compares your own rice yield and farm size with Japan’s.
Agriculture in Japan at a glance
The table gives the headline numbers. The sections below explain each one and where it comes from.
| Measure | Value | Year and source |
|---|---|---|
| Cultivated land | 4.24 million ha (about 10.5 million acres) | 2025, MAFF |
| Of which paddy | 2.30 million ha | 2025, MAFF |
| Farm businesses | 836,000 | 2025 census, MAFF |
| Average farm, all Japan | 3.6 ha (about 8.9 acres) | 2025 census, MAFF |
| Average farm, Hokkaido | 33.7 ha (about 83 acres) | 2025 census, MAFF |
| Core farm workers | 1.04 million, average age 67.7 | 2025 census, MAFF |
| Rice yield (rough) | About 7.0 t/ha | 2025/26 estimate, USDA FAS |
| Calorie self-sufficiency | 37% | FY2025, MAFF |
| Farm share of GDP | About 1% (farming, forestry and fishing) | 2024, World Bank |
How much farmland does Japan have?
Japan had 4.239 million hectares of cultivated land in 2025, down from 4.471 million hectares in 2016, according to MAFF’s farmland statistics table. That is a loss of about 232,000 hectares in nine years, or roughly 0.6% a year. In 2025, 41,000 hectares went out of use while only 9,000 hectares of new land were added.
Chart
Cultivated land in Japan
Million hectares, paddy plus upland fields, 2016 to 2025
For a US reader, 4.24 million hectares is about 10.5 million acres. That is a small area for a country of about 123 million people. Arable land covered about 11% of Japan’s land area in 2024, according to World Bank arable land data. Mountains, forests and cities take most of the rest.
Paddy fields make up a bit more than half of the cultivated area: 2.300 million hectares of paddy and 1.939 million hectares of upland fields in 2025. Japan also uses its land less fully than it once did. The planted area divided by the cultivated area, which MAFF calls the land use rate, fell from 91.7% in 2016 to 90.1% in 2025. Double cropping (for example wheat after rice) has become less common.
MAFF also counts about 98,000 hectares of abandoned farmland that could be brought back into use (FY2024). This land needs clearing, levelling or new soil before normal farming can start again.
Why the land keeps shrinking
Three forces explain most of the loss. First, older farmers retire and no one takes over the land, especially on steep, small plots in hill areas. Second, some farmland near cities is turned into housing, roads and factories. Third, natural disasters damage fields, and not every field is repaired. MAFF’s tables record the result (land taken out of use each year), not the reason for each hectare, so treat these as general causes rather than measured shares.
Farm size in Japan: Hokkaido versus the rest
The average Japanese farm business managed 3.6 hectares in the 2025 census, up from 3.05 hectares in 2020, according to MAFF’s census table on farm size. The national average hides a very large regional gap.
Chart
Average farm size by region
Hectares of cultivated land managed per farm business
- Hokkaido: 33.7 hectares per farm business in 2025, up from 30.21 hectares in 2020.
- All other prefectures: 2.6 hectares per farm business in 2025, up from 2.15 hectares in 2020.
Hokkaido is Japan’s northern island. Its flat plains support broadacre farms that grow wheat, potatoes, sugar beet and beans and keep dairy herds. A Midwest or Prairie farmer would find these farms easy to understand. The rest of Japan is a patchwork of small rice paddies, vegetable plots, orchards and tea fields, often on hills and terraces.
MAFF’s 2026 sample survey puts the averages a little higher again: 3.8 hectares nationally, 34.6 hectares in Hokkaido and 2.7 hectares elsewhere. MAFF warns that the 2026 numbers are sample estimates and should not be compared directly with the full census years.
Why Japanese farms stayed small
After 1945, land reform broke up large estates and gave land to the families who farmed it. That created millions of small owner farms. Inheritance, high land values near towns and long-standing limits on who may buy farmland kept many of them small. Steep terrain also matters: a hillside rice terrace cannot be merged into a large, square field.
The trend is now towards larger farms. As older farmers retire, their land is rented to neighbours, farm companies and community farming groups. The number of farm businesses fell from 1,377,000 in 2015 to 1,076,000 in 2020 and 836,000 in 2025, according to MAFF’s farm business statistics. With less land lost than farms lost, the land that remains is spread over fewer, larger units.
▶ How farm size, crops and labour differ between large and small farming systems. · 4:29
Japan’s farm workforce and its age
Japan had about 1.036 million core farm workers in 2025, down from 1.363 million in 2020, according to MAFF’s farm labour statistics. MAFF defines a core farm worker as a household member whose main job is farming the family’s own farm. The count does not include hired staff or part-time helpers.
Chart
Core farm workers in Japan
Thousand people whose main job is farming the family farm; 2026 is a sample estimate
The workforce is old. In 2025, 721,000 of these workers were 65 or older, about 70% of the total. Their average age was 67.7 years. The 2026 sample survey estimates 987,000 core workers, below one million, though MAFF says the sample result should not be compared directly with the census.
New entrants are not filling the gap. MAFF counted 42,900 new farmers in 2025, compared with 55,700 in 2017. New entrants include family members who take up farming, people hired by farm companies and people who start a new farm business on their own.
What an older workforce means in practice
Fewer and older workers push Japanese farms in three directions. They rent land to larger operators. They buy machines that save labour, such as rice transplanters, combines and drones for spraying. And they use contract services for jobs like harvest and drying. This is the background to Japan’s interest in smart farming tools, covered later on this page.
Crops and yields in Japanese agriculture
Rice dominates. USDA’s Foreign Agricultural Service (FAS) office in Tokyo estimates Japan harvested about 1.47 million hectares of rice in the 2025/26 market year and produced about 7.48 million tonnes of milled rice. Rough (unmilled) rice yield was about 6.99 tonnes per hectare, according to the FAS Grain and Feed Annual for Japan. FAS forecasts a slightly smaller rice area of 1.46 million hectares for 2026/27, as older farmers keep leaving.
How does that compare with the US? USDA put the US rough rice yield at 7,544 pounds per acre for 2025/26, or about 8.5 tonnes per hectare, in the September 2026 WASDE report. Japan’s yield is lower, but the two are not like for like. Japan grows mainly short-grain japonica rice for table use, prized for taste rather than tonnage, on small paddies. US rice is mostly long-grain, grown on large, laser-levelled fields in the South and in California.
Rice policy and feed rice
Japanese people eat less rice than they once did, so for years the government has paid farmers to switch some paddy from table rice to other uses. These include rice for processing, feed rice for livestock, soybeans and wheat. FAS reports that feed rice was the main alternative. In 2025/26, high table rice prices led some farmers to switch back to table rice, and feed rice plantings fell by about half. FAS expects some land to move back towards feed rice in 2026/27 as table rice prices soften.
For more on prices, see our pages on rice prices in Japan listed at the end of this article.
Vegetables, fruit, tea and greenhouse crops
Outside rice, many Japanese farms grow high-value crops on small areas. Vegetables, fruit, tea and flowers are common, often under glass or plastic. Greenhouses let growers produce strawberries, tomatoes, cucumbers and leafy greens over a longer season. Regions build brands around local produce, and Japan protects many regional food names with a geographical indication (GI) system, similar in idea to the EU’s protected names.
These crops earn more per hectare than rice, which helps a small farm stay viable. They also need more labour, and labour is the scarce resource. That is one reason greenhouse growers adopt climate control and automated watering.
Livestock and feed
Japan raises dairy cattle, beef cattle (including wagyu), pigs and poultry, but feeds them mainly with imported grain. FAS estimates Japan makes about 24 million tonnes of compound feed a year, mostly from imported raw materials. Laying hens use about 27% of it, pigs about 24%, beef cattle 20%, broilers 16% and dairy cows 13%. Bird flu and classical swine fever outbreaks have cut animal numbers, and feed output has stayed below 24 million tonnes for the last three years.
Food self-sufficiency in Japan
Japan grew enough food to supply 37% of its calories in FY2025, one point lower than the year before, according to MAFF’s food self-sufficiency release. Measured by value instead of calories, the rate was 66%, up two points, mainly because domestic rice and livestock prices rose.
The gap between the two numbers tells a story. Japan produces a lot of high-value food (fruit, vegetables, beef, premium rice), so it does well by value. It imports most of the bulky, calorie-dense commodities: feed grain, wheat and oilseeds. Livestock fed on imported grain does not count as fully domestic in the calorie measure.
Farming, forestry and fishing together added about 1% of Japan’s GDP in 2024, according to World Bank national accounts data. The sector is small in money terms but large in political weight, because of food security and rural communities.
Japan’s grain imports and the US farm trade link
Japan is a major buyer of US corn and wheat. FAS Tokyo projects Japan’s corn imports at 15.7 million tonnes for 2025/26 and 15.6 million tonnes for 2026/27. Since February 2025, about 99% of Japan’s corn imports have come from the United States, because US corn was the cheapest option. Most of that corn goes to animal feed; feed mills raised the share of corn in their rations above 50% from October 2025.
Wheat is more competitive between suppliers. In the 2024/25 market year Japan imported about 2.05 million tonnes of wheat and wheat products from Canada, 2.02 million tonnes from the United States and 0.79 million tonnes from Australia, according to the FAS report. FAS says Canada has been Japan’s top food wheat supplier since 2023/24, helped by its price and strong demand for bread wheat. Japan buys most food wheat through the state, which then resells it to flour mills.
What this means for US, Canadian and Australian growers
- Corn growers: Japanese feed demand is steady but sensitive to price. When rice or sorghum is cheaper, feed mills switch some of their rations away from corn.
- Wheat growers: Canada, the US and Australia compete closely for Japan’s food wheat market. Quality and price both matter.
- Beef and pork exporters: lower Japanese animal numbers after disease outbreaks can open room for imports, but check current market access rules and tariffs with your national trade agency.
Trade and tariff rules change. For export decisions, check current data from USDA FAS, Agriculture and Agri-Food Canada or the Australian Department of Agriculture, and get professional trade advice.
Chart
Japan’s wheat imports by supplier
Million tonnes of wheat and wheat products, market year 2024/25 (July to June)
Japan vs US farm structure compared
The table puts Japan and the US side by side on the measures in this article. US figures are from USDA; Japan figures are from MAFF and FAS.
| Measure | Japan | United States |
|---|---|---|
| Rough rice yield | About 7.0 t/ha (2025/26, FAS) | About 8.5 t/ha, 7,544 lb/acre (2025/26, USDA) |
| Main rice type | Short-grain japonica | Mostly long-grain |
| Typical farm | 2.6 ha outside Hokkaido (2025) | About 469 acres, or 190 ha, on average (2025, USDA NASS) |
| Corn trade | Imports about 15.7 Mt (2025/26) | Leading exporter to Japan |
| Feed grain basis | Mainly imported | Mainly home-grown |
The US corn yield for 2025/26 was 186.5 bushels per acre in the same WASDE report, about 11.7 tonnes per hectare. Corn is a different crop from Japan’s rice, so we do not compare the two directly.
Calculator: compare your rice yield and farm size with Japan
Use the calculator to compare your own rice yield with Japan’s 2025/26 average and to see how many average Japanese farms (outside Hokkaido) would fit on your land. Enter your own numbers; the defaults are examples only.
Try the numbers for your own farm below.
Calculator
How does your rice yield compare with Japan?
Enter your own area, yield and price to compare with the average in Japan.
- Your production: 6,200 cwt
- Your yield vs Japan: 1.0%
- Japanese average farms that fit on your area: 15.6
Example values only, not a benchmark or forecast. The Japan yield default (6,235 lb/acre) converts USDA FAS’s 2025/26 estimate of 6.99 t/ha rough rice; the Japan farm size default (6.4 acres) is MAFF’s 2025 census average of 2.6 ha outside Hokkaido. Change any input.
Technology and smart farming in Japan
With fewer and older workers, Japanese farms use technology to save labour. Common tools include GPS-guided tractors and rice transplanters, drones for spraying and scouting, automatic water gates for paddies, and climate control in greenhouses. Farm companies and cooperatives often share costly machines so that small farms can use them.
Drones need care: aerial spraying is regulated, and pesticide use must follow the product label and local rules. Check with your national aviation and pesticide regulators before you fly a spray drone.
How satellite monitoring fits small plots
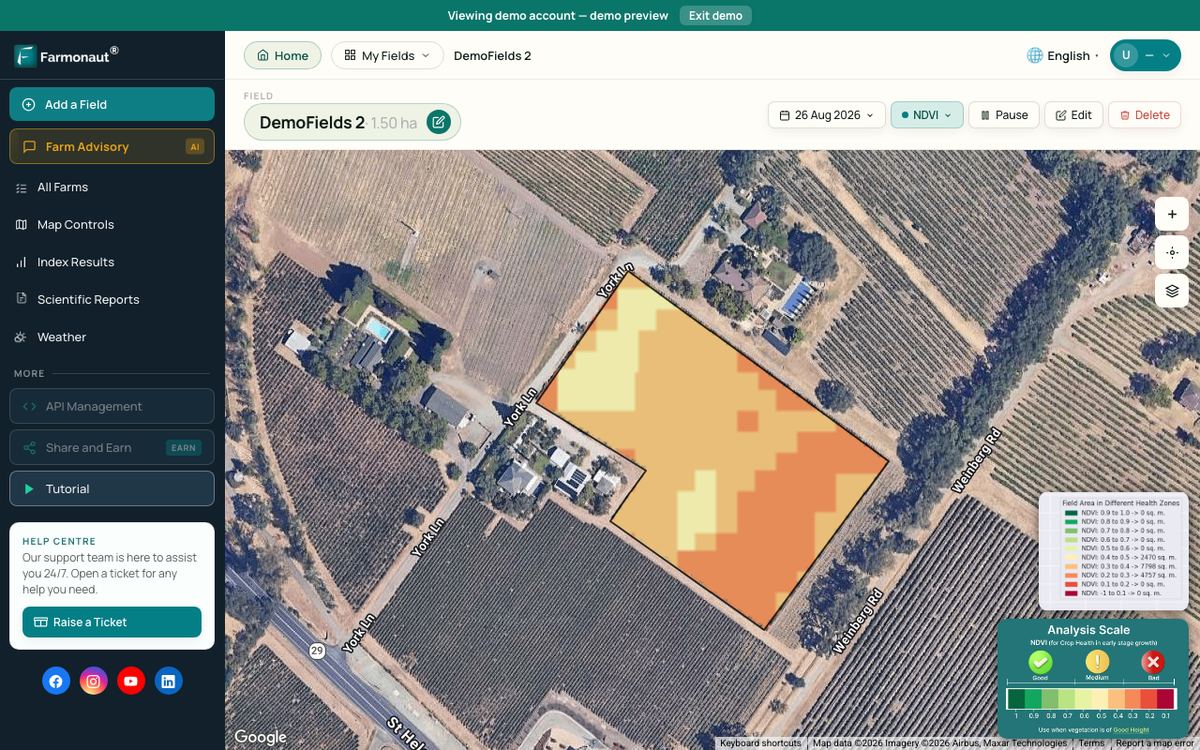
Satellites such as Sentinel-2 photograph farmland every few days. From those images, software works out vegetation indices such as NDVI, which show where plants are green and growing and where they are stressed. On many small plots, a farm manager can check crop condition across scattered fields without driving to each one. Clouds can block optical images during the rainy season, so a few passes may be missed.
Satellite images show where crop vigour changes; they do not name the cause. A field visit is still needed to find out whether a patch is short of water, nutrients or affected by pests.
The Farmonaut Satellite + AI Farm Monitoring System is one tool that provides these vegetation maps for fields you draw on a map, whether a 2-hectare paddy or a 30-hectare Hokkaido-style field.
Soil, compost and inputs
Japan imports most of the raw materials for its fertilizers, so price spikes hit farmers hard. Many growers use compost and manure from local livestock, and MAFF promotes lower use of chemical fertilizer and pesticide through its MIDORI Strategy for Sustainable Food Systems. Rates for any fertilizer or soil amendment should follow a soil test, the product label and local rules.

▶ Six plain steps to start precision farming without buying a robot. · 4:18
Sustainability and climate pressures on Japanese farms
Japanese farms face hotter summers, heavy rain and typhoons. Hot nights during grain filling can lower the quality of rice, for example by producing chalky grains. Breeders have released heat-tolerant rice varieties, and some farmers shift planting dates.
Paddy rice also releases methane. One way to cut it is to drain fields for a period in mid-season, which MAFF and research institutes have studied. Other practices include cover crops on upland fields, less tillage and recycling crop waste into compost. Forests cover much of Japan, and forestry, mushroom growing and wood biomass add income in hill areas, though they fall outside the farmland figures above.
▶ How satellite NDVI maps show crop stress across a farm before it is visible on foot. · 4:09
How to get newer numbers than this page
Every figure here has a date because each will be replaced. Use these sources for the newest data:
- Farmland, farm size, workers: MAFF’s basic data tables (Japanese) and English statistics pages, updated after each annual survey.
- Crop area and harvests: the Statistics Bureau’s Japan Statistical Yearbook, Chapter 8, with Excel tables.
- Rice, wheat and corn trade: the USDA FAS Grain and Feed reports for Japan, published at least twice a year.
- US yields for comparison: the monthly USDA WASDE report.
If a number here and a live source disagree, trust the live source.
Related pages on our site: Japan farming methods and smart techniques · satellite-based mineral detection · project query form · contact us.
FAQ
How much farmland does Japan have?
Japan had 4.24 million hectares of cultivated land in 2025, about 10.5 million acres, according to MAFF. About 2.30 million hectares of that was paddy. The total has fallen every year since at least 2016.
What is the average farm size in Japan?
The average farm business managed 3.6 hectares in the 2025 census. Hokkaido farms averaged 33.7 hectares, and farms in the rest of Japan averaged 2.6 hectares (MAFF).
What are the main crops grown in Japan?
Rice is the main crop, grown on about 1.47 million hectares in 2025/26 (USDA FAS). Japan also grows wheat, soybeans, potatoes and sugar beet, mainly in Hokkaido, plus vegetables, fruit and tea across the country.
How old are farmers in Japan?
Core farm workers averaged 67.7 years of age in 2025, and about 70% were 65 or older, according to MAFF’s census data.
How self-sufficient is Japan in food?
Japan’s calorie-based food self-sufficiency was 37% in FY2025. On a production value basis it was 66% (MAFF). Japan imports most of its feed grain and wheat.
Where does Japan get its corn and wheat?
About 99% of Japan’s corn imports have come from the United States since February 2025. For wheat, Canada, the US and Australia are the main suppliers, with Canada narrowly ahead in 2024/25 (USDA FAS).
Farmonaut crop monitoring
See your own fields from space
Draw your fields once and Farmonaut shows satellite vegetation maps for them through the season, on web, Android or iOS.



Keep reading
Sources
- MAFF, Basic data: farmland statistics (cultivated area, farm size), 2026: maff.go.jp
- MAFF, Basic data: farm business statistics, 2026: maff.go.jp
- MAFF, Basic data: farm labour statistics, 2026: maff.go.jp
- MAFF, Japan’s food self-sufficiency ratio, FY2025: maff.go.jp
- MAFF, Statistics in English: maff.go.jp
- USDA FAS, Japan Grain and Feed Annual (JA2026-0011), 2026: apps.fas.usda.gov
- USDA, World Agricultural Supply and Demand Estimates, September 2026: usda.gov
- World Bank, Arable land (% of land area), Japan, 2024: api.worldbank.org
- World Bank, Agriculture, forestry and fishing value added (% of GDP), Japan, 2024: api.worldbank.org
- Statistics Bureau of Japan, Japan Statistical Yearbook 2025, Chapter 8: stat.go.jp
- USDA NASS, Farms and Land in Farms 2025 Summary (February 2026): nass.usda.gov
Discussion
Questions, corrections or field experience? Share them below. First-time comments are reviewed before they appear, and your email is never published.
No comments yet. Be the first to add a question or your experience.

 Sahara Mining
 Sean Mining Limited
 NTS Group (Pty) Ltd
 Mine4Africa
 Lithspo Minerals Limited
 Tintina Mining Group
 Dalgety Minerals Pty Ltd
 Vortex Minerals Pty Ltd
 Faith At Work (Pty) Ltd
 Geotech Mining Solutions plc
 Vulcan International Limited
 Kidepo Associates
 GKY Mining
 Alkimy SARL
 Double A Trading
 GemSprout Metals Limited
 Qader Group
 Ileys General Trading
 SG Gold Mining LLC
 VRV Global Pte Ltd
 Omsri International FZE
 G.I.T.T.
 Jaunita Erss Ltd
 SRK Consulting
 Berks Gold Limited










