

Lithium ETFs · Fund comparison
Lithium ETFs Compared: Fees, Holdings and Assets
LIT holds $1.37 billion but 22.57% in Rio Tinto; BATT holds only 7.89% in lithium. Five lithium ETFs compared by fee, size, index and top holdings, with dates, a fee calculator and charts. Facts only, not advice.
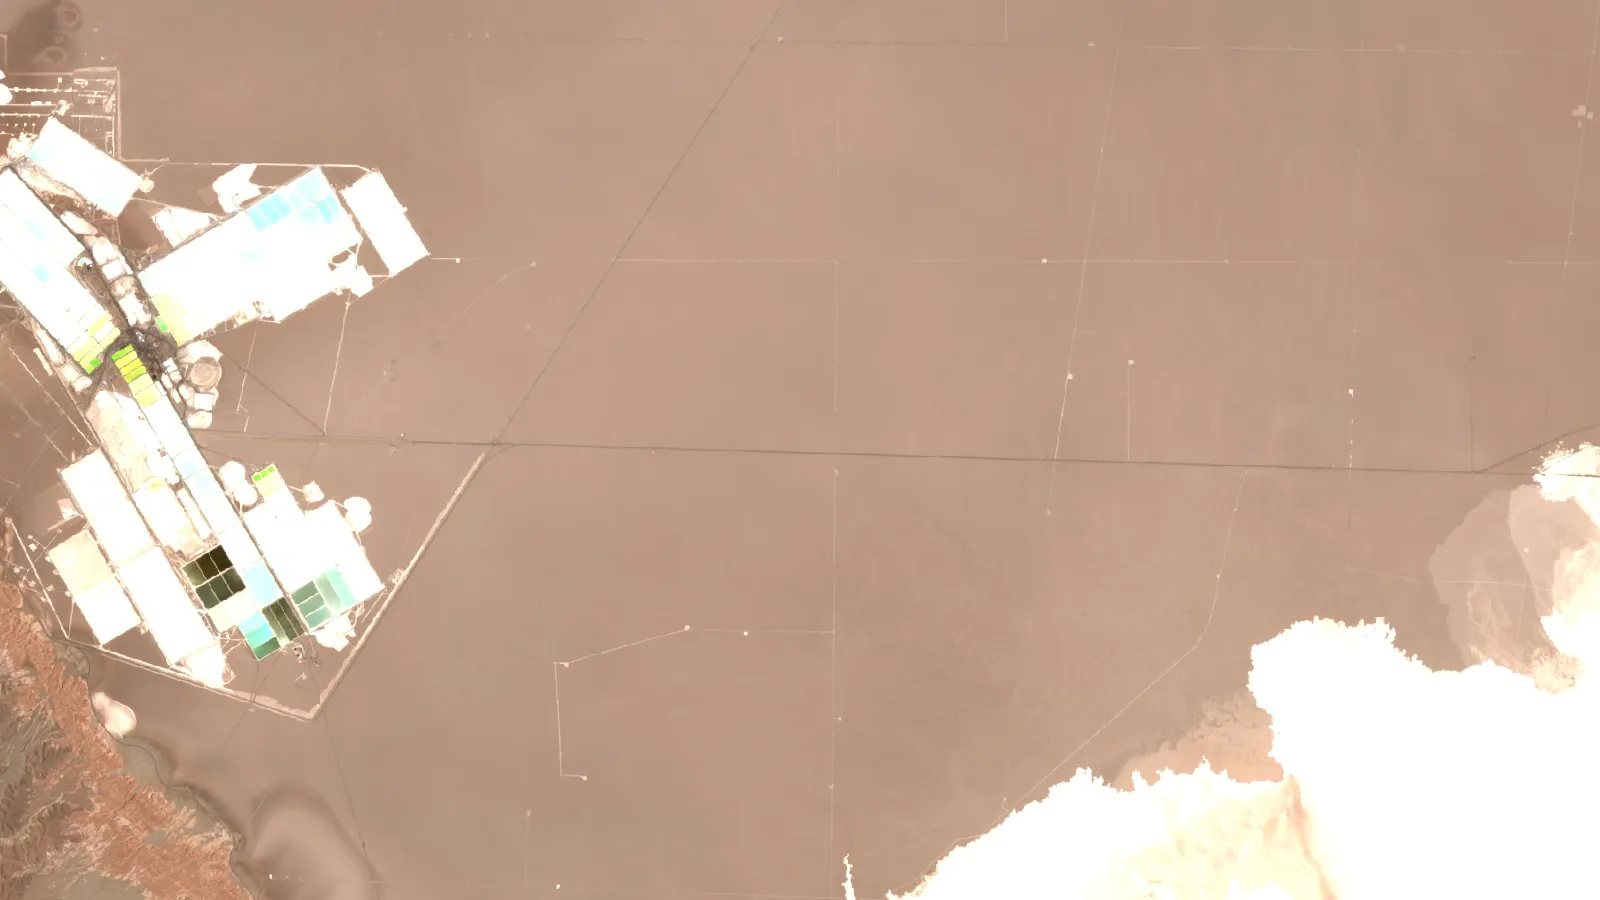
Key takeaways
- LIT is the largest lithium fund with $1.37 billion in net assets and a 0.75% expense ratio; Rio Tinto is 22.57% of it (Global X, 14 October 2026).
- ILIT has the lowest fee at 0.47% but only $11.2 million in net assets (iShares, 14 October 2026); LITP charges 0.65% on about $29.6 million.
- Lithium was 7.89% of BATT at 30 September 2026; copper (23.26%) and electric vehicles (18.70%) were larger (Amplify).
- Lithium carbonate in China was 104,400 yuan a tonne on 15 October 2026, down 21.03% in a month and up 43.01% in a year (Trading Economics).
- Rio Tinto completed its US$6.7 billion purchase of Arcadium Lithium in March 2025, so Arcadium no longer trades separately (Australian Mining Review).
In this article
- How we chose and compared these funds
- Lithium ETF comparison table: fees, size and holdings
- Lithium ETFs one by one
- Pure lithium miners or battery makers: what each fund owns
- What lithium ETF fees cost over time
- What moves lithium miner shares
- Risks written in lithium fund documents
- Ownership changes behind the holdings
- How to read a lithium fund fact sheet in five steps
- How satellite data helps assess the lithium projects behind these funds
- Frequently asked questions
Five US-listed and ASX-listed funds give a stock-market route into lithium, and they hold very different things. The Global X Lithium & Battery Tech ETF (LIT) is the largest, with net assets of $1.37 billion on 14 October 2026, but Rio Tinto is its biggest holding at 22.57% (Global X, 14 October 2026). The Sprott Lithium Miners ETF (LITP) and the iShares Lithium Miners and Producers ETF (ILIT) hold mainly lithium producers and explorers, while the Amplify Lithium & Battery Technology ETF (BATT) holds only 7.89% in lithium companies. This page compares fees, size, holdings and index rules, all dated, so you can see what a fund actually owns before you read anything else about it.
An exchange-traded fund (ETF) is a fund that trades on a stock exchange like a share and holds a basket of other securities. The US Securities and Exchange Commission (SEC) explains that each ETF share is a proportionate interest in the fund’s portfolio, and that the fund must calculate its net asset value (NAV, the value of all its assets minus liabilities, divided by shares) every business day (SEC Investor.gov bulletin on ETFs). This page gives facts and sourced numbers only. It is not investment advice and it does not rank funds as buys or sells.
How we chose and compared these funds
We included every fund that meets three tests: it is listed on the NYSE Arca, Nasdaq or the ASX, its name or index rules put lithium or the lithium battery chain at the centre, and its issuer publishes holdings and fees on its own website. These five funds pass: LIT, BATT, ILIT, LITP and the Global X Battery Tech & Lithium ETF (ACDC) on the ASX. The order below runs from largest to smallest by net assets in US dollars, with the Australian fund last because its size is reported in Australian dollars.
For each fund we used the issuer’s own page for the expense ratio (the yearly fee, shown as a percentage of assets), net assets, number of holdings and index. Where an issuer page did not list the full holdings in readable form, we used a holdings-data page and say so. Every figure carries its date, because net assets and weights change daily. Performance numbers are quoted only as the issuer reports them for 30 September 2026, and past performance does not predict future results.
One thing not to expect: a “lithium ETF” is not a lithium price tracker. The funds here hold company shares. Their results depend on share prices of miners, chemical makers, battery makers and carmakers, and not only on the price of the metal.
Lithium ETF comparison table: fees, size and holdings
| Fund (ticker) | Expense ratio | Net assets | Holdings | Index it follows | Largest holding |
|---|---|---|---|---|---|
| Global X Lithium & Battery Tech ETF (LIT) | 0.75% | $1.37 billion | 41 | Solactive Global Lithium Index | Rio Tinto, 22.57% |
| Amplify Lithium & Battery Technology ETF (BATT) | 0.59% | $107.6 million | 53 | EQM Lithium & Battery Technology Index | Tesla, 8.20% |
| Sprott Lithium Miners ETF (LITP) | 0.65% | $29.6 million | 42 | Nasdaq Sprott Lithium Miners Index | SQM, 11.62% |
| iShares Lithium Miners and Producers ETF (ILIT) | 0.47% | $11.2 million | 46 | STOXX Global Lithium Miners and Producers Index | SQM, 8.71% |
| Global X Battery Tech & Lithium ETF (ACDC), ASX | 0.69% | A$561 million or more | not stated | Solactive Battery Value-Chain Index | Panasonic, 4.13% |
Chart
Expense ratio by fund
Yearly fee as a percentage of assets, issuer pages, October 2026
Dates: LIT, BATT and ILIT fees, net assets and holdings counts are from issuer pages dated 14 October 2026 (Global X, Amplify, iShares). LITP net assets, holdings count and fee come from the StockAnalysis fund page (October 2026), which republishes holdings data (Finnhub); the largest holdings are from the same data, updated 14 October 2026. ACDC fee and size are from the Global X Australia page (15 October 2026), where the size is shown as “A$561+ million”.
Lithium ETFs one by one
1. Global X Lithium & Battery Tech ETF (LIT)
What it holds: lithium miners, chemical makers and battery makers. It is the largest and oldest fund in this group. LIT launched on 22 July 2010, trades on the NYSE Arca and follows the Solactive Global Lithium Index. Its index covers companies active in lithium mining, exploration or related work and/or lithium battery production, so its holdings run from miners to cell makers.
Chart
Net assets of the US-listed funds
US$ million, 14 October 2026 (LITP: October 2026 data page)
Holdings (14 October 2026): Rio Tinto 22.57%, Panasonic Holdings 7.03%, Samsung SDI 6.71%, Naura Technology 6.22%, TDK 6.14%, LG Energy Solution 5.10%, Tesla 4.66%, Albemarle 3.95%, EVE Energy 3.25% and BYD 3.16%. By sector at 30 September 2026, Materials were 44.23%, Information Technology 20.79%, Industrials 18.19% and Consumer Discretionary 15.29%.
Facts for and against: It has the largest net assets here ($1.37 billion) and the highest expense ratio (0.75%). One holding is nearly a quarter of the fund: Rio Tinto is a diversified miner that completed its US$6.7 billion purchase of Arcadium Lithium in March 2025 (Australian Mining Review), so the fund’s lithium exposure sits inside a company that also sells iron ore and copper. Issuer-reported NAV returns to 30 September 2026 were 21.42% over one year, 8.29% a year over three years and -2.78% a year over five years.
2. Amplify Lithium & Battery Technology ETF (BATT)
What it holds: battery value-chain companies, with lithium miners as a small slice. BATT launched in June 2018 on the NYSE Arca, has a total expense ratio of 0.59% and tracks the EQM Lithium & Battery Technology Index, which includes companies that earn over 50% of revenue from lithium battery technology, battery-metal supply-chain companies, and makers that earn 90% of revenue from electric vehicles.
Holdings (15 October 2026): Tesla 8.20%, BHP 7.11%, Freeport-McMoRan 6.43%, Contemporary Amperex Technology (CATL) 5.31%, Bloom Energy 4.65%, BYD 4.41%, Grupo Mexico 3.25%, TDK 3.08%, Samsung SDI 2.94% and Teck Resources 2.67%. By metal or theme at 30 September 2026: copper 23.26%, electric vehicles 18.70%, nickel 14.91%, battery technology 12.40%, lithium 7.89%, energy storage 7.88%.
Facts for and against: Net assets were $107.6 million with 53 holdings. Because copper and nickel outweigh lithium by a wide margin, BATT behaves more like a battery-materials fund than a lithium fund. Issuer NAV returns to 30 September 2026 were 13.93% over one year, 11.10% a year over three years and -0.75% a year over five years (Amplify).
3. Sprott Lithium Miners ETF (LITP)
What it holds: lithium producers, developers and explorers only. LITP launched on 1 February 2023, has an expense ratio of 0.65% and follows the Nasdaq Sprott Lithium Miners Index. It trades on Nasdaq.
Holdings (14 October 2026, data page): SQM 11.62%, Albemarle 10.81%, Ganfeng Lithium 9.66%, PLS Group 8.50%, Liontown Resources 7.34%, Lithium Americas 4.86%, Lithium Argentina 4.65%, IGO 4.63%, Tianqi Lithium 4.42% and Sigma Lithium 3.67%. The top ten made up 70.16% of the fund across 42 holdings (StockAnalysis).
Facts for and against: It is the purest lithium-miner exposure here, and its top ten holdings were 70.16% of the fund (StockAnalysis, 14 October 2026). Its net assets were about $29.6 million in October 2026, small enough that the spread between buy and sell prices can matter more than with LIT.
4. iShares Lithium Miners and Producers ETF (ILIT)
What it holds: lithium miners and producers; it has the lowest fee here. ILIT launched on 21 June 2023, trades on Nasdaq, charges 0.47% and follows the STOXX Global Lithium Miners and Producers Index.
Holdings (13 October 2026, data page): SQM 8.71%, Albemarle 8.03%, PLS Group 6.18%, Liontown 5.98%, Cosmo Advanced Materials & Technology 4.53%, Lithium Americas 4.44%, Lithium Argentina 3.78%, Ganfeng Lithium 3.38%, Tinci Materials 3.34% and Sigma Lithium 3.14%. The iShares page reports 46 holdings and a sector split of 86.09% Materials, 7.92% Industrials, 4.79% Information Technology and 1.07% Consumer Discretionary on 14 October 2026.
Facts for and against: Net assets were only $11.2 million on 14 October 2026 and the fund’s average daily volume over 30 days was 6,352 shares, and the 30-day median bid-ask spread was 0.39%. By country it is 36.45% China and 22.94% Australia. The iShares page reports a three-year standard deviation of 45.30% and a three-year beta of 1.50, which means large swings. Its NAV returns to 30 September 2026 were 7.60% over one year and -8.79% a year over three years.
5. Global X Battery Tech & Lithium ETF (ACDC), ASX
What it holds: a wide battery and electrification basket, listed in Australia and priced in Australian dollars. ACDC began on 30 August 2018, has a management fee and cost of 0.69% a year and follows the Solactive Battery Value-Chain Index.
Holdings (15 October 2026): Panasonic 4.13%, Hitachi 3.91%, TDK 3.66%, NGK 3.49%, Siemens 3.37%, LG Energy Solution 3.32%, Samsung SDI 3.08%, Tesla 3.07%, ABB 3.05% and Sumitomo Electric 3.02%. Lithium producers are small positions: Albemarle 1.65%, PLS Group 1.63%, Core Lithium 1.39%, Ganfeng 1.04% and Liontown 0.86%. By sector, Industrials were 39.46% and Materials 21.92%.
Facts for and against: This is the widest net of the five, so lithium miners explain only a small part of its holdings. The Global X Australia page shows assets of A$561 million or more; the ReviewETF.com.au comparison of Australian critical-minerals funds lists A$871.98 million for ACDC with no as-of date, against A$561+ million on the Global X Australia page, so the two sources differ (ReviewETF.com.au).
Pure lithium miners or battery makers: what each fund owns
The simplest way to sort these funds is by who earns the money in the portfolio. LITP and ILIT hold mostly companies that dig, evaporate or process lithium. A miner’s income rises and falls with the lithium price, and ILIT reported a three-year standard deviation of 45.30% at 30 September 2026. LIT sits in the middle: miners and chemical makers together are the Materials share (44.23%), and cell makers, equipment makers and carmakers make up the rest. BATT and ACDC are battery and electrification funds in which lithium miners are a minority.
Chart
ILIT holdings by country
Percent of market value, 14 October 2026; eight largest
Lithium appears in these funds in two forms. Hard-rock miners such as PLS Group and Liontown in Western Australia produce spodumene concentrate, a lithium-bearing mineral concentrate. Brine producers such as SQM in Chile pump salty water from salt flats and evaporate it into lithium carbonate. Cost structure and speed of restart differ between the two types, which is one reason holdings in the same fund can move in different directions on the same day. Our guide to Australian-listed lithium companies lists the ASX producers behind LITP’s and ILIT’s Australian holdings.
Concentration also differs. LITP’s top ten holdings were 70.16% of the fund and ILIT’s were 51.51% (StockAnalysis, October 2026). LIT’s top ten were 68.79%, but a single holding (Rio Tinto) was over 22%. Before you compare funds, open the issuer’s full holdings file and add up the weights of the lithium companies. The result is the share of the fund that truly depends on the metal.
What lithium ETF fees cost over time
The expense ratio is deducted from the fund’s assets every day, so you never get a bill. A fund with a 0.75% ratio takes US$75 a year from every US$10,000 held, against US$47 at 0.47%. Over ten years on a flat balance that is US$750 against US$470. Real balances move up and down, so treat the calculator below as an approximation that ignores growth and trading costs. Brokerage commissions and the bid-ask spread (the gap between the buy and sell price) come on top, and the iShares page reports a median spread of 0.39% for ILIT on 14 October 2026.
Calculator
What do two expense ratios cost you?
Enter your own amount and two fund fees. Results update as you type.
- Fee paid on fund B per year (US$): $47
- Difference per year (US$): $28
- Difference over the years held (US$): $280
Example values only, not benchmarks or forecasts. The fees default to the ILIT (0.47%) and LIT (0.75%) ratios on issuer pages in October 2026. The result assumes a flat balance, so it ignores growth, trading costs and spreads.
What moves lithium miner shares
The US Geological Survey (USGS) estimates that batteries took 88% of global lithium end use, and that world mine production was 290,000 tonnes of contained lithium in 2025, with Australia at 92,000, China at 62,000 and Chile at 56,000 (USGS Mineral Commodity Summaries 2026). The same report gives a 2025 average battery-grade lithium carbonate price of about $9,000 a tonne in real terms.
Prices since then have swung. The most active lithium carbonate contract on the Guangzhou Futures Exchange reached a two-year high above 200,000 yuan a tonne in mid-May 2026, then fell nearly 30% by 22 July 2026 as restarted mines raised fears of oversupply (Mining.com, 22 July 2026). On 15 October 2026 Trading Economics showed 104,400 yuan a tonne, down 21.03% over a month and up 43.01% over a year (Trading Economics). These are Chinese contract prices for battery-grade lithium carbonate, and they differ from the prices other regions report. Our page on lithium ore price trends covers the price drivers in more detail.
Beyond the metal price, four things drive miner results: how much new supply returns when idled mines restart, battery chemistry choices, export rules in producing countries (Zimbabwe has said it will ban lithium concentrate exports from 1 January 2027, per the Mining.com report above), and the cost of getting a project from discovery to production. The last point is where exploration data matters. A good deal of the lithium that funds hold today began as exploration targets found by geologists using maps, geochemistry and other survey data years before first production; our overview of spodumene pegmatites at James Bay shows how one belt is read from outcrop.

▶ A satellite-based exploration case study for lithium in Nigeria (10:49). · 10:49
Risks written in lithium fund documents
Every fund page in this group carries the same standard warning: past performance does not guarantee future results, and holdings are not recommendations. Beyond that boilerplate, the documents and data above point to concrete, checkable risks.
Chart
NAV returns reported by the issuers
Percent, to 30 September 2026; 3-year is annualised
- Volatility: ILIT reported a three-year beta of 1.50 and a standard deviation of 45.30% at 30 September 2026. Beta of 1.50 means the fund has moved about one and a half times as much as its benchmark market index.
- Small funds can close: The Themes Lithium & Battery Metal Miners ETF (LIMI) filed a notice on 8 September 2026 that it would stop trading on 21 September 2026 and liquidate around 25 September 2026 (SEC filing).
- Concentration: One company was 22.57% of LIT and 11.62% of LITP.
- Currency and country exposure: ILIT was 36.45% China on 14 October 2026, and BATT was 27.48% China at 30 September 2026.
- Index rules: Each index decides which companies qualify and when it rebalances. BATT rebalances quarterly, and LIT reconstitutes annually, so weights between those dates drift with prices.
Environmental and community risk also reaches the share price. Water use in salt-flat brine operations, tailings from hard-rock mines and land access can delay projects. The video below explains seven common environmental effects of mining in plain terms.
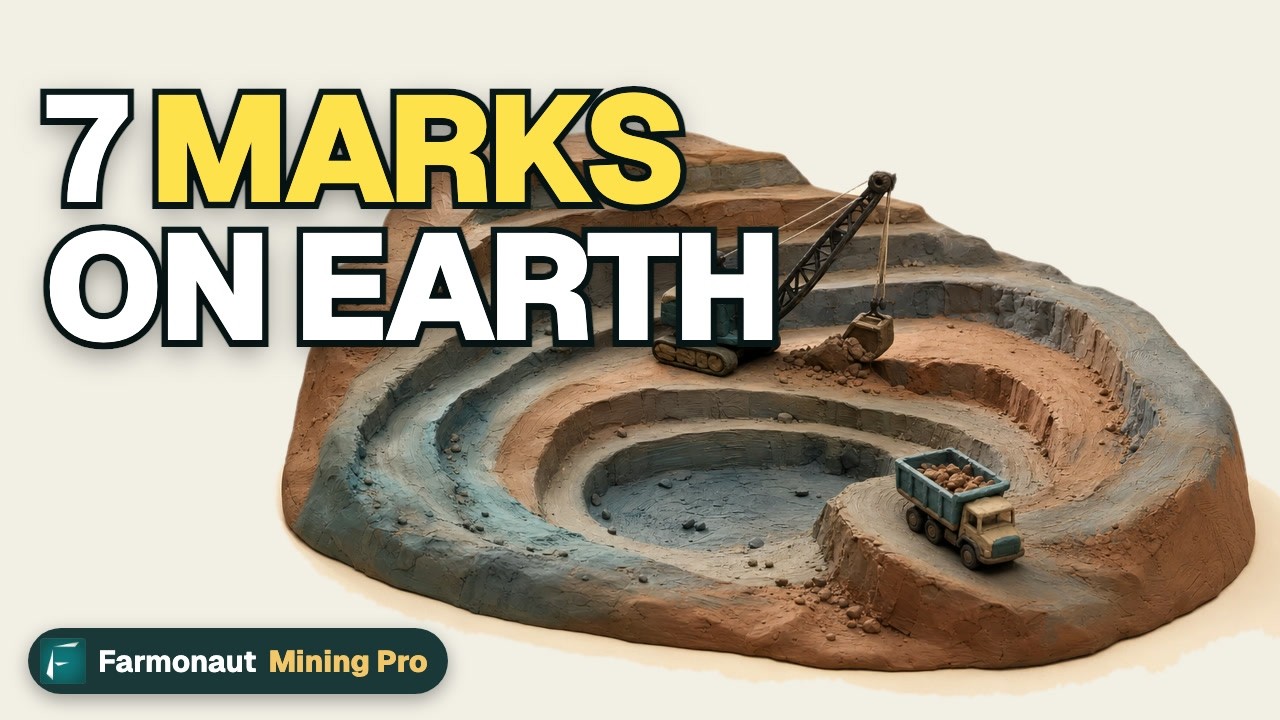
▶ The seven environmental impacts of mining, explained in clay (2:31). · 2:31
Ownership changes behind the holdings
Arcadium Lithium no longer trades as a separate listed company: Rio Tinto completed its US$6.7 billion purchase in March 2025 (Australian Mining Review). Holdings, fees and net assets in this guide are as the issuers published them on the dates shown.
The ASX list keeps changing. ReviewETF.com.au listed 11 Australian critical-minerals funds with an average fee of 0.51% in its comparison (ReviewETF.com.au), so check the exchange’s list before you rely on a short list of names.
How to read a lithium fund fact sheet in five steps
The five steps in the diagram turn the numbers on any issuer page into a clear picture of what you would own. They take about ten minutes per fund, and they are the same for the funds in this guide or for a new fund launched next year.
Infographic
Reading a fund page in 5 steps
- 1Find the indexRead what the index counts as lithium exposure.
- 2Open full holdingsDownload the holdings file from the issuer.
- 3Add up lithium weightsSum only companies that mine or process lithium.
- 4Check size and spreadNet assets, volume and bid-ask spread show trading cost.
- 5Note the dateWrite the as-of date beside every number.
How satellite data helps assess the lithium projects behind these funds
The mines and developers inside these funds all began as exploration targets. Farmonaut is a US-based company that screens licence areas with satellite data and reports alteration zones, structure and ranked targets within 5 to 20 business days, ahead of any drilling. Its output is an exploration target, not a resource estimate and not a reserve. If you hold a lithium licence or advise on one, you can see how satellite mineral detection works or send a project query. The video below explains the platform.
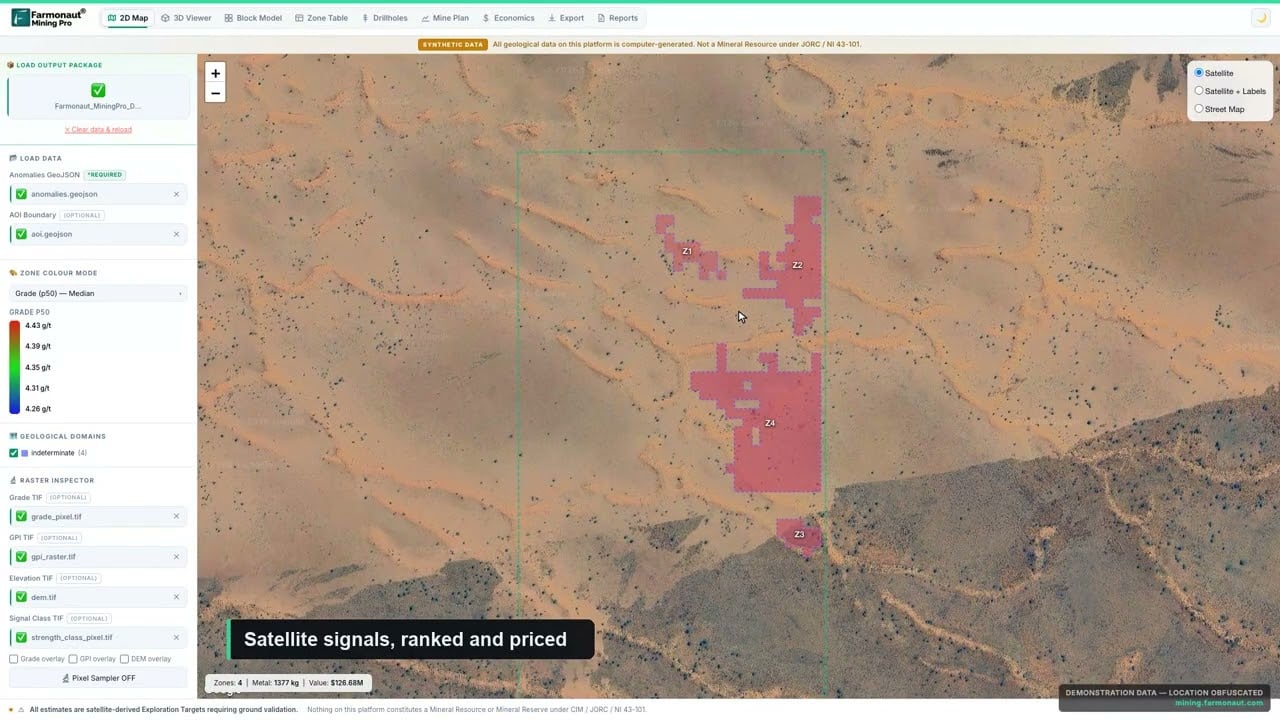
▶ A quick look at the Farmonaut Mining Pro platform (4:56). · 4:56
For a closer look at a related question, see our guide: Mining Kits for Exploration: Field Gear List and Lab Fees.
If this topic matters to you, read Lithium ETFs Compared: LIT, BATT, LITP, ILIT Fees next.
Frequently asked questions
What is the largest lithium ETF?
By net assets, the Global X Lithium & Battery Tech ETF (LIT) at $1.37 billion on 14 October 2026, per Global X. On the ASX, the Global X Battery Tech & Lithium ETF (ACDC) reported A$561 million or more on 15 October 2026.
Which lithium ETF has the lowest fee?
Of the five funds compared here, the iShares Lithium Miners and Producers ETF (ILIT) at 0.47%, then BATT at 0.59%, LITP at 0.65%, ACDC at 0.69% and LIT at 0.75%, all as stated on issuer pages in October 2026. A lower fee does not mean lower risk, and the fee is one of several facts.
What is the difference between a lithium mining ETF and a lithium battery ETF?
A mining fund such as LITP or ILIT holds companies that extract or process lithium. A battery fund such as BATT or ACDC holds cell makers, carmakers, equipment suppliers and battery-metal miners. Lithium companies were 7.89% of BATT at 30 September 2026.
Does a lithium ETF hold physical lithium?
No. The funds in this guide hold shares of companies. Their index rules, listed above, set which companies qualify.
What does the expense ratio mean?
It is the yearly cost of running the fund, as a percentage of assets, and it is taken from the fund’s assets automatically. A 0.75% ratio costs US$75 a year per US$10,000 held, before trading costs.
What is the best lithium ETF?
This page does not recommend a fund. The right comparison depends on what you want to hold: pure miners (LITP, ILIT), a mix of miners and battery makers (LIT) or a wide battery-chain fund (BATT, ACDC). Compare the holdings and fees dated above with your own needs, or ask a licensed adviser.
Which lithium ETFs hold Albemarle?
On the dates above, Albemarle was 10.81% of LITP, 8.03% of ILIT, 3.95% of LIT and 1.65% of ACDC. Check the issuer’s holdings file for current weights.
Why do fund figures change so often?
Net assets and holding weights are recalculated daily, and index providers rebalance on set dates. Check the issuer’s page for the as-of date.
Which lithium ETFs can Australian investors buy?
ACDC trades on the ASX. Funds listed in the US, such as LIT, can usually be reached through some international brokers, but availability, tax treatment and fees depend on the broker and your country. ReviewETF.com.au lists Australian critical-minerals funds.
How is lithium priced and where can I check it?
Battery-grade lithium carbonate is quoted per tonne, mainly in Chinese yuan on the Guangzhou Futures Exchange and in US dollars from price reporters such as Benchmark Mineral Intelligence. Trading Economics showed 104,400 yuan a tonne on 15 October 2026.
Do lithium ETFs pay dividends?
Some do. iShares reported a 30-day SEC yield of 0.79% for ILIT as of 30 September 2026, and Global X reported 0.45% for LIT on 14 October 2026. Both pay semi-annually.
Can satellite data find lithium?
Satellites cannot see lithium directly. They map clay alteration, rock types and structure around pegmatites and brine basins, which helps rank ground to test on the ground.
Not investment advice. Fees, holdings and net assets are quoted as the issuers reported them on the dates shown and change daily.
This page is for information only. It is not investment advice and does not recommend buying or selling any fund or share. Fees, net assets and holdings are quoted as published on the dates shown and change daily. Past performance does not predict future results.
Farmonaut mining
Screen a lithium licence from space
Send your licence boundary to get a quote for satellite screening that ranks exploration targets to test before you drill.

Mining Pro sample view, synthetic data
Keep reading
Sources
- SEC Investor.gov, Updated Investor Bulletin: Exchange-Traded Funds (2023): investor.gov
- Global X, Lithium & Battery Tech ETF (LIT), 14 October 2026: globalxetfs.com
- Amplify ETFs, BATT fund page, 14-15 October 2026: amplifyetfs.com
- iShares (BlackRock), Lithium Miners and Producers ETF (ILIT), 14 October 2026: blackrock.com
- StockAnalysis, LITP holdings, 14 October 2026: stockanalysis.com
- StockAnalysis, ILIT holdings, 13 October 2026: stockanalysis.com
- Global X Australia, Battery Tech & Lithium ETF (ACDC), 15 October 2026: globalxetfs.com.au
- ReviewETF.com.au, Critical Minerals ETFs comparison: reviewetf.com.au
- USGS, Mineral Commodity Summaries 2026: Lithium: pubs.usgs.gov
- Mining.com, Lithium price sinks to five-month low (22 July 2026): mining.com
- Trading Economics, Lithium carbonate price (15 October 2026): tradingeconomics.com
- SEC filing, Themes ETF Trust, LIMI liquidation notice (8 September 2026): sec.gov
- Australian Mining Review, Rio Tinto completes Arcadium Lithium acquisition (March 2025): australianminingreview.com.au
Discussion
Questions, corrections or field experience? Share them below. First-time comments are reviewed before they appear, and your email is never published.
No comments yet. Be the first to add a question or your experience.

 Mulopwe Metals Mining Ltd
 Tintina Mining Group
 Dalgety Minerals Pty Ltd
 Vortex Minerals Pty Ltd
 Faith At Work (Pty) Ltd
 Geotech Mining Solutions plc
 Vulcan International Limited
 Kidepo Associates
 GKY Mining
 Alkimy SARL
 Double A Trading
 GemSprout Metals Limited
 Qader Group
 Ileys General Trading
 SG Gold Mining LLC
 VRV Global Pte Ltd
 Omsri International FZE
 G.I.T.T.
 Jaunita Erss Ltd
 Almosi SARL
 SRK Consulting
 Berks Gold Limited
 Mwerezi Minerals Company Limited
