

Table of Contents
- Introduction: Mining Impacts on Water Areas
- The Scale of the Problem, in Numbers
- How Mining Contaminates Water Areas
- The 2021 and 2023 Reviews: What They Found
- Case Study: The Gold King Mine Spill
- Comparison Table: Water Body, Activity, and Mitigation
- Who Pays for Cleanup, and How Much
- Monitoring and Treatment Technology
- Calculator: Estimate a Mine-Discharge Metal Load
- How Farmonaut Supports Mining Water Monitoring
- How to Check the Current Numbers Yourself
- FAQs — Mining Impacts on Water Areas
- Conclusion
- Farmonaut Satellite Solutions
- Try it: Result
Mining Impacts on Water Areas: What the Data Shows
Reviewed August 2026 against the U.S. Government Accountability Office (GAO-23-105408), the U.S. EPA’s Gold King Mine response records, and the Susquehanna River Basin Commission’s abandoned mine drainage program.
Mining contaminates water areas mainly through three pathways: acid mine drainage that leaches heavy metals into streams, sediment runoff that smothers aquatic habitat, and direct spills from tailings or containment failures. In the United States, the GAO counted at least 22,500 abandoned hardrock mine features on federal land as of its January 2023 report, and the Susquehanna River Basin Commission puts abandoned mine drainage’s toll on Pennsylvania’s waterways at more than 5,500 miles. Those two numbers, from two different government sources, are the clearest evidence that this is not a one-time event but an ongoing, quantifiable liability.
This page works through what a widely cited mining impacts on water areas review found in 2021 and again in 2023, what has changed since, and — because AI summaries can tell you that acid mine drainage exists but not what it costs to fix or how to check a fresher number — the article leans on named federal reports, a real 2015 spill, and a calculator you can run with your own inputs.
The Scale of the Problem, in Numbers
Two federal-adjacent datasets, counted differently, illustrate the size of the U.S. legacy-mine problem. The GAO’s January 2023 report (GAO-23-105408) identified at least 22,500 abandoned hardrock mine features — shafts, adits, waste piles, and pits — on land managed by the Department of the Interior and the U.S. Forest Service. Separately, the Susquehanna River Basin Commission cites nearly 250,000 abandoned mine lands across Pennsylvania alone, a legacy of coal mining that predates the state’s 1977 reclamation requirements. The two figures use different definitions and cover different geographies, but both point the same direction: legacy mining sites vastly outnumber the funding available to fix them.

How Mining Contaminates Water Areas
Site clearance and excavation increase sediment runoff and change groundwater flow before a single chemical is used. Extraction and processing then add cyanide in gold recovery or sulfuric acid in copper leaching, either of which can reach surface or groundwater if containment fails. The broader category of negative effects of mining on the environment covers air and land impacts too, but water carries contamination the farthest and the longest.
- Acid mine drainage (AMD): Sulfide minerals exposed to water and oxygen form sulfuric acid, which dissolves and mobilizes arsenic, lead, and mercury. The Susquehanna River Basin Commission notes AMD can run up to 10,000 times more acidic than neutral water.
- Sediment loads: Erosion at cleared sites blocks light penetration, lowers dissolved oxygen, and disrupts fish spawning downstream.
- Groundwater disruption: Mines that intersect aquifers change flow patterns that can persist for decades after closure — this is the mechanism behind Pennsylvania’s multi-generational AMD burden.
- Chemical leaching: Processing reagents that escape improper waste handling contaminate groundwater over the long term, independent of any single spill event.
The 2021 and 2023 Reviews: What They Found
Two dated snapshots of this research are worth naming directly, since they are what many searches for this topic are actually looking for.
2021: Acid Mine Drainage and Sedimentation
The 2021 wave of research on mining impacts on water areas centered on acid mine drainage as the dominant, persistent threat: sulfide exposure producing sulfuric acid and dissolved metals that reach adjacent rivers and lakes, with treatment often needed for decades after a mine closes rather than a fixed cleanup window. Alongside AMD, the 2021 material flagged sediment loading from site erosion as a compounding driver of biodiversity loss in downstream fisheries — a finding that lines up with the Susquehanna basin’s still-open 5,500-mile figure today.
A fuller survey of what the journal literature reports on these pathways, study by study, is collected in a separate review. Anyone trying to trace a frequently repeated quote in this research back to its source will find the academic mine-water literature examined claim by claim.

2023: Monitoring, Recycling, and Basin-Wide Thinking
By 2023, the same body of work — including coverage referencing Canadian diamond mining practices — had shifted toward what could be done about it: real-time satellite imaging for early detection of tailings dam problems, mine-water recycling to cut freshwater withdrawal, and a push to regulate at the watershed level instead of mine-by-mine, since overlapping discharges from adjacent sites compound toxicity across a shared basin. That basin-wide framing is now standard practice in how U.S. regulators and companies think about cumulative impact, even where individual permits are still issued site by site.

Case Study: The Gold King Mine Spill
On August 5, 2015, an EPA-supervised excavation at the Gold King Mine near Silverton, Colorado, ruptured a plug holding back contaminated mine water, releasing about 3 million gallons into Cement Creek. The plume — colored bright orange by iron oxide and laden with metals — moved through the Animas River, into the San Juan River, and toward Lake Powell, prompting drinking-water and irrigation shutoffs downstream. The Bonita Peak Mining District, which includes Gold King, was subsequently added to the EPA’s National Priorities List, and settlement pond treatment with pH adjustment has continued at the site since, with the most recent settlement agreements posted in March 2023.
Compare that single event to an ongoing, engineered response in Pennsylvania: the Tioga River restoration project treats about 5 million gallons of contaminated discharge per day, addressing five major mine discharges to restore more than 20 miles of stream. One is an acute failure measured once; the other is a chronic condition measured every day. Both are counted in gallons, and the contrast shows why “mining impacts on water” cannot be reduced to a single incident.

Comparison Table: Water Body, Activity, and Mitigation
| Water Body Type | Primary Contamination Pathway | Documented Example | Mitigation Approach in Use |
|---|---|---|---|
| Headwater rivers and streams | Acid mine drainage from exposed sulfide ore | Boulder River basin, Montana — a USGS Abandoned Mine Lands Initiative study area | Passive/active AMD treatment, watershed-scale monitoring |
| Regional stream networks | Historic, unremediated coal mine drainage | Pennsylvania: 5,500+ miles of waterways affected, per the Susquehanna River Basin Commission | 300+ state/federal treatment systems built to date; lime dosing; constructed wetlands |
| Rivers downstream of a containment failure | Acute release of impounded mine wastewater | Gold King Mine, Cement Creek/Animas River, Colorado — Aug. 5, 2015 (EPA) | Emergency settlement ponds, pH adjustment, Superfund (NPL) listing |
| Federal and state abandoned-mine inventories | Legacy shafts, waste rock, and unaddressed discharge | 22,500 features on U.S. federal land, per GAO (Jan. 2023) | Prioritized safeguarding/reclamation funded via DOI and USDA appropriations |
Who Pays for Cleanup, and How Much
Under GAO-23-105408, the Department of the Interior spent about $109 million and the Department of Agriculture spent about $10 million on abandoned hardrock mine cleanup across fiscal years 2017 through 2021 — a combined $119 million over five years. Interior accounted for 91.6% of that spending and Agriculture 8.4%.
That spending has not kept pace with the liability. The USDA’s own fiscal exposure estimate for abandoned hardrock mine cleanup rose from $6 billion to $12 billion, a figure reflected in its FY2024 Budget Explanatory Notes as of March 2023 — a doubling in the agency’s own accounting of what it will eventually cost, without a matching increase in appropriated funds. GAO’s recommendation following that finding was procedural: both DOI and USDA needed to report total cleanup cost estimates to Congress more clearly, which neither had done consistently before the report.
Monitoring and Treatment Technology
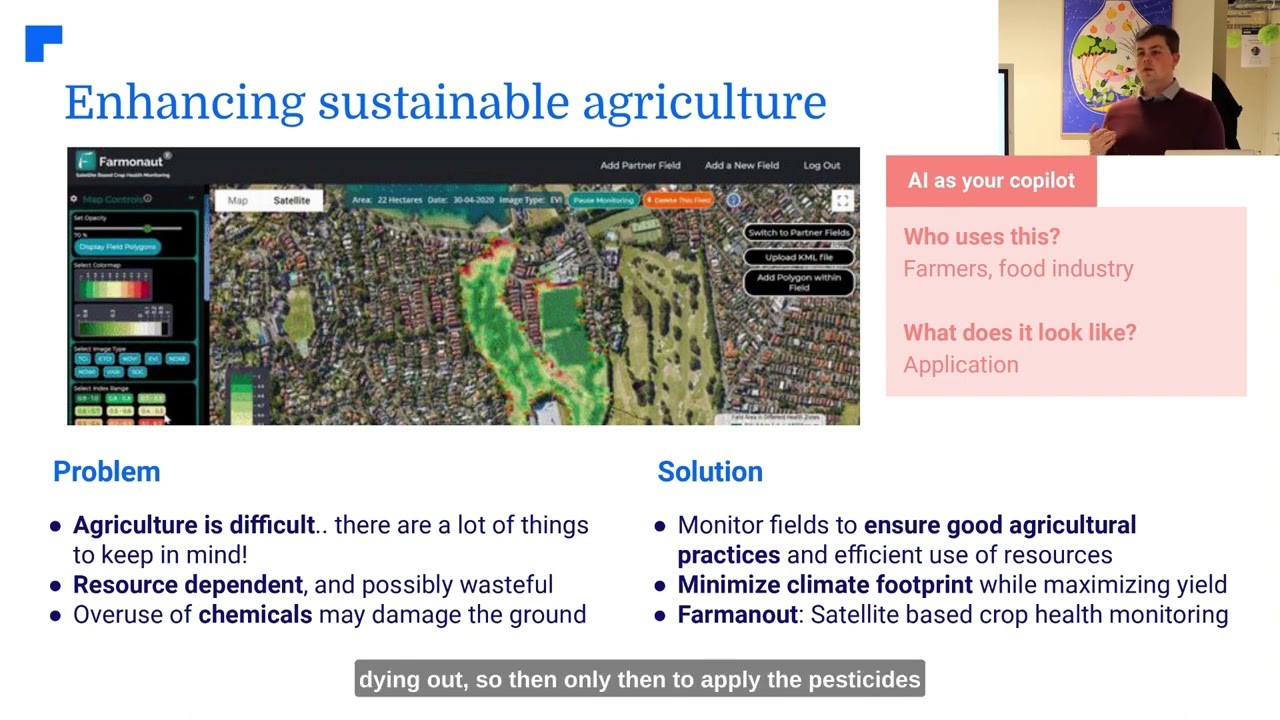
Multispectral satellite imagery tracks turbidity and vegetation stress near mine sites, and pairing it with ground-based sensors gives continuous readings on pH and metal content rather than periodic sampling. The technology referenced in reviews of Yukon and Alaska gold mining practices follows the same pattern seen at Gold King and in Pennsylvania: early detection shortens the gap between a discharge starting and a response beginning. On the treatment side, bio-augmentation uses microorganisms to break down residual processing chemicals, membrane filtration and nanotechnology adsorbents remove trace contaminants at lower cost than a decade ago, and passive treatment wetlands reduce sediment and pollutant runoff without ongoing chemical inputs — the same wetland principle behind Pennsylvania’s 300-plus constructed treatment systems.
None of this replaces basin-wide oversight. Where several mines discharge into one watershed, the cumulative pollutant load can shift regional water chemistry even when each individual permit is in compliance — which is why the 2023 review material pushed regulators toward basin-level frameworks instead of site-by-site sign-off, with community and tribal water monitoring increasingly folded into that oversight.

Calculator: Estimate a Mine-Discharge Metal Load
Use your own discharge flow and lab concentration to see the daily metal load in pounds, and the estimated concentration after mixing into a receiving stream, using the standard water-treatment conversion (MGD × mg/L × 8.34 = lb/day).
Result:
How Farmonaut Supports Mining Water Monitoring
Farmonaut applies the same satellite-monitoring approach described above to mining operations directly.
- Satellite-Based Monitoring for Mining Sites: Multispectral imagery tracks vegetation, soil, and water turbidity near mine sites, supporting the kind of early-detection workflow covered in the water management systems for mining guide.
- Jeevn AI Advisory: Tailored, data-driven guidance for resource extraction, environmental protection, and emergency planning.
- Blockchain-Based Traceability: The traceability platform gives end-to-end transparency across the mining supply chain.
- Environmental Impact Tracking: The carbon footprint monitoring feature measures and manages operational impact, including on water areas.
- API Access: Developers can build on Farmonaut’s API and the developer docs for custom monitoring and reporting.
- Fleet & Resource Management: The Fleet Management system tracks resource movement near sensitive water areas.




For larger operations, the farm and mine management tools extend the same monitoring to crop, forest, and mining advisory at scale. For a related regional case, see Farmonaut’s coverage of the Ravenswood mine in Queensland.

How to Check the Current Numbers Yourself
Every figure in this article carries a source and a date because every one of them will be updated again. Here is the durable method rather than a snapshot:
- Federal abandoned-mine counts and cleanup spending: Search GAO’s report database for “abandoned hardrock mines” — GAO revisits this topic periodically and each report supersedes the last count.
- New Superfund listings tied to mining: Check the EPA National Priorities List, which is updated as new sites are proposed and finalized.
- State-level reclamation progress: States with legacy mining run their own dashboards — Pennsylvania’s is documented through the Susquehanna River Basin Commission; other mining states publish equivalents through their own reclamation agencies.
- Site-specific water quality: USGS’s National Water Information System publishes real-time and historical stream-gauge and water-quality data for many mine-affected watersheds, including the Animas River near the Gold King Mine site.
- Your own discharge: Compare the calculator above against your NPDES discharge monitoring report or your state environmental agency’s lab results.
FAQs — Mining Impacts on Water Areas
1. What did the 2021 review of mining impacts on water areas find?
It centered on acid mine drainage and sediment loading as the two dominant pathways of water damage, noting that AMD often needs treatment for decades after mine closure rather than a fixed remediation period.
2. What changed in the 2023 review of mining impacts on water areas?
The 2023 material shifted toward solutions: real-time satellite monitoring for early detection, mine-water recycling to cut freshwater use, and a push toward basin-wide regulation instead of site-by-site permitting.
3. How many abandoned mines affect water areas in the United States?
At least 22,500 abandoned hardrock mine features exist on U.S. federal land alone, per GAO-23-105408 (January 2023) — and that count excludes state and private land, where totals like Pennsylvania’s roughly 250,000 abandoned mine lands are counted separately.
4. Is the Gold King Mine spill still affecting water quality?
The Bonita Peak Mining District, which includes Gold King Mine, remains on the EPA’s National Priorities List, with treatment systems and monitoring ongoing since the August 5, 2015 spill; the most recent settlement agreements were posted in March 2023.
5. What is the difference between acid mine drainage and a tailings spill?
AMD is a chronic, slow-release process from exposed sulfide minerals that can run for decades. A tailings or containment spill, like Gold King Mine, is an acute, one-time release — usually far larger in an instant, but shorter-lived than a chronic AMD source.
6. Can satellite monitoring reduce mining’s water impacts?
Multispectral and radar satellite imagery can flag turbidity changes and ground deformation near tailings facilities before a failure escalates, shortening the time between a problem starting and a response beginning — the same logic behind Farmonaut’s mining monitoring tools.
Conclusion
The reviews from 2021 and 2023 established the mechanism (acid mine drainage, sediment, chemical leaching) and the response (monitoring, recycling, basin-wide regulation). What has not changed since either review is the funding gap: a $119 million five-year federal cleanup budget against a liability GAO’s own source doubled to $12 billion. That gap is why abandoned features keep aging into active pollution sources, and why the durable habit for anyone tracking this topic is checking GAO, the EPA’s NPL, and your state reclamation agency directly rather than relying on any single year’s summary — including this one.
For monitoring tools built around this same problem, see Farmonaut’s carbon footprint monitoring, traceability system, and fleet management.
Farmonaut Satellite Solutions: Affordable Satellite Monitoring & Insights
Get started with satellite-driven insights for mining water monitoring.
Discussion
Questions, corrections or field experience? Share them below. First-time comments are reviewed before they appear, and your email is never published.
No comments yet. Be the first to add a question or your experience.

 Mine4Africa
 Lithspo Minerals Limited
 Tintina Mining Group
 Dalgety Minerals Pty Ltd
 Vortex Minerals Pty Ltd
 Faith At Work (Pty) Ltd
 Geotech Mining Solutions plc
 Vulcan International Limited
 Kidepo Associates
 GKY Mining
 Alkimy SARL
 Double A Trading
 GemSprout Metals Limited
 Qader Group
 Ileys General Trading
 SG Gold Mining LLC
 VRV Global Pte Ltd
 Omsri International FZE
 G.I.T.T.
 Jaunita Erss Ltd
 Almosi SARL
 SRK Consulting
 Berks Gold Limited
 Mwerezi Minerals Company Limited
