

Mining methods · Pros and cons guide
Open Pit Mining Advantages and Disadvantages: Real Costs
An open pit costs far less per tonne moved than an underground mine, but only where the waste above the ore is limited and the walls stay up. Real strip ratios, cost per tonne of ore, pit wall and water risks, and a pit versus underground cost calculator.
Key takeaways
- At Barrick’s Nevada Gold Mines in 2025, a tonne mined in a pit cost US$3.17 against US$142.50 underground; counting waste (5.7 tonnes per tonne of ore), the pit cost for each ore tonne was about US$21 (Barrick Q4 2025 mine statistics; the per-ore figure is derived as cost per tonne moved x (1 + strip ratio)).
- Among the eight pits charted below, strip ratios (tonnes of waste per tonne of ore) ranged from 0.71 at Southern Copper’s Buenavista to 15.75 at Barrick’s Carlin in 2025, and moved sharply between 2024 and 2025 at several pits.
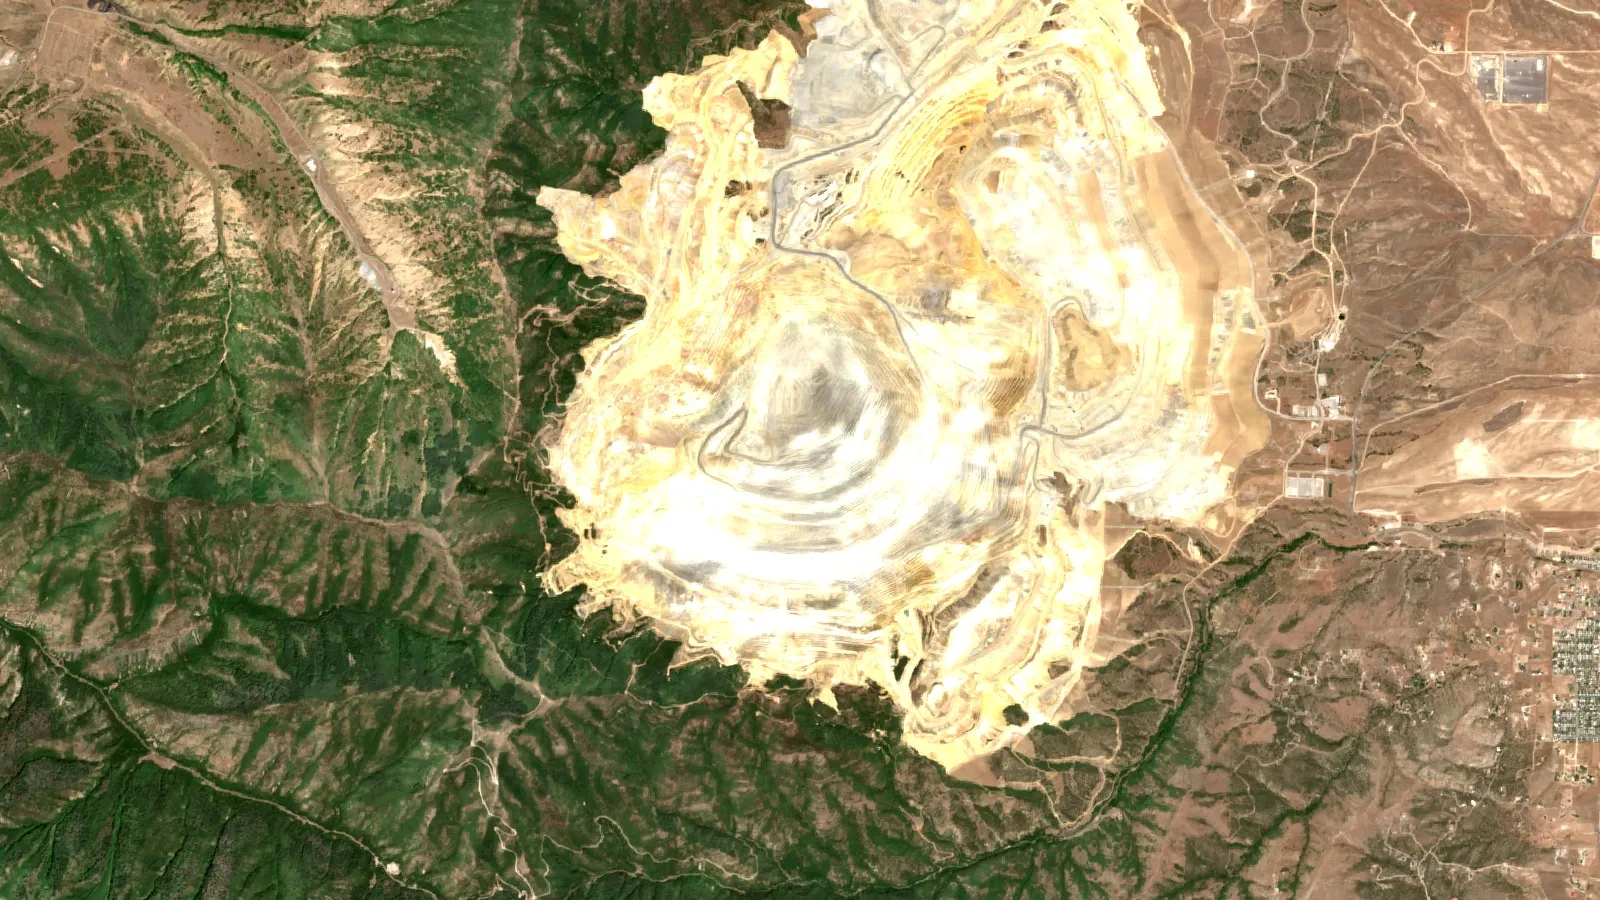
- Pit walls are the main engineering risk: the April 2013 slide at Bingham Canyon moved about 165 million tons of rock from a 970-metre pit, and nobody was hurt because operators had evacuated the area (GSA Today, January 2014).
- Surface mining suits shallow deposits: EIA says it is often used for coal under about 200 feet and supplies about two-thirds of US coal, and USGS reports eight open pit mines shipped 98% of US usable iron ore in 2025.
- Metal mining, pits and underground mines together, made up 66% of on-site land disposal reported to the US Toxics Release Inventory in 2023 (US EPA), so closure, waste rock and water need budgeting from the start.
In this article
- Open pit mining advantages and disadvantages at a glance
- When is an open pit the right method?
- How strip ratio decides whether a pit works
- Open pit mining costs per tonne: pit versus underground
- Advantages of open pit mining
- Disadvantages of open pit mining
- Open pit versus underground mining: how to choose
- Open pit design basics: benches, ramps and slopes
- Strip mining and open pit mining: what is the difference?
- From pit to product: what happens to copper ore
- Screening a site before designing a pit
- Frequently asked questions
An open pit is cheap to run per tonne moved and quick to start, but it only pays where the ore is shallow enough that the rock above and beside it can be removed for less than the ore is worth. At Barrick’s Nevada Gold Mines complex in 2025, mining a tonne in a pit cost US$3.17 and mining a tonne underground cost US$142.50, yet the pits moved 5.7 tonnes of waste for each tonne of ore, so the pit cost for each tonne of ore was about US$21 (Barrick Q4 2025 mine statistics; the per-ore figure is derived: cost per tonne moved x (1 + strip ratio)). The rest of this guide shows where the advantages come from, what goes wrong, and how to judge a pit before anyone drills.
The figures below come from company filings, US agencies and a peer-reviewed landslide study, each dated. Where we calculate something ourselves, the text says so. This page is written for mining consultants and licence holders weighing a pit against an underground mine; it is general information, not engineering advice for a specific site.
Open pit mining advantages and disadvantages at a glance
The table sets each trade-off against a number from a real operation or an official source. The sections after it explain each row.
| Factor | What the evidence shows | Source |
|---|---|---|
| Cost per tonne moved | US$3.02 to US$4.38 in Barrick’s 2025 pits, against US$119 to US$206 at its Nevada underground mines | Barrick, Q4 2025 mine statistics |
| Waste to move | Strip ratios from 0.71 (Buenavista, Mexico) to 15.75 (Carlin, Nevada) among the eight pits charted below, 2025 | Southern Copper Form 10-K; Barrick |
| Speed and scale | Early start-up, high output and few skilled workers are listed as textbook advantages | Altiti and others, IntechOpen |
| Pit wall stability | Bingham Canyon’s wall failure in April 2013 moved about 165 million tons of rock; nobody was hurt because the area had been cleared | GSA Today, January 2014 |
| Water | Pits fill with water when pumping stops; the Berkeley Pit in Montana is held below a set level by pumping and treatment | PitWatch; EPA and Montana DEQ decision |
| Land and waste rock | Metal mines were 66% of on-site land disposal of toxic-release chemicals in the US in 2023 | US EPA, TRI National Analysis |
| Energy | Diesel and electricity were over 75% of the energy used at nine Canadian open pits (2000 data) | Natural Resources Canada |
When is an open pit the right method?
Four conditions decide it: how deep the ore sits, how much waste lies above and around it, how stable the rock is, and whether the land and permits allow a hole of that size.
Shallow, broad ore bodies
Pits suit massive or flat-lying deposits close to the surface. The standard textbook list of pit shapes includes flat-lying seams, massive deposits on flat ground, dipping seams and massive deposits in high relief such as copper sulphide (Altiti, Alrawashdeh and Alnawafleh, IntechOpen, 2021). In coal, the US Energy Information Administration (EIA) says surface mining is often used when the seam is less than 200 feet (about 60 metres) down, and underground mining when it is deeper (EIA, Coal explained). The US Department of Energy’s coal profile puts the dividing range at 100 to 200 feet and adds hilly terrain as a reason to go underground (US DOE, Energy and Environmental Profile of the US Mining Industry: Coal).
Depth limits are economic, not fixed. The same IntechOpen chapter quotes about 500 metres as a typical limit, yet the Bingham Canyon copper pit in Utah was 970 metres deep when its wall failed in 2013 (GSA Today, January 2014). A pit can go as deep as the ore pays for the waste above it.
Low-grade ore in large volumes
Pits favour deposits where each tonne carries little metal but there are many tonnes. Southern Copper’s Buenavista mine in Mexico reported copper grades near 0.51% in its 2025 ore, and its Cuajone pit in Peru about 0.62% (Southern Copper Form 10-K for 2025). Grade is the share of metal in the rock; a grade of 0.5% copper means five kilograms of copper per tonne. At those grades only cheap, bulk mining pays, which is why such deposits are mined from the surface. Iron ore follows the same logic: in 2025, eight open pit mines shipped 98% of the usable iron ore sold in the United States (USGS, Mineral Commodity Summaries 2026: Iron Ore).
Stable rock and manageable water
Steeper walls mean less waste to strip, but only if the rock holds. Slope stability must be maintained, and benches and drainage need proper design, the IntechOpen chapter notes. Wet ground and heavy rain add cost: Southern Copper’s filing describes a dewatering and depressurisation plan for Buenavista to deal with pit drainage and slope pore pressure. Dry, well-draining ground is cheaper to mine.
Land, permits and neighbours
A pit takes a large, visible area. Reclamation costs and bonds are part of the price: the IntechOpen chapter lists surface damage that may require reclamation, with a bond added to the production cost, and a large waste dump area as standard disadvantages. If a deposit lies under a town, a river or protected ground, the best method may be underground or no mine at all.
How strip ratio decides whether a pit works
The strip ratio is the tonnes of waste that must be moved to reach one tonne of ore. A low ratio means less rock to move per tonne of metal and usually a lower operating cost; the ratio can be stated as an overall figure for the whole pit or as an instantaneous figure for one stage (IntechOpen). The pit limit is set where the next slice of waste costs as much as the ore beneath it is worth. The textbook break-even form is the maximum strip ratio = (value of ore minus production cost) divided by the cost of stripping one tonne of waste, so a rise in metal price or a fall in stripping cost lets the pit grow.
Real pits show a wide spread. In 2025 Carlin in Nevada moved 15.75 tonnes of waste for each tonne of ore, while Buenavista in Mexico moved 0.71 (Barrick; Southern Copper). A Natural Resources Canada benchmarking study of nine Canadian open pits found ratios from 0.04 to 6.05 (NRCan, Benchmarking the Energy Consumption of Canadian Open-Pit Mines, 2005). The two companies measure slightly differently: Barrick divides pit waste by pit ore, while Southern Copper divides waste by ore plus leach material (low-grade rock stacked and leached with chemicals).
A planned pit shows how a low ratio looks on paper. The December 2025 feasibility study for the DeLamar gold and silver project in Idaho, prepared for Integra Resources, plans a life-of-mine strip ratio of 0.54 to 1, with 0.47 at Florida Mountain and 1.16 across the DeLamar-area pits, at a mining cost of US$2.55 per tonne mined (DeLamar feasibility study, effective 8 December 2025). Multiply US$2.55 by 1.54 and you get roughly the US$3.95 per tonne processed that the same study reports. It is a plan, not an operating result.
Chart
Strip ratio at eight working pits, 2025
Tonnes of waste per tonne of ore (Southern Copper pits: waste per tonne of ore plus leach material)
Open pit mining costs per tonne: pit versus underground
Barrick publishes mining cost per tonne mined for each Nevada operation, split between pit and underground. For the full year 2025, the pit figure ran from US$3.02 at Carlin to US$4.38 at Turquoise Ridge, while underground cost US$118.67 at Cortez, US$140.95 at Carlin and US$205.66 at Turquoise Ridge (Barrick Q4 2025 mine statistics). Turquoise Ridge’s pit is small, only 97 thousand tonnes of ore in 2025, so treat its figure as a minor operation.
Chart
Mining cost for each ore tonne, pit versus underground, 2025
US$ per ore tonne. Pit = cost per tonne moved x (1 + strip ratio), derived from Barrick’s figures. NGM = Nevada Gold Mines, UG = underground.
The comparison is unfair to the pit in one way. A pit tonne is mostly waste, while an underground tonne is mostly ore. Multiplying each pit cost by one plus the strip ratio gives the cost of mining one ore tonne (derived from Barrick’s own cost per tonne mined and strip ratios). The result is US$8.4 at Phoenix, US$14.1 at Pueblo Viejo, US$21.2 across Nevada Gold Mines, US$24.2 at Cortez and US$50.6 at Carlin. Underground ore at Nevada Gold Mines cost US$142.50 a tonne. The pit still wins on mining cost, by nearly a factor of three even at Carlin, but the gap is far smaller than the headline numbers suggest.
Three limits apply. These are mining costs only, with no processing, haulage to the mill or capital. Barrick’s cost per tonne mined is a supplementary measure taken before capitalisation of waste stripping, so pit costs here can understate the full cost of removing waste. Grades differ by operation, and an underground mine may reach ounces a pit cannot. And Barrick’s figures are for one company’s Nevada and Dominican Republic sites, so they are an example, not an industry benchmark. Use the calculator to test your own numbers.
Calculator
What does one ore tonne cost to mine in a pit?
Enter your own cost per tonne moved, strip ratio and underground cost.
- Pit mining cost per year (US$): $12,000,000
- Underground mining cost per year (US$, same tonnes): $120,000,000
- Waste moved per year: 3,000,000 tonnes
- Strip ratio at which the two costs match: 39.0 t/t
Example values only, not a forecast or any company’s figures. The defaults are round numbers close to Barrick’s 2025 Nevada pit costs per tonne moved (US$3.02 to US$4.38) and underground costs per tonne (US$118.67 to US$205.66). Costs are inputs: example, use your own quotes or study figures. Mining cost only; processing, haulage, capital, royalties and grade differences are not included. Underground cost is per tonne mined, treated here as one ore tonne because underground tonnes are mostly ore.
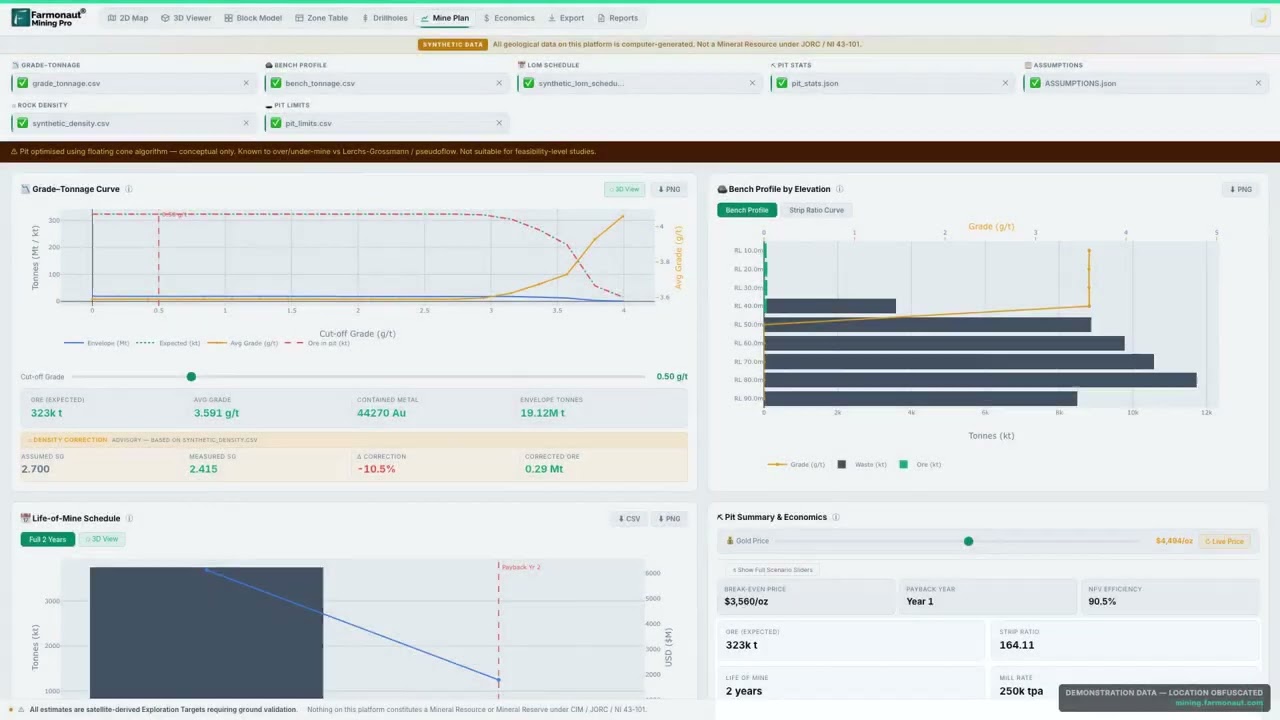
▶ A course chapter on building a cost picture for a conceptual open pit, including all-in sustaining cost, break-even price and the wall angle and bench height behind the numbers. · 14:58
Advantages of open pit mining
Low cost per tonne and high productivity
Large trucks and shovels move rock cheaply. The IntechOpen chapter puts pit productivity at three to five times that of underground methods and lists around 100 to 400 tons per employee-shift, ore and waste together. The US coal data point the same way: in 2021, a coal worker in the West, where most output comes from big surface mines, produced 16 tons an hour against 4 tons in the East (EIA, Today in Energy, November 2022). EIA says about two-thirds of US coal comes from surface mines because surface mining costs less.
Fast start and flexible output
Because the ore is exposed from above, a pit can reach production sooner than a shaft or decline. Pits can also vary output when demand shifts, and they can grow in stages. The IntechOpen table lists early start-up, flexibility and simple access among the advantages.
Scale for bulk and low-grade deposits
Some ores only pay when mined in huge volumes. Southern Copper’s Buenavista unit mined 72.9 million tonnes of ore and 119.6 million tonnes of leach material in 2025, from a total of 339.8 million tonnes moved (Form 10-K). That scale suits a pit with big trucks; it would be hard to match underground at similar grades.
Good recovery and working conditions
The textbook list names good ore recovery and good health and safety with no underground hazards. Pits carry their own hazards, covered below, but they are different ones.
Easier to see, measure and monitor
Everything is on the surface, so dust, water and slope movement can be monitored with radar, survey prisms and satellites. At Bingham Canyon, a surveillance network of automated geodetic networks, extensometers and ground-based radar picked up the slide before it happened (GSA Today).
Disadvantages of open pit mining
Strip ratios move, and costs follow
The ratio is not constant through a mine’s life. Barrick’s Pueblo Viejo pit rose from 0.85 in 2024 to 3.10 in 2025, while Cortez fell from 11.03 to 6.31 and Carlin from 19.17 to 15.75. Agnico Eagle’s February 2026 outlook expects higher deferred stripping costs at Detour Lake because of a higher strip ratio phase in the mine plan (Agnico Eagle Q4 2025 results). A deeper pit generally needs more waste moved for each ore tonne, which squeezes margins when prices fall.
Chart
Strip ratios change year to year at the same pit
Tonnes of waste per tonne of ore, full years 2024 and 2025
Pit wall failures
The biggest engineering risk is a wall that slides. At Bingham Canyon in Utah, the north-east wall of a 970-metre pit collapsed in two events on 10 April 2013, about 90 seconds each and about 1.5 hours apart. Kennecott estimated the slide moved 165 million tons of rock, and the authors judged it likely the largest non-volcanic landslide in North America in modern times. It damaged 14 haul trucks and three shovels, closed the main ramp, and injured nobody because operators had seen it coming and evacuated the area (GSA Today, January 2014). The common failure types are plane, wedge, toppling and circular failure, and most follow existing cracks or joints in the rock (IntechOpen).
Water, pit lakes and long-term treatment
When pumping stops, a deep pit becomes a lake. In Butte, Montana, the US EPA and the state require the Berkeley Pit water to be kept below 5,410 feet above sea level, called the Protective Water Level, by pumping and treating it; that level is 50 feet below the point at which groundwater would start to flow out of the pit (PitWatch). The operators, Montana Resources and Atlantic Richfield, are required to keep the water below that level, and pumping and treatment have kept the water level relatively unchanged since late 2019. Few pits face that scale of liability, but any pit below the water table has pumping costs while it runs and a closure plan to pay for.
Land disturbance and mine waste
A pit and its waste dumps cover large areas. The EPA’s Toxics Release Inventory shows that metal mining, which includes both open pit and underground operations, accounted for 66% of all on-site land disposal reported by US facilities in 2023, with lead (43%), zinc (31%) and arsenic (8%) the main chemicals, and that waste rock piles at metal mines are counted in that category (US EPA, TRI National Analysis, land disposal). The figure covers the whole sector, so it describes metal mining in general rather than pits alone. Dust, noise and visual impact come on top, and they are felt most where houses sit close to the rim.
Heavy diesel and power use
A haul fleet burns a lot of fuel. In the Natural Resources Canada study, nine open pits spent C$228 million on energy in 2000, and diesel (235 million litres) and electricity together made up more than 75% of the energy used. Those are 2000 figures, published in 2005, from a Canadian gold, iron ore and oil sands sample, so use them for the pattern, not for current prices.
Depth and the switch to underground
Once the strip ratio climbs past what the ore can pay, the pit stops and any ore left below stays in place or goes underground. That is why several large pits are now adding shafts and declines, covered in the next section.

▶ A short claymation explaining seven environmental impacts of mining in plain words. · 2:31
Open pit versus underground mining: how to choose
Choose by comparing the whole project value of each method, not the headline cost per tonne. Use this order of questions:
- How deep is the ore, and how steep is the dip? Shallow and wide points to a pit; deep and narrow points underground.
- What is the break-even strip ratio at today’s price and your own cost of moving waste? If the next slice of waste costs more than the ore under it earns, the pit ends there.
- Is the rock strong enough for steep walls? Weak rock forces flat slopes, which means much more waste.
- Does the surface allow it? Towns, rivers, protected areas and the cost of a reclamation bond can rule a pit out.
- What is the grade? High-grade veins can carry an underground cost of over US$100 a tonne; low-grade bulk ore cannot.
| Question | Open pit | Underground |
|---|---|---|
| Typical deposit | Shallow, wide or massive; coal seams under about 200 feet | Deep, narrow, steep or high grade; coal below about 200 feet |
| Mining cost per tonne moved (Barrick Nevada, 2025) | US$3.02 at Carlin and US$3.31 at Cortez | US$140.95 at Carlin and US$118.67 at Cortez |
| Waste | High; strip ratio is the key number | Low, mostly development rock |
| Surface footprint | Large pit and dumps | Smaller, but shafts, ramps and tailings remain |
Mines that switch or combine methods
Hybrid mines are now common. Agnico Eagle’s February 2026 results describe Meadowbank in Nunavut moving from primarily open pit to primarily underground, Canadian Malartic in Quebec advancing its transition to underground production at Odyssey, and a Detour Lake plan that runs the open pit alongside a proposed underground mine of 11,200 tonnes a day (Agnico Eagle, Q4 2025 results). The pit pays for the early years and the infrastructure; the underground mine takes ore that the strip ratio makes uneconomic from above.
Open pit design basics: benches, ramps and slopes
A pit diagram shows the same few parts in every mine, and the numbers behind them come from the rock. This is the layout that map and cross-section drawings show:
- Benches: the horizontal steps cut into the pit wall. Bench height ranges from about 15 metres in large copper mines to as little as 1 metre in small uranium mines, and is set by the size of the shovel and by safety (IntechOpen).
- Bench face angle and inter-ramp angle: the first is the steepness of one bench face; the second is the average angle of the wall between ramps, which is flatter because catch benches are included. A flatter wall is more stable but needs more stripping, which is the slope trade-off the IntechOpen chapter describes.
- Haul roads and ramps: wide roads that spiral up the wall and take trucks out of the pit.
- Sumps and drainage: low points and channels that collect rain and groundwater to be pumped out.
- Waste dumps and stockpiles: areas outside the pit for waste rock and low-grade ore. Coal operations also store topsoil there for reclamation (US DOE coal profile).
The DeLamar feasibility study gives a real set of numbers. Its geotechnical consultant recommends inter-ramp angles of 27 to 49 degrees in the DeLamar area and 30 to 55 degrees at Florida Mountain, depending on rock type, with 12-metre benches in the main DeLamar pits and 16-metre benches at Florida Mountain (DeLamar feasibility study, section 15). Stronger rock allows steeper walls and a lower strip ratio, which is why a geotechnical survey comes early in a pit study.
Once the benches and slopes are chosen, pit optimization software tests nested pit shells against costs and prices, and the design follows the shell that gives the best value; the DeLamar study used this route to set its ultimate pit limits. Farmonaut’s Mining Pro course shows this on de-identified demonstration data; those results are exploration targets, not a resource estimate.
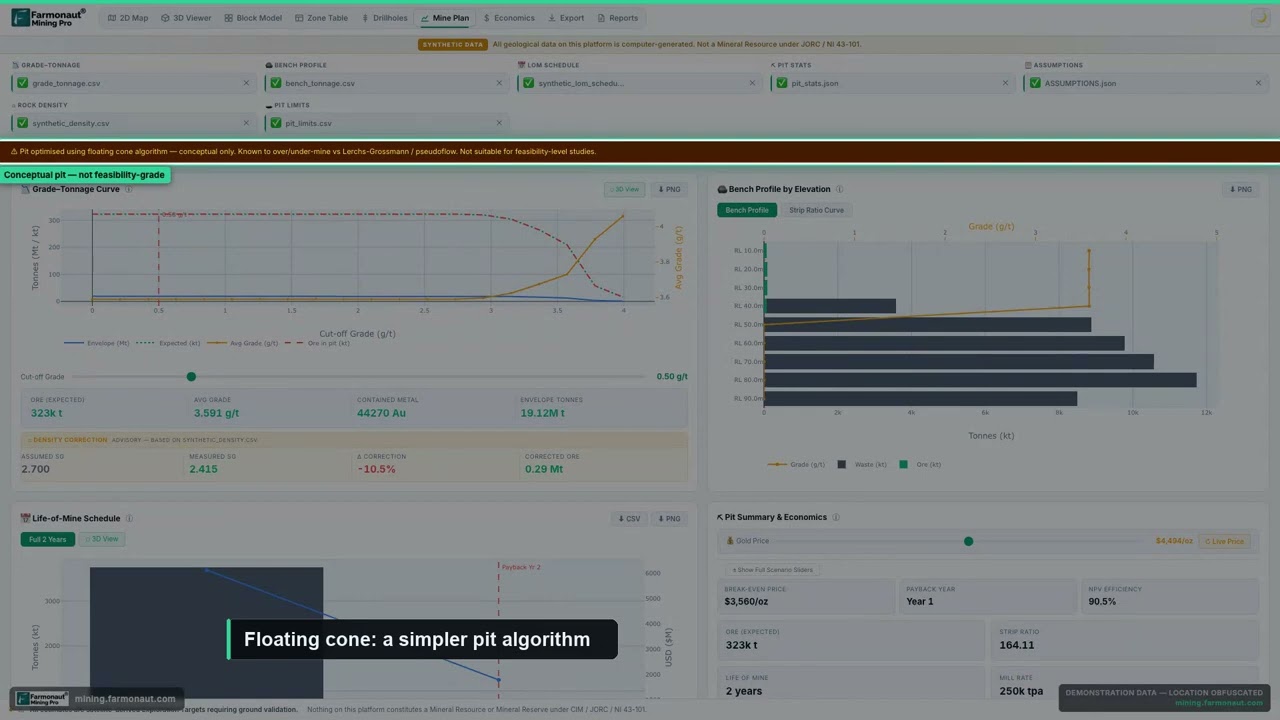
▶ Floating cone pit optimization explained, run on a de-identified demonstration survey (an exploration target, not a resource estimate). · 5:12
Strip mining and open pit mining: what is the difference?
People search for strip mining diagrams next to open pit diagrams, so here is the split. Open pit mining digs a deepening hole to reach a buried body of ore, typically a metal deposit. Strip mining is a surface method for shallow, layered deposits such as coal, in which overburden is removed in parallel cuts. The US Office of Surface Mining Reclamation and Enforcement (OSMRE) names strip, auger, mountaintop removal, box cut, open pit and area mining in its definition of surface coal mining operations, and defines contour mining as removing coal in a narrow strip around a hillside (OSMRE glossary). On flat ground, the usual sequence is described in the DOE profile: clear the land, remove and store topsoil, drill and blast the overburden, then use draglines or shovels to expose the coal (US DOE coal profile).
The reclamation language is the clearest difference in the US. For coal, OSMRE defines approximate original contour as a surface reached by backfilling and grading so that the land closely resembles its shape before mining, with all highwalls, spoil piles and coal refuse piles eliminated (OSMRE glossary). Metal pits are harder to refill: broken rock takes up 10% to 30% more space than solid rock (GSA Today), and the ore has left the site, so closure plans for pits focus on stable walls, water and land use. For a longer walk-through of the coal side, see our guide to the coal mining process diagram and copper smelting diagram.
From pit to product: what happens to copper ore
A pit is only the first step. Southern Copper’s La Caridad complex in Mexico, for example, combines two open pit mines with a concentrator, a smelter, a copper refinery, a precious metals refinery, a rod plant and a solvent extraction and electrowinning (SX-EW) plant (Southern Copper Form 10-K for 2025). The concentrator crushes and grinds the ore and separates the copper minerals; the smelter and refinery then produce cathode. Lower-grade leach material skips the concentrator and goes to SX-EW, which dissolves copper with acid and plates it out. Toquepala in Peru has an SX-EW plant with a capacity of 56,336 tonnes a year of LME grade A copper cathodes. Our pages on copper smelting steps and on copper processing walk through those stages.
Screening a site before designing a pit
A pit decision starts with whether there is ore at all. Farmonaut analyses satellite data for a licence boundary you supply and returns mineral targets and alteration zones, so a consultant can decide where to drill first; it does not replace drilling, a resource estimate or a pit design. Read more on the satellite-based mineral detection page, or send a site through the mining query form. You can also contact us with questions.
We cover a connected topic in Open Cast Gold Mining: 7 Steps With Real Costs.
For a closer look at a related question, see our guide: Rare Earth Mine Timeline: Real Projects, Years and Costs.
Frequently asked questions
What are the main advantages of open pit mining?
Low cost per tonne moved, high productivity, early start-up, flexibility and good ore recovery. At Barrick’s Nevada pits in 2025, a tonne mined cost US$3.02 to US$4.38, against US$119 to US$206 underground (Barrick). Big equipment and few workers per tonne explain most of the gap.
What are the main disadvantages of open pit mining?
A large land footprint, a lot of waste rock, pit wall failures, water management and high fuel use. Costs also swing with the strip ratio, which at Pueblo Viejo went from 0.85 to 3.10 in a year.
What conditions suit an open pit mine?
Shallow or massive ore, a strip ratio the ore can pay for, strong rock for steep walls, manageable groundwater, and land that can be used and reclaimed. For coal, EIA says seams under about 200 feet are often surface mined.
What is a strip ratio and what is a good one?
It is tonnes of waste per tonne of ore. There is no universal good value: Buenavista ran at 0.71 and Carlin at 15.75 in 2025, and both operated. A ratio is good if the ore pays for the stripping at your cost and price; the break-even form is (value of ore minus production cost) divided by stripping cost.
How much cheaper is open pit mining than underground mining?
Per tonne moved, Barrick’s Nevada pits cost US$3 to US$4.4 in 2025 against US$119 to US$206 underground. For each ore tonne, once waste is counted, the pits across Nevada Gold Mines cost about US$21 against US$142.50 underground, about one seventh (derived: 21.2 / 142.5). Your site’s answer depends on strip ratio and grade.
How deep can an open pit mine go?
There is no fixed limit. A textbook figure is around 500 metres, but Bingham Canyon was 970 metres deep when its wall failed in 2013. Depth stops where slope stability, haulage distance and the strip ratio make the next bench uneconomic.
What is the difference between strip mining and open pit mining?
Strip mining removes overburden in parallel cuts from shallow layered deposits, mostly coal. Open pit mining digs a deepening pit into a buried ore body, mostly metals. Both are surface methods, and the terms overlap in everyday use.
Which minerals are mined in open pits?
Iron ore, copper, gold, coal, bauxite, phosphate and many industrial minerals. The IntechOpen chapter names aluminium, bauxite, copper and iron as common metallic examples, and USGS says eight open pit mines shipped 98% of US usable iron ore in 2025.
Is open pit mining safer than underground mining?
Textbooks list good health and safety and no underground hazards as an advantage, but pits carry their own main risks, wall failure and moving equipment. Injury rates differ by country and commodity, so check the national mine safety regulator’s published data for your own case.
What happens to a pit when the mine closes?
The operator must plan and pay for closure. Options include backfilling, letting the pit flood, or reshaping slopes, and the mining company is responsible for the costs (IntechOpen). Where water quality is a risk, as at the Berkeley Pit, pumping and treatment can continue for decades.
Can a mine switch from open pit to underground?
Yes. Agnico Eagle’s Meadowbank, Canadian Malartic and Detour Lake sites are all moving toward or planning underground mining alongside or after the pit, according to the company’s February 2026 results.
How is the final size of a pit decided?
Engineers compare the value of each extra slice of ore with the cost of the waste above it, using forecast prices and costs, then apply slope angles from geotechnical work. Pit optimization software repeats this for thousands of shells, and the plan is checked against permits, land access and reclamation cost.
This page is for information only. It is not investment, legal or engineering advice. Costs and strip ratios come from the sources named, mostly from one company’s sites, so check each figure against its source before you rely on it.
Farmonaut mining
Map your mining site before you plan a pit
Consultants can screen a licence area with satellite data to find exploration targets ahead of drilling and a resource estimate.

Mining Pro sample view, synthetic data
Keep reading
Sources
- Barrick, Q4 2025 Mine Statistics (full years 2024 and 2025): s25.q4cdn.com
- Southern Copper, Form 10-K for 2025: southerncoppercorp.com
- Integra Resources, DeLamar Project Feasibility Study (effective 8 December 2025): minedocs.com
- Agnico Eagle, Q4 and full-year 2025 results (February 2026): s205.q4cdn.com
- GSA Today, Massive landslide at Utah copper mine generates wealth of geophysical data (January 2014): geosociety.org
- Altiti, Alrawashdeh and Alnawafleh, Open Pit Mining, IntechOpen (2021): intechopen.com
- US EIA, Coal explained: Mining and transportation: eia.gov
- US EIA, Today in Energy: Most U.S. coal is mined in the West (8 November 2022): eia.gov
- USGS, Mineral Commodity Summaries 2026: Iron Ore: pubs.usgs.gov
- US EPA, TRI National Analysis: Land disposal (2023 data): epa.gov
- PitWatch, Protective Water Level, Berkeley Pit: pitwatch.org
- Natural Resources Canada, Benchmarking the Energy Consumption of Canadian Open-Pit Mines (2005): natural-resources.canada.ca
- OSMRE, Glossary: osmre.gov
- US DOE, Energy and Environmental Profile of the US Mining Industry: Coal: www1.eere.energy.gov
Discussion
Questions, corrections or field experience? Share them below. First-time comments are reviewed before they appear, and your email is never published.
No comments yet. Be the first to add a question or your experience.

 Dalgety Minerals Pty Ltd
 Vortex Minerals Pty Ltd
 Faith At Work (Pty) Ltd
 Geotech Mining Solutions plc
 Vulcan International Limited
 Kidepo Associates
 GKY Mining
 Alkimy SARL
 Double A Trading
 GemSprout Metals Limited
 Qader Group
 Ileys General Trading
 SG Gold Mining LLC
 VRV Global Pte Ltd
 Omsri International FZE
 G.I.T.T.
 Jaunita Erss Ltd
 Almosi SARL
 SRK Consulting
 Berks Gold Limited
 Mwerezi Minerals Company Limited
 Mining SARL
 SenGold Invest SAS

 Exploration consultancy · South Africa · Gold










