

Client case study · Gold · Ghana
How Satellite Screening Ranked Four Gold Concessions in Ghana Before the First Drill Hole
Gold concession screening in Ghana took four licences of very different sizes, about 141 km² in all, and ranked them from space in a single programme. About 10% of the ground was flagged as gold target ground, one concession came out holding about 78% of the modelled gold, and the client reported saving more than 6 months and more than US$100,000 before any drilling.
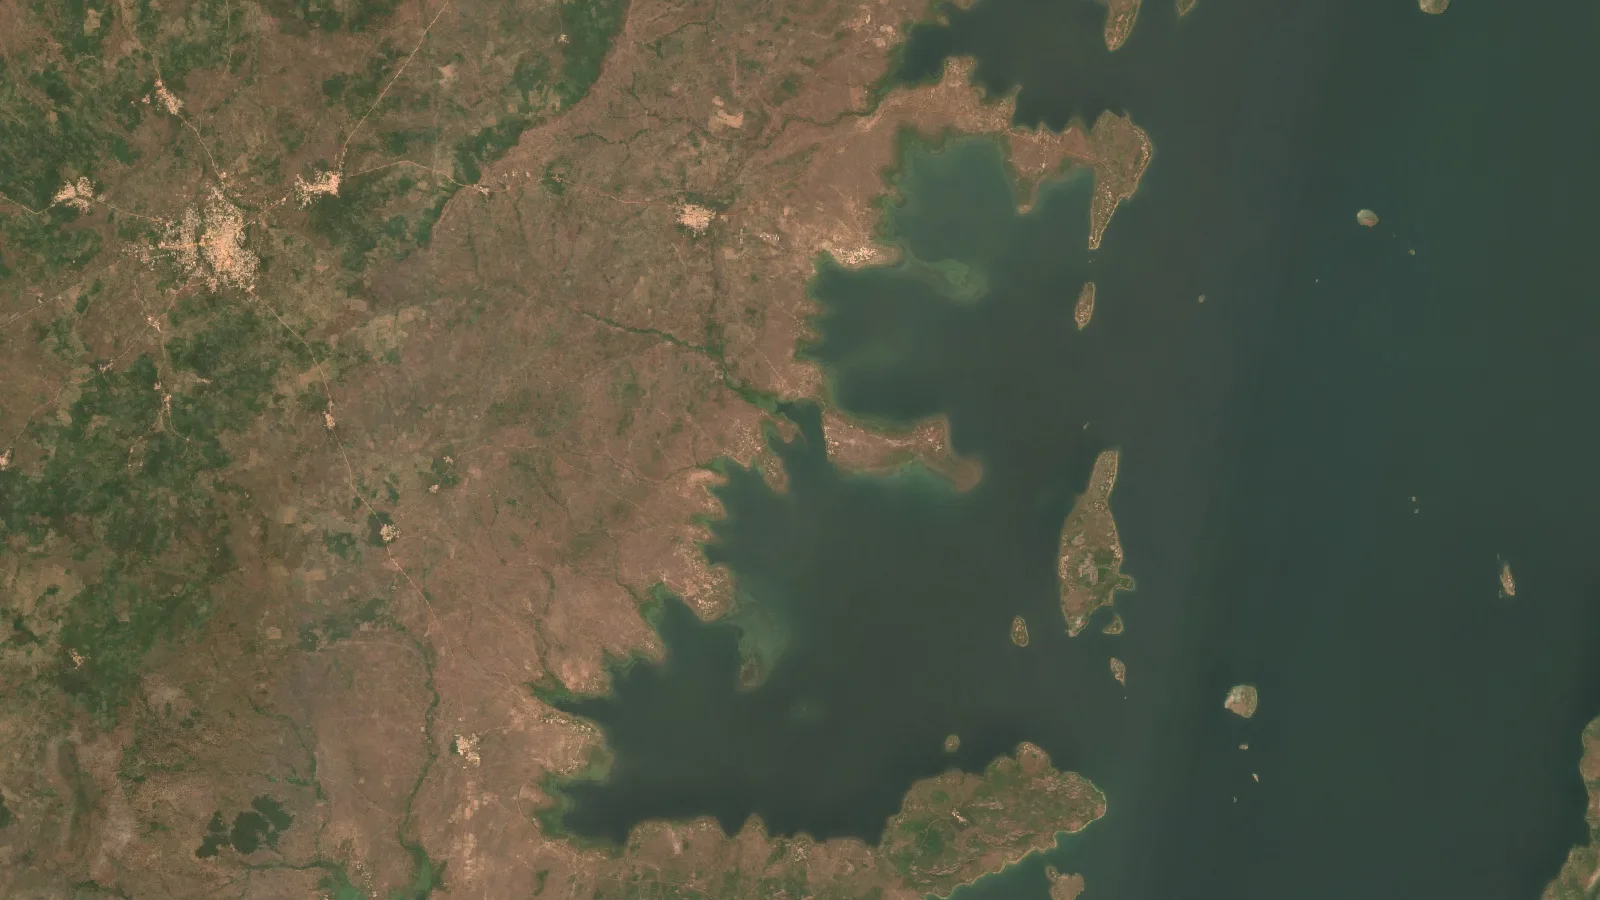
Key takeaways
- Four gold concessions in Ghana, from about 95 ha to about 105 km² and about 141 km² in all, were screened from space with one method so they could be ranked against each other.
- The reports outlined 654 anomaly zones on about 1,410 ha, roughly 10% of the ground, with a steady 8% to 10% in each licence.
- The largest licence holds about 78% of the portfolio’s modelled gold and the highest grade band, about 1.34 to 2.30 g/t.
- In every licence a few zones carry most of the gold, from about 65% in the top two zones to about 98% in the top six, which sets a clear drill order.
- Before any drilling, the client reported saving more than 6 months and more than US$100,000, the top bands on our form. These are the client’s own estimates.
In this article
- Four gold concessions in Ghana and one budget
- Why gold concession screening in Ghana starts from space
- How the four licences were screened
- What the screening found across about 141 km²
- Inside each licence: a few zones carry most of the gold
- Depth, access and the shape of a first drill programme
- From four reports to one drill order
- What the client reported, and what came next
- Lessons for explorers holding several licences
- Gold concession screening: frequently asked questions
Four gold concessions in Ghana and one budget
This case study follows an operator holding four gold concessions in Ghana. The licences could hardly be more different in size. The smallest covers about 95 hectares, under one square kilometre. The largest covers about 105 square kilometres, more than a hundred times bigger. The other two sit in between, at about 7.35 and 27.65 square kilometres. Together they make up about 141 square kilometres, or about 14,100 hectares, of exploration ground.
Holding several licences at once is common in Ghana’s gold sector. It spreads risk across different pieces of ground, but it also creates a hard question: with one exploration budget and one team, which licence should get the money first, and where inside that licence should the first holes go? Walking and sampling 141 square kilometres of tropical ground by hand would take many months before a single drill target could be chosen with confidence.
The operator chose to screen all four licences from space first. It commissioned a Farmonaut Premium Plus satellite report for gold on each concession, delivered in April 2026. Each report covered the whole licence, mapped every gold anomaly inside it, estimated depth, footprint and grade band for each one, and suggested a drilling direction. Put side by side, the four reports turned a scattered landholding into a ranked portfolio.
Why gold concession screening in Ghana starts from space
Ghana is Africa’s largest gold producer, and most of that gold comes from the Birimian greenstone terrain of West Africa: ancient volcanic and sedimentary rocks cut by long shear zones. Gold in this setting is usually orogenic. It was carried by hot fluids along faults and fractures and dropped where the fluids cooled or reacted with the rock around them. The US Geological Survey’s minerals yearbook for Ghana and the country’s Minerals Commission both describe a sector built on this geology.
That geology leaves clues that satellites can read, even under a tropical landscape:
- Iron oxides and gossans: rust-coloured iron minerals form a gossan, a weathered oxide cap over sulphide-bearing rock. Band ratios in optical imagery highlight this ferric iron.
- Hydroxyl and silica alteration: the fluids that carry gold turn feldspar into clay and mica and add silica. These minerals change how the ground reflects shortwave-infrared light.
- Structure: shear zones and faults show up as straight lines and breaks in the terrain and in radar images. In the Birimian, gold follows these structures closely.
- Landform: the direction and steepness of slopes along a structure tell the analysis how continuous it is, which is a guide to how continuous a vein system may be.
Plant cover is the main challenge in much of Ghana, so the analysis leans on the signals that come through it: iron oxides in exposed soils and laterite, structure in the terrain model and radar, and the patterns that repeat across many images. The result is not a picture of gold. It is a map of where the conditions that host gold come together most strongly.

▶ How satellite technology is being used to look for gold in Ghana. · 15:36
How the four licences were screened
The client’s part was quick. The operator sent the boundary of each concession and named gold as the target mineral. Nobody had to visit the ground for this stage, and nothing was disturbed. The same method was applied to all four licences, which is what made them comparable.
Infographic
How four licences became one drill order
- 1Send the boundariesThe operator sent the outline of each of the four concessions and named gold.
- 2Screen each licenceMultispectral, radar and terrain data were combined into a Gold Potential Index.
- 3Map the anomaliesEvery anomaly zone got a footprint, depth envelope, grade band and access rating.
- 4Group and rankLarge anomaly sets were grouped into target zones and ranked by modelled gold.
- 5Compare the licencesThe four reports were set side by side to choose where drilling starts.
Each report combined several independent kinds of data:
- Multispectral imagery: composites from Sentinel-2 and Landsat 9, used for band-ratio maps of iron oxide, hydroxyl and silica alteration.
- Radar-derived lineaments: processed radar amplitude images, such as those from Sentinel-1, pick out faults and fractures through cloud.
- Terrain: a 30-metre elevation model, of the kind in the Copernicus elevation collection, supplies slope, aspect and shaded relief for structural mapping and access.
Three indicators came out of those layers: spectral alteration intensity, the density of structural lines, and how consistently slopes line up along those lines. They were combined into a single Gold Potential Index between 0 and 1. Ground that scored highly on several indicators at once was outlined as an anomaly zone.
For each anomaly zone, the report then estimated a footprint, a depth envelope, a grade band, a strike direction, a strip ratio and an access rating. It also suggested a drilling direction across the trend of the zone, at an incline of about 70 degrees, because a hole drilled across a structure tests it far better than one drilled along it.
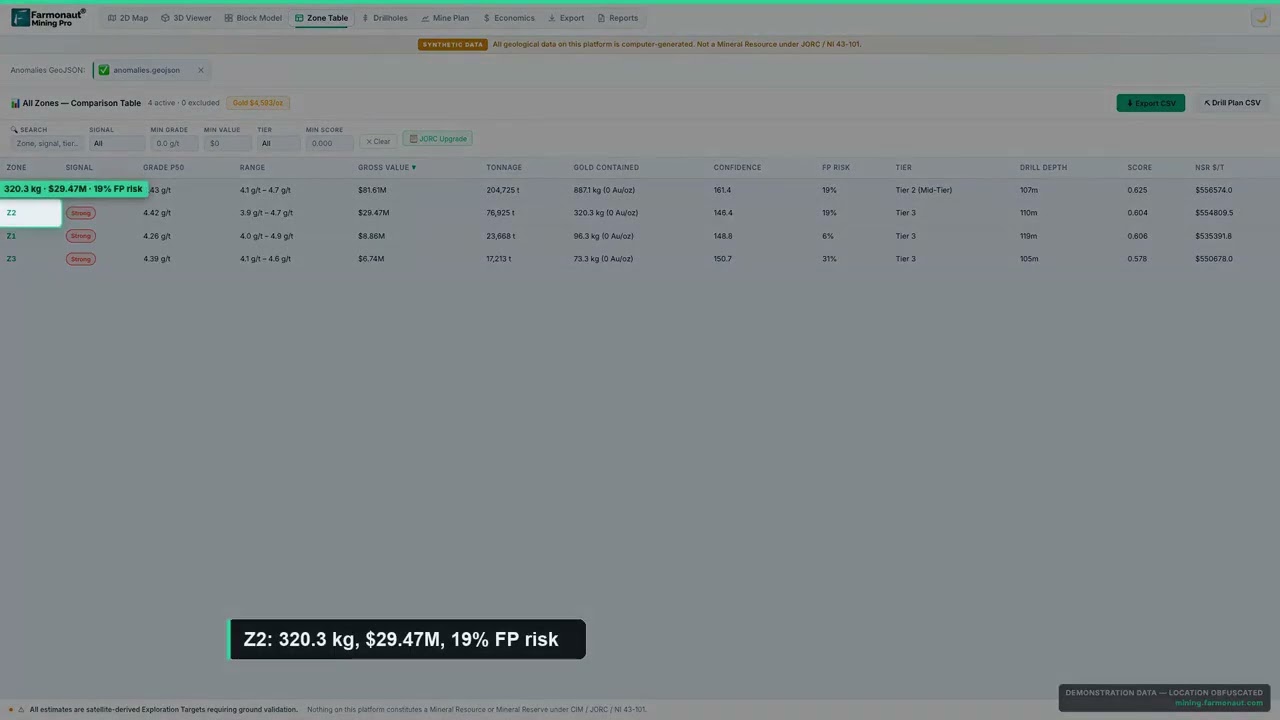
▶ How satellite gold detection scores are built, and how to read their confidence. · 4:36
On the largest licence, the report took one more step. It found so many individual anomalies that it grouped neighbouring ones into a handful of target zones, each small enough to be explored as a single programme. That step is what turns a map of hundreds of points into a plan a field team can follow.
What the screening found across about 141 km²
Across all four concessions, the reports outlined 654 anomaly zones covering about 1,410 hectares. That is about 10% of the 14,100 hectares screened. In practice, nine-tenths of the portfolio could move down the list for now, and the first mapping, sampling and drilling could focus on about one hectare in every ten.
Chart
About 10% of the portfolio flagged as target ground
Hectares, all four concessions combined
The proportion was strikingly steady from one licence to the next, at between about 8% and 10% of each concession. The difference between the licences was not how much target ground each one had. It was how good that ground looked and how much of the modelled gold it held.
| Concession | Ground screened | Anomaly zones | Target ground | Grade band | Top of targets | Share of portfolio’s modelled gold |
|---|---|---|---|---|---|---|
| Concession A | ~95 ha | 9 | ~8 ha (8.4%) | 0.98–1.42 g/t | 33–37 m | 0.2% |
| Concession B | ~735 ha | 19 | ~72 ha (9.8%) | 1.01–1.64 g/t | 31–36 m | 4.7% |
| Concession C | ~2,765 ha | 88 | ~266 ha (9.6%) | 0.99–1.68 g/t | 31–38 m | 17.1% |
| Concession D | ~10,500 ha | 538, in 10 target zones | ~1,066 ha (10.1%) | 1.34–2.30 g/t | 27–40 m | 78.0% |
| All four | ~14,100 ha | 654 | ~1,410 ha (10.0%) | 0.98–2.30 g/t | 27–40 m | 100% |
Source: Farmonaut satellite gold detection reports for the four concessions, April 2026. Grade bands run from the lowest to the highest zone estimate in each licence. Shares are of the reports’ combined modelled gold and are rounded.
The ranking that matters most is in the last column. Concession D, the largest licence, holds about 78% of the modelled gold across the portfolio. Concession C holds about 17%. Concessions B and A together hold about 5%. That is not only a matter of size: Concession D also carries the highest grade band of the four, at about 1.34 to 2.30 grams of gold per tonne of rock, against about 1.0 to 1.7 g/t on the other three.
Chart
One licence holds about 78% of the modelled gold
Share of the four reports’ combined modelled gold, %
Grams per tonne, written g/t, is the estimated gold in each tonne of rock. Grades in the range of about 1 to 2 g/t are typical of the large, near-surface orogenic deposits that much of West African gold mining is built on, so the bands in these reports point at the kind of target the region is known for.
Chart
Grade bands by concession
Lowest to highest zone grade estimate, g/t
Inside each licence: a few zones carry most of the gold
Ranking the licences is the first half of portfolio screening. The second half is ranking the ground inside each licence, and here the reports gave the same message four times: in every concession, a small number of zones carry most of the modelled gold.
- Concession A, about 95 ha: nine zones, and the top two hold about 65% of the licence’s modelled gold.
- Concession B, about 735 ha: nineteen zones, and six of them hold about 98% of it.
- Concession C, about 2,765 ha: eighty-eight zones, and the top two alone hold about 83%.
- Concession D, about 10,500 ha: 538 anomalies grouped into ten target zones, and the top three hold about 70%.
Chart
A few zones carry most of each licence’s gold
Share of each licence’s modelled gold held by its leading zones, %
That pattern is typical of orogenic gold. A few large mineralised centres hold most of the metal, with many smaller zones around them along the same structures. It is also the pattern that makes satellite screening pay off. When two or three zones carry most of a licence’s potential, the first drill holes can go there, and the smaller zones can wait for the results.
On Concession D, grouping the anomalies into target zones did a lot of work. A field team cannot sensibly plan around 538 separate outlines. It can plan around ten target zones, each of which can be mapped, sampled and drilled as one programme. The report ranked those ten by modelled gold, and the top three became the natural first phase.
Depth, access and the shape of a first drill programme
A ranked target is only useful if a drill rig can reach it. The reports answered that for every zone, and the answers were encouraging across the whole portfolio.
The targets start shallow. The reports estimate the tops of the zones at about 27 to 40 metres below surface across all four licences, with the deepest roots estimated at about 100 to 200 metres. That is within easy reach of reverse-circulation and diamond-core drilling. On the largest licence, the report notes that no suggested hole needs to go deeper than 300 metres.
Chart
Estimated depth to the top of the targets
Metres below surface, shallowest to deepest zone top in each licence
Access was rated well too. On Concessions A and D, the reports rate terrain access as high throughout, and on Concession D mean slopes sit below about 6 degrees. On Concession B, 17 of the 19 zones have high access, and on Concession C, 64 of the 88 do. Gentle, open ground keeps the cost of tracks and drill pads down and lets a rig move quickly from one target to the next.
The reports also estimate strip ratios, the tonnes of waste rock that a surface mine would move for each tonne of target rock. On the largest licence, all ten target zones come in below 1.0, which is low. It is far too early to plan a mine, but it shows the targets are shallow relative to their size.
For the smallest licence, the report spelled out a full drilling plan: 31 reverse-circulation holes and about 3,450 metres in all, with a first phase of about 16 holes and about 2,080 metres on the leading zones. For Concession C, it suggested starting with about 4 to 6 holes on each of the two leading zones. Those figures give the operator a scale for the first programme before a contractor is asked for a price.
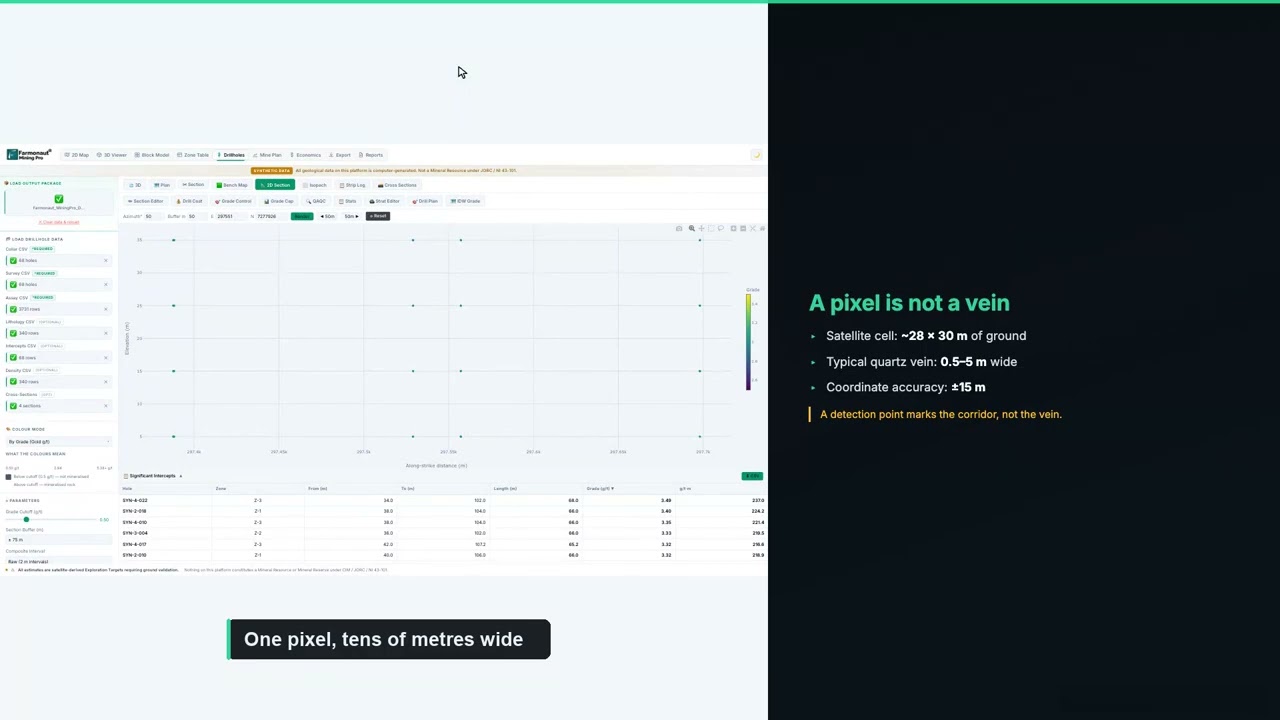
▶ How to plan a drilling programme once you have ranked targets. · 5:49
If you are budgeting a first programme of your own, enter your contractor’s rates below. The default values are round examples, not typical prices, because drilling costs vary widely with location, rock type and rig availability.
Calculator
What would a first drill programme cost?
Enter your contractor’s quote. All amounts are in US dollars.
- Total metres: 2,080
- Cost per hole (US$): $26,625
- Single-rig days (excluding moves): 69.3
Example values only, not related to this project. Drilling costs vary widely with location, rock type, hole type and rig availability, so use real quotes from your contractor and laboratory.
From four reports to one drill order
Put together, the four reports give a simple order of work for the whole portfolio. This is how a portfolio screen is normally used:
- Lead with the strongest licence: Concession D holds about 78% of the modelled gold and the highest grade band, so its top three target zones are the natural place for the first drill campaign.
- Run a second track on Concession C: its two leading zones hold about 83% of that licence’s modelled gold, so a small number of holes there can test most of its potential.
- Keep the smaller licences moving cheaply: on Concessions A and B, mapping and rock-chip sampling of the leading zones can confirm targets at low cost while the drill rigs work elsewhere.
- Let results move the order: as assays come back, money can shift to whichever licence is performing best.
Without a screen, the usual path would be to map and sample each licence in turn, starting wherever access was easiest or the paperwork came through first. On 141 square kilometres, that could take seasons. With a screen, every licence was ranked against every other before any field spending, and the field team could start on the ground most likely to matter.
If you want to compare targets of your own on paper, the calculator below turns tonnage and grade into contained gold and a gross value. Gross value is simply gold multiplied by price. It does not subtract mining, processing or any other cost, so it is a way to compare targets, not a forecast of profit.
Calculator
What is a gold target worth on paper?
Enter your own target. All amounts are in US dollars.
- Contained gold (kg): 10.0
- Contained gold (troy oz): 322
- Value after recovery (US$): $1,028,823
Example values only, not a benchmark, and not related to this project. 1 troy ounce is 31.1035 g. The gold price is an example, so check today’s price. Gross value is before mining and processing costs.
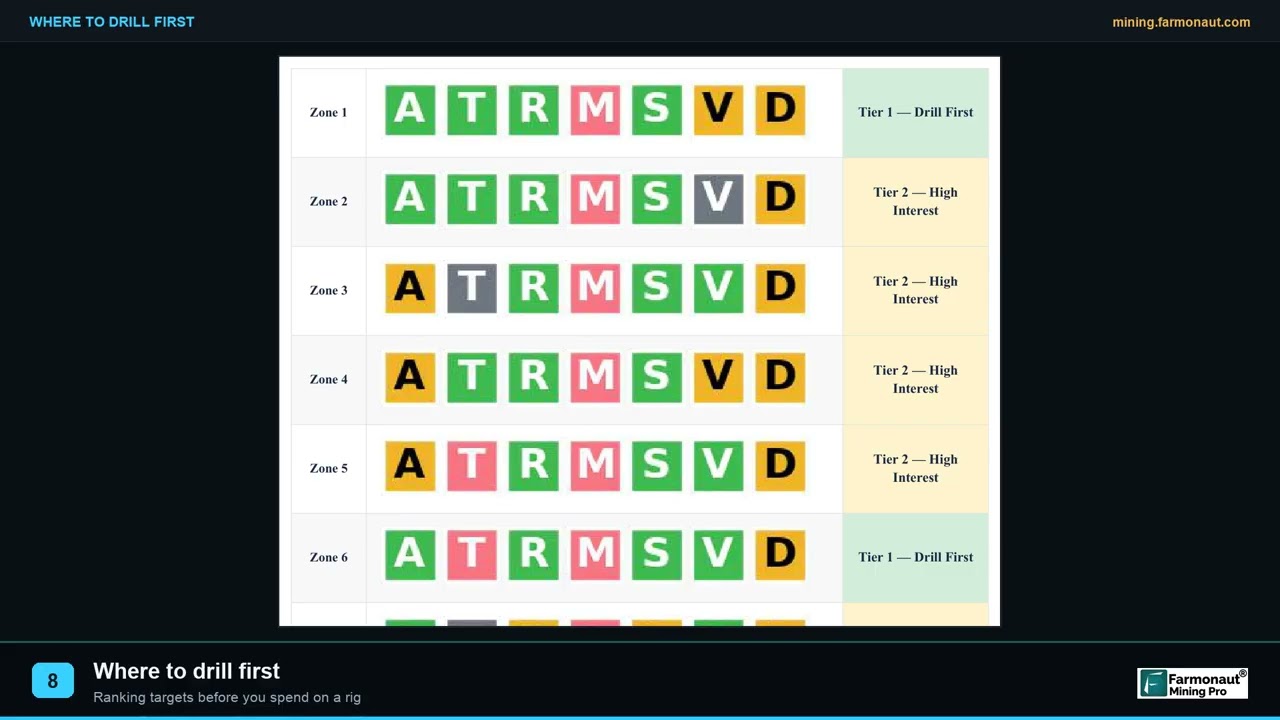
▶ How exploration targeting decides where the first holes go. · 2:19
What the client reported, and what came next
Several months after the reports were delivered, the client completed our structured post-project feedback form. These are the client’s own recorded answers to fixed questions on that form. They are reproduced without alteration and are not presented as a quotation.
- Locations narrowed: yes. The analysis helped narrow down where to explore or drill.
- Exploration time saved: yes, in the band of more than 6 months, the highest band on the form.
- Exploration cost saved: yes, in the band of more than US$100,000, the highest band on the form.
- Drilling so far: not yet drilled.
- Planned drilling: within the next 1 to 3 months.
Those answers show where the value of portfolio screening lands. Nothing had been drilled, and yet the client recorded savings in the top band for both time and money. On a landholding of about 141 square kilometres, the savings come from what no longer has to happen: seasons of walking, mapping and sampling ground that the screen moved down the list, and the risk of a first drill campaign on the wrong licence.
The client also came back to us. Since the first four reports, the operator has commissioned satellite screening of further ground. For us, that is the clearest sign that the approach fitted the way this operator runs its exploration: screen first, rank everything, then spend in the field.
Lessons for explorers holding several licences
Several parts of this project carry over to any operator with more than one piece of ground, in Ghana or anywhere else.
- Screen every licence with the same method: the comparison only works when each concession is measured the same way.
- Rank licences, then rank zones: decide which licence leads, then which zones inside it lead. Both rankings matter.
- Expect concentration: in this portfolio, one licence held about 78% of the modelled gold, and in every licence a few zones held most of it. Plan the budget around that.
- Group large anomaly sets: on big licences, grouping hundreds of anomalies into a handful of target zones turns a map into a programme.
- Check access early: shallow targets on gentle ground are cheap to test, so access ratings belong in the ranking.
- Field-check before the rig: mapping and rock-chip sampling of the leading zones confirm collar positions at low cost.
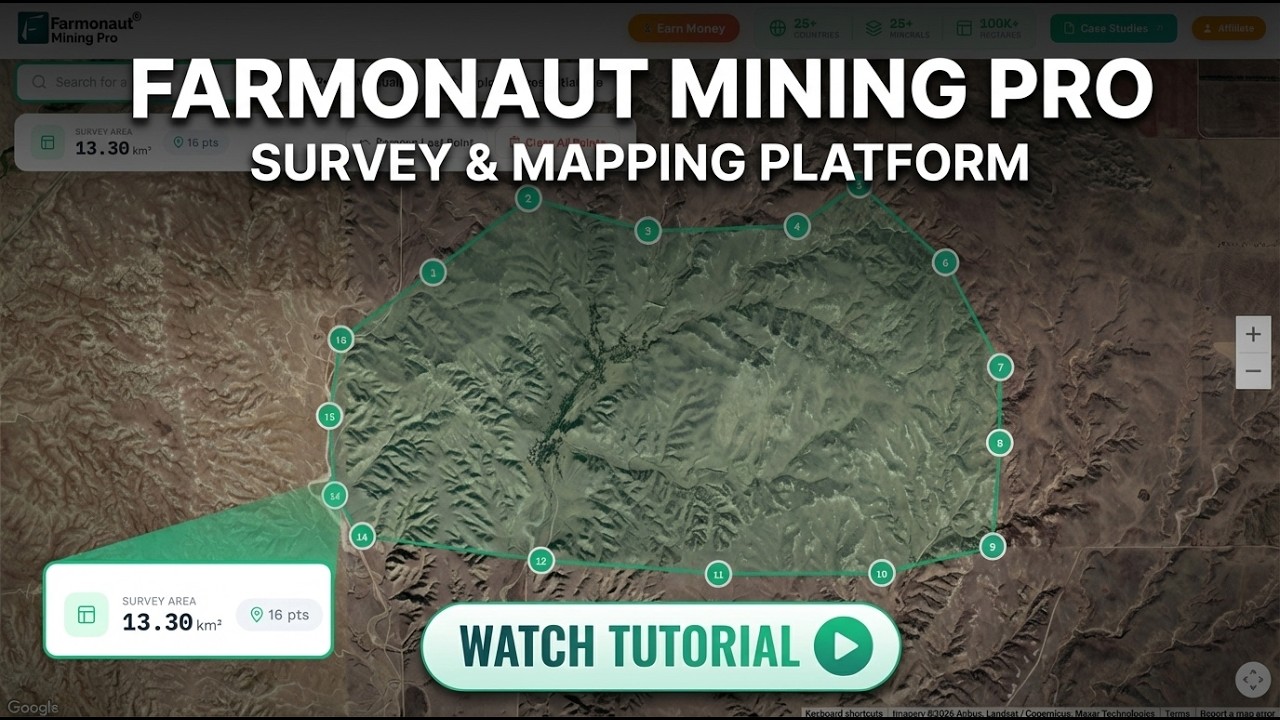
▶ How to map a mining concession and its targets in Farmonaut Mining Pro. · 6:03
Getting a similar screen for your own ground follows the same steps. Send each boundary as coordinates, a KML or KMZ file, or a polygon, and name your target mineral. Delivery usually takes 5 to 20 business days, depending on the size of the area and the mineral. You can map your mining site yourself or get a quote from our team.
Want to see the same approach on other ground? Read how a gold explorer in Somalia went from satellite targets to drilling in our Somalia gold case study, or see how a Ghana-based client and partner used satellite targeting in our Ghana gold case study.
Gold concession screening: frequently asked questions
What did gold concession screening in Ghana find for this operator?
Across four concessions totalling about 141 km², the reports outlined 654 anomaly zones on about 1,410 hectares, about 10% of the ground. The largest licence held about 78% of the portfolio’s modelled gold, and in every licence a few zones held most of that licence’s gold.
Why screen several licences at once?
Screening every licence with the same method lets you compare them directly. You can then put the first drill money on the licence and the zones most likely to deliver, instead of working through each licence in turn.
What grades do the reports estimate?
Zone grade estimates run from about 0.98 to 1.68 g/t on the three smaller licences and about 1.34 to 2.30 g/t on the largest. These are satellite-based estimates for an exploration target, not assay results.
How deep are the targets?
The reports estimate the tops of the zones at about 27 to 40 metres below surface, with the deepest roots at about 100 to 200 metres. On the largest licence, no suggested hole needs to go deeper than 300 metres.
How much time and money did the client save?
On our feedback form, the client selected the highest bands available: more than 6 months of exploration time saved and more than US$100,000 of exploration cost saved. These are the client’s own estimates for this portfolio.
Has the ground been drilled?
Not yet. The client plans to drill within 1 to 3 months of completing the feedback form, starting from the ranked targets.
Can a satellite see gold under tropical vegetation?
Satellites do not see gold itself. They detect signs linked with gold, such as iron oxides, altered rock and structures, and combine them to rank where gold is more likely. Drilling and laboratory assays confirm gold and its grade.
What is a target zone?
A target zone is a group of neighbouring anomalies that can be explored as one programme. On the largest licence, 538 anomalies were grouped into ten target zones so that a field team could plan around them.
Is this a JORC or NI 43-101 resource?
No. The reports give satellite-based exploration targets, which come before any resource estimate. A qualified person needs drilling and assay data to estimate a resource under JORC, NI 43-101 or CIM definitions.
How long does a satellite gold report take?
Delivery usually takes 5 to 20 business days, depending on the size of the area and the mineral.
What do I need to send to screen my own licences?
Send each boundary as coordinates, a KML or KMZ file, or a polygon, along with your target mineral. Our team checks the boundaries with you before the work starts.
Published in anonymised form. The client is not identified and did not provide a testimonial; no statement in this article is quoted from or attributed to them. Concession names, boundaries, coordinates, licence details and exact locations are withheld. All grade, depth and gold-share figures are satellite-based exploration targets and are not Mineral Resources or Mineral Reserves under JORC, NI 43-101 or similar codes. Time and cost savings are bands selected by the client on our feedback form.
Farmonaut mineral detection
Screen your licences from space
Send each concession boundary as KML, KMZ or a polygon. Farmonaut returns ranked satellite exploration targets for every licence, usually in 5 to 20 business days.

Keep reading
Sources
- World Gold Council, Gold production by country: gold.org
- US Geological Survey, Minerals Yearbook: The Mineral Industry of Ghana (2019): pubs.usgs.gov
- US Geological Survey, Mineral Commodity Summaries 2025: Gold: pubs.usgs.gov
- Minerals Commission of Ghana: mincom.gov.gh
- EITI, Ghana country page: eiti.org
- Wikipedia, Birimian: en.wikipedia.org
- Wikipedia, Gossan: en.wikipedia.org
- Copernicus SentiWiki, Sentinel-2 mission: sentiwiki.copernicus.eu
- Copernicus SentiWiki, Sentinel-1 mission: sentiwiki.copernicus.eu
- US Geological Survey, Landsat 9: usgs.gov
- Copernicus Data Space, Copernicus DEM: dataspace.copernicus.eu
- JORC, The JORC Code 2012 edition: jorc.org
- British Columbia Securities Commission, NI 43-101 Standards of Disclosure for Mineral Projects: bcsc.bc.ca
- CIM, Definition Standards for Mineral Resources and Mineral Reserves: cim.org
- LBMA, Precious metal prices: lbma.org.uk
Discussion
Questions, corrections or field experience? Share them below. First-time comments are reviewed before they appear, and your email is never published.
No comments yet. Be the first to add a question or your experience.

 Mwerezi Minerals Company Limited
 Congo Mining Solutions
 Mining SARL
 SenGold Invest SAS
 Sania Corporation
 Sean Mining Limited
 NTS Group (Pty) Ltd
 Mine4Africa
 Lithspo Minerals Limited
 Tintina Mining Group
 Dalgety Minerals Pty Ltd
 Vortex Minerals Pty Ltd
 Faith At Work (Pty) Ltd
 Geotech Mining Solutions plc
 Vulcan International Limited
 Kidepo Associates
 GKY Mining
 Alkimy SARL
 Double A Trading

 Licence holder · Nigeria · Gold + lithium
 Client · Somalia · Gold
 Client & affiliate partner · Ghana · Gold










