

Client case study · Gold and silver · Democratic Republic of the Congo
Gold and Silver Exploration in the DRC: How One Satellite Pass Ranked an 85-Hectare Permit
Gold and silver exploration in the DRC usually starts with weeks of walking and sampling. On this small permit of about 85 hectares, one satellite study for both metals narrowed the ground to about a quarter of the permit, showed that the main silver targets sit inside the main gold target, and gave the client a drill plan before any field spending. The client reported saving up to 30 days and up to US$25,000, and came back to scope more licences.
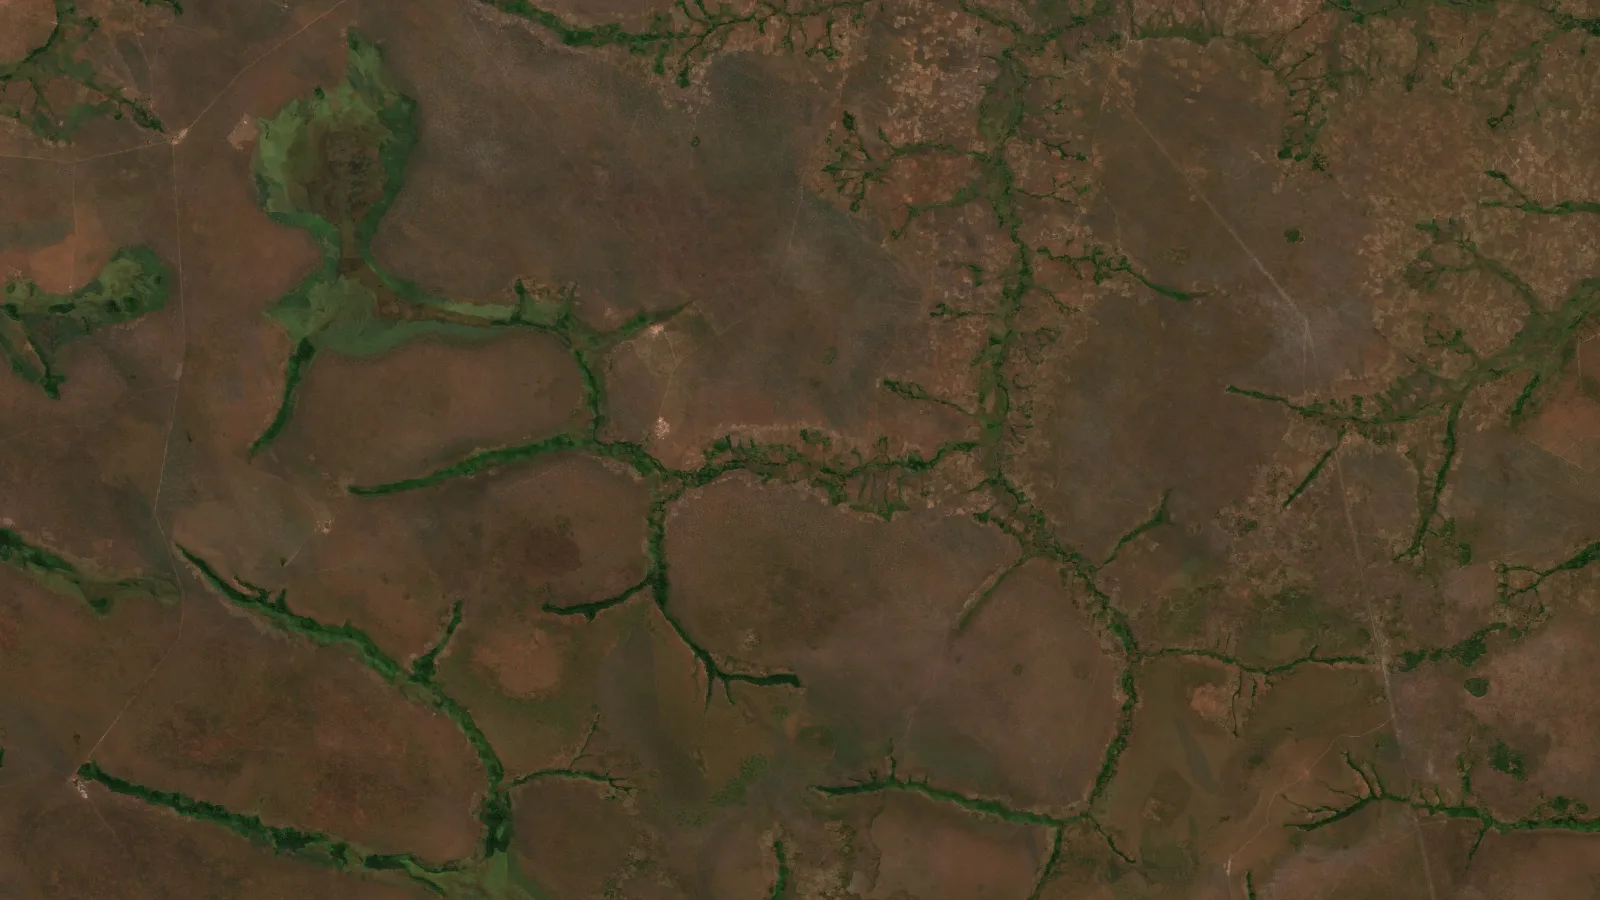
Key takeaways
- A permit of about 85 hectares in the southern DRC was screened for gold and silver at the same time, in one satellite pass and two reports.
- The reports outlined 3 gold zones and 4 silver zones on about 22 ha combined, roughly 26% of the permit.
- About 79% of the silver footprint lies inside the largest gold zone, so one drill programme with dual-element assays can test both metals.
- On a P10 to P90 basis, the exploration targets are about 1,700 to 3,800 oz of gold and 106,000 to 274,000 oz of silver, all starting about 35 to 39 m below surface.
- The client reported saving up to 30 days and up to US$25,000, plans to drill within 3 to 6 months, and came back to scope further licences.
In this article
- A small DRC permit and two metals to check
- Why a two-metal study made sense on this permit
- How the satellite analysis worked
- What the reports found: about a quarter of the permit, in one cluster
- Shallow targets and a drill plan that tests both metals
- Confidence tiers and the order of work
- What the client reported after the reports
- Lessons for small-permit gold and silver explorers
- Gold and silver exploration in the DRC: frequently asked questions
A small DRC permit and two metals to check
This case study follows a small exploration permit of about 85 hectares, or about 208 acres, in the southern Democratic Republic of the Congo. The holder had one practical question before committing money to the ground: is there a gold target here, a silver target, or both, and where exactly should field work start?
Gold and silver exploration in the DRC often begins with a long round of field work. Teams walk the permit, map outcrop, dig pits and send soil and rock samples to a laboratory, and only then decide where a drill rig should go. On a large licence that can take months. Even on a permit of 85 hectares it takes weeks, and it costs money before anyone knows which part of the ground matters most.
The holder took a different first step. They commissioned two Farmonaut Premium Plus satellite reports over the whole permit, one for gold and one for silver, and received both at the same time. Each report screened every hectare of the permit, outlined target zones, estimated their depth and shape, and set out a phased drilling plan. Read together, the two reports answered the question the holder started with.
The DRC is one of the world’s great mineral provinces, and the Extractive Industries Transparency Initiative’s country page shows how much of the national economy rests on mining. Most of the attention goes to copper and cobalt. Gold and silver ground held by smaller operators gets far less, and those operators are exactly the ones who benefit most from a fast, low-cost first look. If you work in the country, our French-language guide to gold exploration in the DRC covers the mining cadastre and the permit process.
Why a two-metal study made sense on this permit
Gold and silver often travel together. In many hydrothermal systems the same hot fluids that carry gold also carry silver, and the two metals end up in the same veins, shears and altered rock. That makes it worth screening for both at once. If the targets line up, one drill programme can test both metals. If they do not, the holder learns that early, before a rig is booked.
Each Farmonaut report is built for its own metal. The gold report uses a Gold Potential Index tuned to the signs of gold-bearing alteration. The silver report uses a separate Silver Prospectivity Index that adds signals linked with silver, such as clay and sulphide alteration, carbonate and manganese oxides, and a radar measure of surface texture. Running both over the same permit gives two independent opinions about the same ground.
- Separate scoring for each metal: the gold and silver indices weigh the evidence differently, so overlap between them is a real agreement, not the same map printed twice.
- One delivery date: both reports arrived together, so the holder could plan field work around a single combined picture.
- Shared files: both reports came with zone outlines, grade maps, a terrain model and 3D drill-plan views, which load into the same GIS project or into Farmonaut Mining Pro.
How the satellite analysis worked
The client’s part took minutes. The holder sent the permit boundary and named gold and silver as the target metals. No one needed to visit the site at this stage, and no ground was disturbed.
Infographic
How the permit went from a boundary to a two-metal drill plan
- 1Send the boundaryThe holder sent the permit outline and named gold and silver.
- 2Analyse from spaceOptical, shortwave-infrared, radar, thermal, magnetic and terrain data were combined.
- 3Score each metalSeparate gold and silver indices were built for every 10 m pixel.
- 4Map and compareGold and silver zones were outlined and checked for overlap.
- 5Plan one programmeShared collars on the overlap test both metals in one campaign.
Both reports drew on the same stack of satellite and geophysical data, so no single sensor decided the result on its own:
- Sentinel-2 optical images: this European mission gives 10-metre images used for iron oxides, alteration colour and plant stress.
- ASTER shortwave infrared: the ASTER instrument separates clay, mica and carbonate minerals that mark altered rock.
- Sentinel-1 and PALSAR-2 radar: Sentinel-1 and the L-band PALSAR-2 radar pick out faults, fractures and surface roughness, and see through cloud in the wet season.
- Thermal data: day and night surface temperatures from MODIS and ASTER help flag silica-rich and oxidised ground.
- Magnetics: the EMAG2 magnetic anomaly grid adds the regional picture of buried structures.
- Terrain and drainage: the Copernicus elevation model supplies slope, landform and stream networks, which matter for both bedrock and alluvial targets.
Each layer became a score, and the scores were combined into one index per 10-metre pixel for each metal. Pixels that scored highly and agreed across several independent signals were grouped into target zones. Each zone then got a grade band, a depth estimate, a strip ratio, a confidence tier and a suggested drill direction.
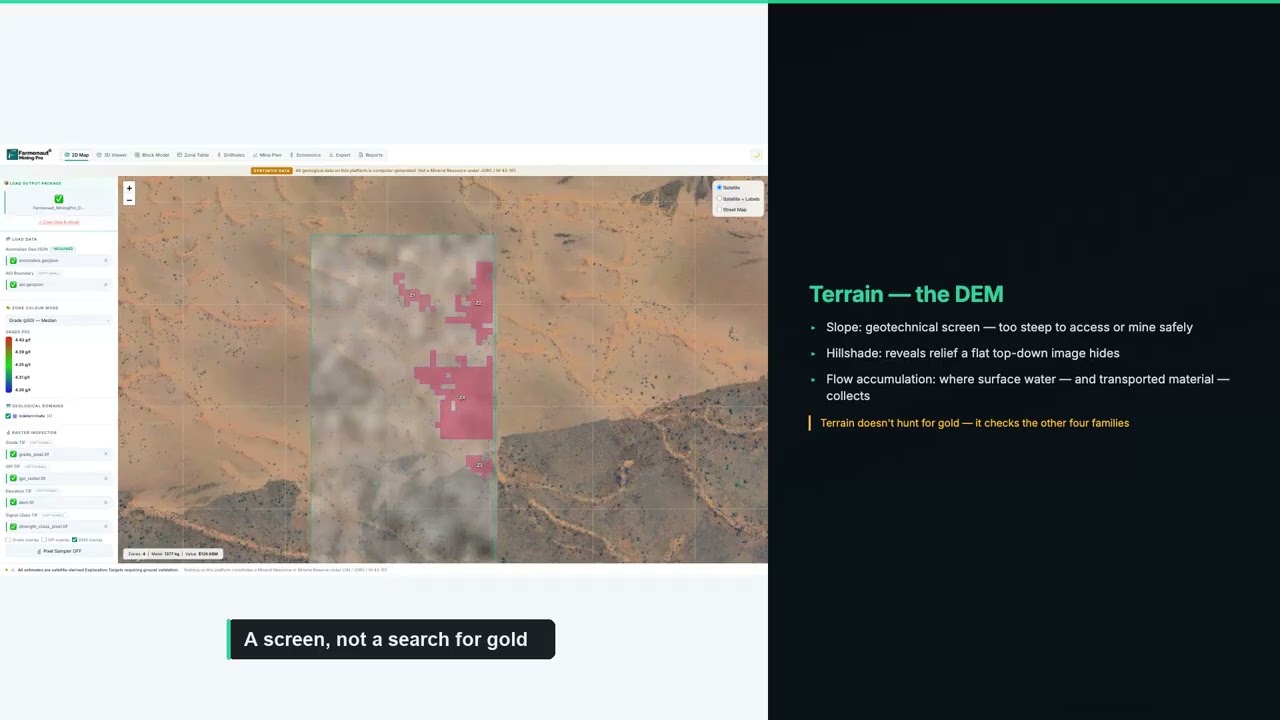
▶ The physics behind satellite gold exploration, from our Mining Pro course. · 18:58
The reports also checked every zone against a list of things that can cause a false signal, such as a zone sitting close to the permit edge. Those checks did not remove zones. They set the order of field work and told the geologist what to look at first on the ground.
What the reports found: about a quarter of the permit, in one cluster
The gold report outlined 3 target zones covering about 19.2 hectares. The silver report outlined 4 zones covering about 12.6 hectares. Because the two maps overlap, the combined target ground is about 21.8 hectares, or about 26% of the permit. In practice, the first round of mapping, sampling and drilling can focus on about one hectare in every four.
Chart
Both metals’ targets sit on about a quarter of the permit
Hectares
The most useful result is where the targets sit. About 10 hectares of the silver footprint, roughly 79% of it, lies inside the largest gold zone. The two largest silver zones sit almost entirely within that gold zone. For the holder, that means one cluster of ground carries most of the evidence for both metals, and one set of drill pads can test both.
Here is how the gold zones compare. We use the zone numbers from the report so the figures match the drill plan later in this article.
| Gold zone | Footprint | Strike length | Estimated depth | Grade band (P10–P90) | Contained gold (P10–P90) | Strip ratio | Share of central estimate |
|---|---|---|---|---|---|---|---|
| Zone 3 | 15.8 ha | 894 m | 36–46 m | 0.60–1.61 g/t | ~930–2,500 oz | 3.6 | 62% |
| Zone 2 | 2.4 ha | 272 m | 39–74 m | 0.51–0.76 g/t | ~550–830 oz | 1.1 | 25% |
| Zone 1 | 1.0 ha | 149 m | 39–74 m | 0.57–1.09 g/t | ~250–480 oz | 1.1 | 13% |
| All 3 zones | 19.2 ha | 36–74 m | 0.51–1.61 g/t | ~1,700–3,800 oz | 2.4 weighted | 100% |
Source: Farmonaut satellite gold detection report for this permit, 2026. Grade and contained-gold bands are the report’s per-zone P10 to P90 values, summed for the total. Strip ratio is tonnes of waste rock per tonne of target rock. Shares are rounded.
Gold Zone 3 leads clearly. It is about 900 metres long, holds about 62% of the gold in the report’s central estimate, and starts only about 36 metres below surface. The report reads it two ways at once: as a gossan-style bedrock target, and as a headwater placer target along a drainage line. That gives the field team two ways to test it, with pits or augers in the alluvium and core holes into the rock below.
Chart
Gold Zone 3 holds about 62% of the modelled gold
Share of the report’s central gold estimate, %
Across all three zones, the report’s P10 to P90 exploration target comes to about 1,700 to 3,800 troy ounces of contained gold, or about 54 to 119 kg, with a central estimate of about 3,100 ounces. Applying the report’s blended recovery assumption of 81% gives about 1,400 to 3,100 ounces of recoverable gold. Every gold zone sits above the report’s cut-off grade.
The silver picture is larger by ounces. The silver report’s zones, again using its own numbers, compare like this:
| Silver zone | Footprint | Strike length | Estimated depth | Grade band (P10–P90) | Contained silver (P10–P90) | Confidence | Share of central estimate |
|---|---|---|---|---|---|---|---|
| Zone 3 | 7.1 ha | 626 m | 37–62 m | 24–67 g/t | ~60,000–169,000 oz | Medium | 61% |
| Zone 2 | 3.9 ha | 285 m | 35–60 m | 29–66 g/t | ~40,000–91,000 oz | High | 34% |
| Zone 4 | 0.8 ha | 148 m | 37–62 m | 23–54 g/t | ~6,500–15,000 oz | Medium | 5% |
| Zone 1 | 0.9 ha | 178 m | 38–63 m | Follow-up target | Not counted | Medium | 0% |
| All 4 zones | 12.6 ha | 35–63 m | 23–67 g/t | ~106,000–274,000 oz | 1 high, 3 medium | 100% |
Source: Farmonaut satellite silver detection report for this permit, 2026. Bands are the report’s per-zone P10 to P90 values, summed for the total. Zone 1 sits below the report’s silver cut-off, so its silver is not counted in the total and it is held as a follow-up target. Shares are rounded.
On a P10 to P90 basis, the silver exploration target comes to about 106,000 to 274,000 troy ounces, or about 3.3 to 8.5 tonnes of silver, with a central estimate of about 144,000 ounces at a weighted grade of about 34 g/t. At the report’s 80% recovery assumption, that is about 85,000 to 220,000 recoverable ounces. Silver Zones 2 and 3 hold about 95% of the central estimate, and Zone 2 carries the study’s only high-confidence rating.
Chart
Two silver zones hold about 95% of the modelled silver
Share of the report’s central silver estimate, %
The report classifies the silver zones as argillic shear targets, with deposit-style scores that lean towards epithermal silver, a style in which silver and gold are often deposited together near the surface. That fits the overlap with the gold map, and it gives the geologist a clear list of rock types and alteration to look for on the ground.
If you want to try the same arithmetic on a target of your own, the calculator below turns tonnage and grade into contained silver and a gross value. Gross value is metal multiplied by price, before any mining or processing cost, so it is a way to compare targets rather than a forecast of profit.
Calculator
What is a silver target worth on paper?
Enter your own target. All amounts are in US dollars.
- Contained silver (kg): 1,500.0
- Contained silver (troy oz): 48,226
- Value after recovery (US$): $1,929,043
Example values only, not a benchmark, and not related to this project. 1 troy ounce is 31.1035 g. The silver price is an example, so check today’s price. Gross value is before mining and processing costs.
Shallow targets and a drill plan that tests both metals
A target is only useful if a project can reach it. On this permit the targets are shallow. The tops of the gold zones sit about 36 to 39 metres below surface and the tops of the silver zones about 35 to 38 metres. The deepest base of any zone is about 74 metres. That band is well within reach of standard diamond-core or reverse-circulation drilling.
Chart
Estimated depth of the gold and silver zones
Metres below surface, top to base of each zone
Strip ratios are modest. The tonnage-weighted strip ratio is about 2.4 for the gold zones and about 1.5 for the silver zones. Surface operations commonly work with higher ratios, so the depth of these targets would not by itself rule out a surface approach later on. The permit is also easy to work: slopes are gentle, access is rated easy, and a stream network runs close to the targets.
Each report sets out its own phased plan. Because the targets overlap, the two plans fall on much of the same ground:
- Gold, Phase 1: 16 core holes of about 59 metres on Gold Zone 3 and 4 holes of about 94 metres on Gold Zone 2, at 70 degrees, plus a composite sample for metallurgical tests and detailed mapping.
- Silver, Phase 1: 11 core holes of about 79 metres on Silver Zone 3 and 5 holes of about 77 metres on Silver Zone 2, again at 70 degrees.
- Phase 2 for both: confirmation holes on the smaller zones, ground magnetic and induced-polarisation surveys, and a first compliant resource estimate if the drilling supports one.
Chart
Phase 1 core holes suggested by each report
Number of holes on the leading zones
Since Silver Zones 2 and 3 sit inside Gold Zone 3, many of these holes can be planned once and assayed for both metals. Every metre of core then answers two questions. For a small permit holder, that is the most direct saving the two-metal study offers: one set of pads, one rig mobilisation and one assay campaign that tests both commodities.
▶ How to turn satellite targets into a drilling programme. · 5:49
For budgeting, the gold report also gives a planning-grade figure for one confirmation hole in each gold zone: about 285 metres in all, or about US$43,000 to US$71,000 at an all-in rate of US$150 to US$250 per metre, and under 10 days for a single rig. A contractor’s quote replaces those figures once the plan is fixed. Enter your own rates in the calculator below.
Calculator
What would a first drill programme cost?
Enter your contractor’s quote. All amounts are in US dollars.
- Total metres: 420
- Cost per hole (US$): $15,667
- Single-rig days (excluding moves): 14.0
Example values only. The report’s planning band is an all-in US$150 to US$250 per metre for diamond core, including logging, assays and supervision. Costs vary with location, rock type and rig availability, so use real quotes from your contractor and laboratory.
Confidence tiers and the order of work
Each report gives every zone a confidence tier, based on how strong its pixel-level signal is and how many independent checks agree with it. The tiers set the order of work, not whether a zone is tested.
- Silver Zone 2, high confidence: the only high-confidence zone in the study, and it sits inside Gold Zone 3. It is the natural first target.
- Gold Zone 3 and Silver Zone 3, medium confidence: the two largest targets, sharing most of their ground. Phase 1 resolves whichever signals disagree.
- Gold Zones 1 and 2, Silver Zones 1 and 4, medium confidence: smaller targets that follow once the first results are in.
That order makes sense for a limited budget. Start where the strongest signal and the biggest overlap meet, then let the first assays guide the rest of the programme.
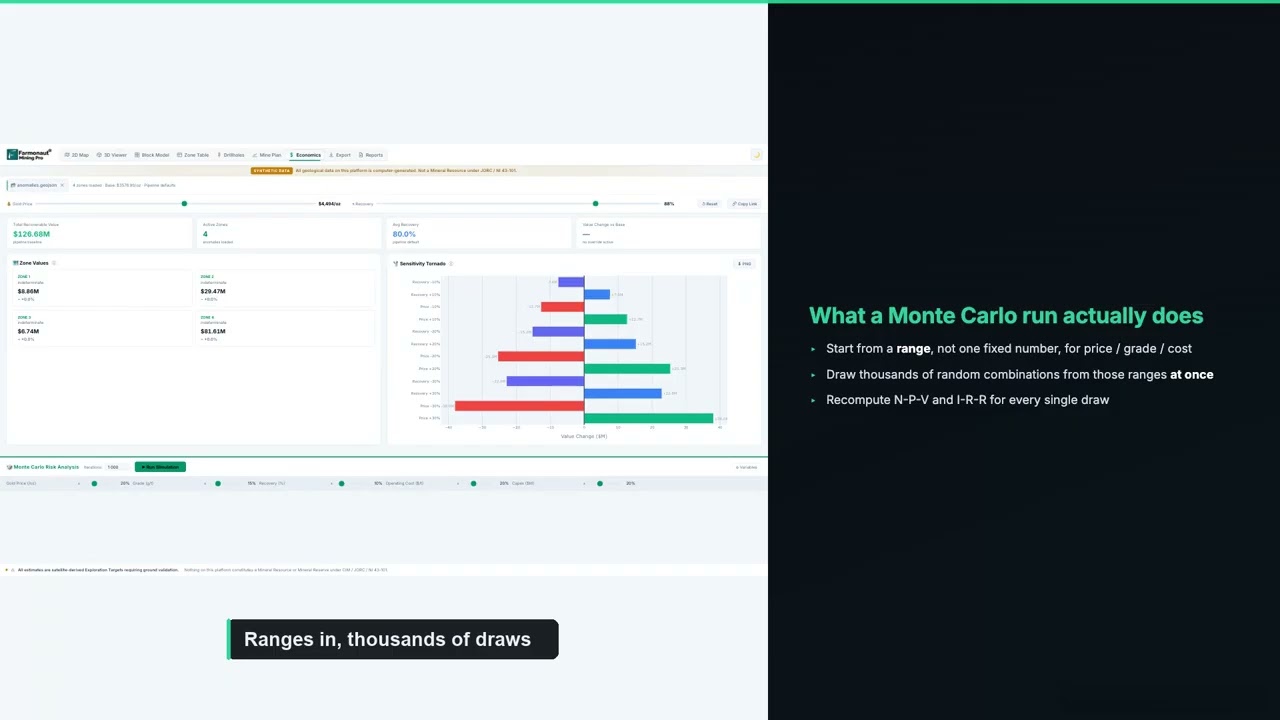
▶ What P10, P50 and P90 ranges mean, and why the estimates in this article are given as bands. · 14:59
What the client reported after the reports
About seven weeks after the reports were delivered, the client completed our structured post-project feedback form. These are the client’s own recorded answers to fixed questions on that form. They are reproduced without alteration and are not presented as a quotation.
- Locations narrowed: yes. The analysis helped narrow down where to explore or drill.
- Exploration time saved: yes, in the band of up to 30 days.
- Exploration cost saved: yes, in the band of up to US$25,000.
- Drilling so far: not yet drilled.
- Planned drilling: within 3 to 6 months.
Those answers fit a small permit well. On 85 hectares, a month of field work and a five-figure sampling budget are a large share of what a first season costs. A study that points field crews straight at a quarter of the ground removes much of that early spend, and with drilling planned within months, the saved time goes straight into the drilling schedule.
The clearest sign of value came afterwards. Once the holder had worked with the gold and silver reports, they returned to us to scope satellite studies for further licences, including ground for lithium and tin in the DRC and a gold permit elsewhere in southern Africa. A first look on one small permit became the template for the rest of the portfolio.

▶ Why satellite screening comes before the drill rig. · 4:26
Lessons for small-permit gold and silver explorers
Several parts of this project carry over to other small permits in the DRC and across Africa.
- Screen for both metals at once: where gold and silver can occur together, two independent maps tell you whether one drill programme can test both.
- Look for the overlap first: ground where both indices agree is the strongest place to start, as Gold Zone 3 and Silver Zones 2 and 3 showed here.
- Use small-permit economics: on 85 hectares, saving a month of field work and early sampling costs is a meaningful share of the first-season budget.
- Plan holes once, assay twice: shared collars and dual-element assays turn every metre of core into evidence for both metals.
- Test placer and bedrock together: where a target follows a drainage, pits in the alluvium and core in the rock can run in the same campaign.
- Make it a portfolio method: once one permit has been screened this way, the same approach ranks the next licences quickly.
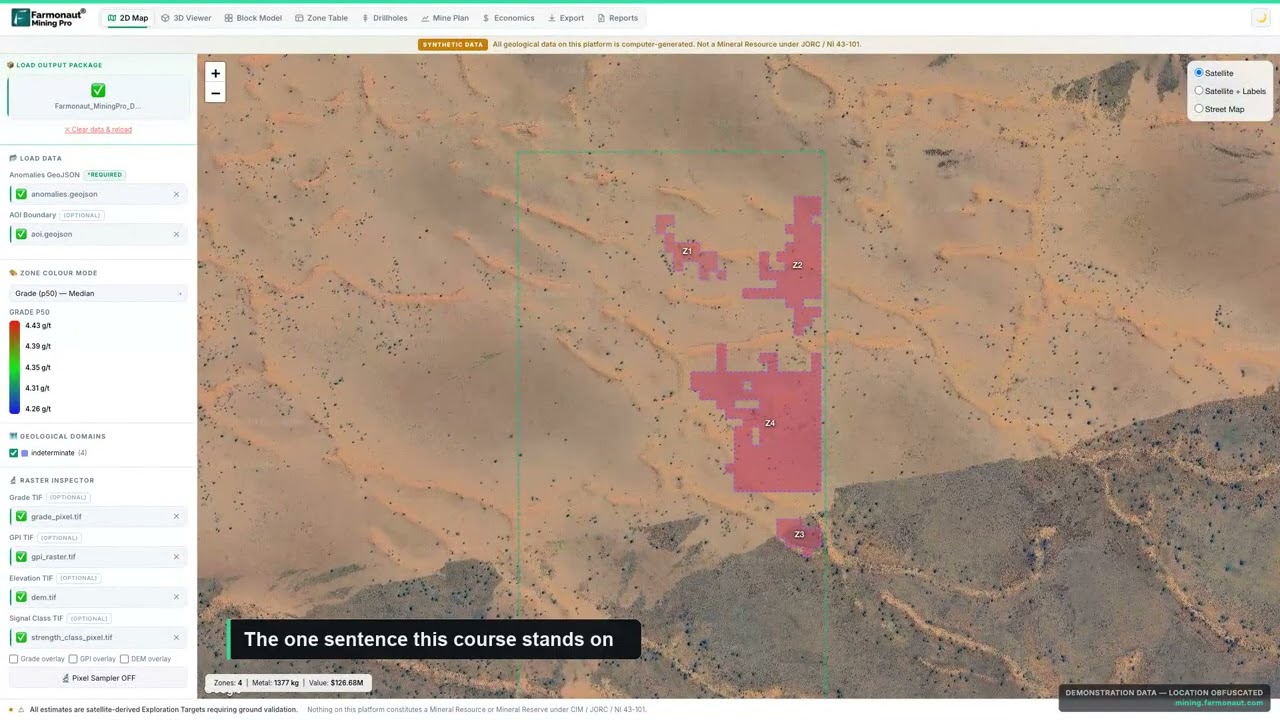
▶ What an exploration target is, and how it differs from a resource. · 4:14
Getting a similar study for your own ground follows the same steps. Send your boundary as coordinates, a KML or KMZ file, or a polygon, and name one or more target metals. Delivery usually takes 5 to 20 business days, depending on the size of the area and the number of metals. You can map your mining site yourself or get a quote from our team.
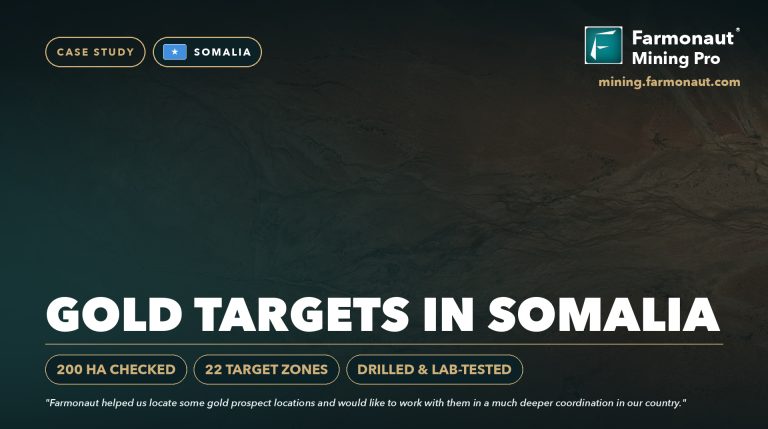
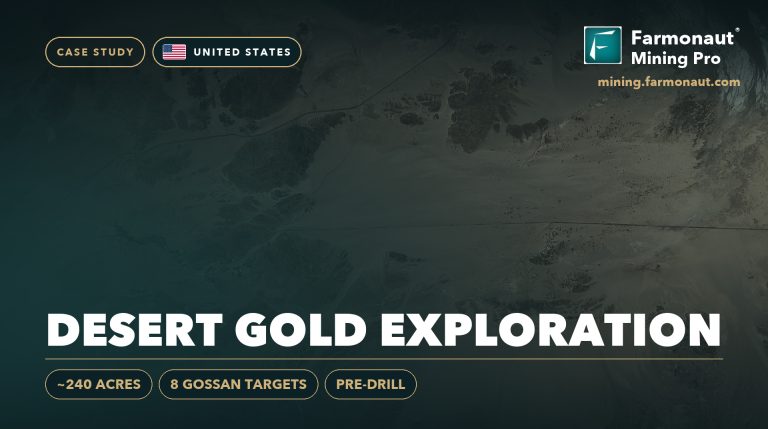
Want to see the approach on other ground? Read how a gold explorer moved from satellite targets to drilling in our Somalia gold case study, how bare desert ground was screened in our US Southwest gold case study, or how satellite mapping works for battery metals in our DRC cobalt mapping study.
Gold and silver exploration in the DRC: frequently asked questions
What did the satellite study find on this DRC permit?
On a permit of about 85 hectares, the gold report outlined 3 target zones and the silver report outlined 4. Together they cover about 22 hectares, or about 26% of the permit, and about 79% of the silver footprint sits inside the largest gold zone.
Why screen for gold and silver at the same time?
The two metals often occur together in hydrothermal systems. Separate indices for each metal show whether their targets line up. When they do, as here, one drill programme with dual-element assays can test both.
How much gold and silver do the reports estimate?
On a P10 to P90 basis, the gold exploration target is about 1,700 to 3,800 troy ounces, with a central estimate of about 3,100 ounces. The silver exploration target is about 106,000 to 274,000 troy ounces, with a central estimate of about 144,000 ounces. These are exploration targets, not resources.
How deep are the targets?
The tops of the zones sit about 35 to 39 metres below surface, and the deepest base is about 74 metres. Suggested core holes are about 59 to 94 metres long at 70 degrees.
How much time and money did the client save?
On our feedback form, the client selected the bands of up to 30 days of exploration time saved and up to US$25,000 of exploration cost saved. These are the client’s own estimates for this project.
Has the permit been drilled?
Not yet. Drilling is planned within 3 to 6 months of the feedback. Both reports start their drill plans on the overlapping ground of Gold Zone 3 and Silver Zones 2 and 3.
Does satellite exploration work on a small permit?
Yes. The analysis runs on 10-metre pixels, so a permit of 85 hectares holds thousands of data points. On small ground the saving is often largest in relative terms, because early field work is a big share of the budget.
Can a satellite detect gold or silver directly?
No. Satellites detect signs linked with these metals, such as altered rock, iron oxides, clays and structures. The analysis combines those signs to rank where gold or silver is more likely. Drilling and laboratory assays confirm the metal and its grade.
Is this a JORC, NI 43-101 or SAMREC resource?
No. The reports give satellite-based exploration targets, which come before any resource estimate. A competent or qualified person needs drilling and assay data to estimate a resource under JORC, CIM and NI 43-101 or SAMREC.
How long does a gold and silver report take?
Delivery usually takes 5 to 20 business days, depending on the size of the area and the number of metals. On this permit, both reports were delivered together.
What do I need to send for my own permit?
Send your boundary as coordinates, a KML or KMZ file, or a polygon, along with your target metals. Our team checks the boundary with you before the work starts.
Published in anonymised form. The client is not identified and did not provide a testimonial; no statement in this article is quoted from or attributed to them. The permit number, boundary, coordinates and exact location are withheld. All resource figures are satellite-based exploration targets and are not Mineral Resources or Mineral Reserves under JORC, NI 43-101, SAMREC or similar codes. Time and cost savings are bands selected by the client on our feedback form.
Farmonaut mineral detection
Map your mining site from space
Send your claim or licence boundary as KML, KMZ or a polygon. Farmonaut returns ranked satellite exploration targets for it, usually in 5 to 20 business days.

Keep reading
Sources
- US Geological Survey, Mineral Commodity Summaries 2025: Silver: pubs.usgs.gov
- US Geological Survey, Mineral Commodity Summaries 2025: Gold: pubs.usgs.gov
- Extractive Industries Transparency Initiative, Democratic Republic of the Congo: eiti.org
- World Bank, The Democratic Republic of Congo overview: worldbank.org
- Copernicus SentiWiki, Sentinel-2 mission: sentiwiki.copernicus.eu
- Copernicus SentiWiki, Sentinel-1 mission: sentiwiki.copernicus.eu
- NASA JPL, ASTER instrument: asterweb.jpl.nasa.gov
- JAXA EORC, ALOS-2 PALSAR-2: eorc.jaxa.jp
- NASA, MODIS: modis.gsfc.nasa.gov
- NOAA NCEI, Earth Magnetic Anomaly Grid (EMAG2): ncei.noaa.gov
- Copernicus Data Space, Copernicus DEM: dataspace.copernicus.eu
- JORC, The JORC Code 2012 edition: jorc.org
- CIM, Definition Standards for Mineral Resources and Mineral Reserves: cim.org
- SAMCODE, South African Mineral Reporting Codes (SAMREC): samcode.co.za
- LBMA, Precious metal prices: lbma.org.uk
Discussion
Questions, corrections or field experience? Share them below. First-time comments are reviewed before they appear, and your email is never published.
No comments yet. Be the first to add a question or your experience.

 Congo Mining Solutions
 Mining SARL
 SenGold Invest SAS
 Sania Corporation
 Sean Mining Limited
 NTS Group (Pty) Ltd
 Mine4Africa
 Lithspo Minerals Limited
 Tintina Mining Group
 Dalgety Minerals Pty Ltd
 Vortex Minerals Pty Ltd
 Faith At Work (Pty) Ltd
 Geotech Mining Solutions plc
 Vulcan International Limited
 Kidepo Associates
 GKY Mining
 Alkimy SARL
 Double A Trading
 GemSprout Metals Limited
 Qader Group
 Ileys General Trading
 SG Gold Mining LLC
 VRV Global Pte Ltd

 Client · Tanzania · Gold
 Client & affiliate partner · Ghana · Gold










