

Gold ETFs and platinum stocks · Ranked comparison
Best Gold ETFs and Platinum Stocks: Fees, Size, Output
GLDM charges 0.10%, IAU 0.25% and GLD 0.40% (issuer pages, 14 October 2026). Implats refined 3.56 Moz of 6E metal in the year to June 2026. Fees, size and output are ranked below.
Key takeaways
- GLDM has the lowest fee of four physical gold funds at 0.10%, against 0.17% for SGOL, 0.25% for IAU and 0.40% for GLD (issuer pages and SEC filings, October 2026).
- GLD is the largest of the three at US$138.6 billion in assets; IAU holds US$60.9 billion and 463.05 tonnes of gold (issuer pages, 14 October 2026).
- Global gold ETFs took in a record US$31 billion in the third quarter of 2026 after 44.8 tonnes of outflows in the second quarter (World Gold Council).
- Implats refined 3.56 Moz of 6E metal in the year to June 2026; Valterra guides to 3.0-3.4 Moz for 2026 (company reports).
- The WPIC reported a 548,000 oz platinum surplus for the first half of 2026 and forecasts a 283,000 oz deficit in the second half (Miningmx, citing the WPIC Platinum Quarterly).
In this article
- How we chose and ranked the gold ETFs
- Best gold ETFs compared by fee and size
- What a gold ETF fee costs over time
- Gold bullion fund or gold miners fund
- What is moving gold ETF demand
- Platinum mining stocks ranked by reported output
- Platinum price, supply and ETF selling
- Platinum fund or platinum miners
- Risks to check before you invest
- How satellite screening fits metals research
- Frequently asked questions
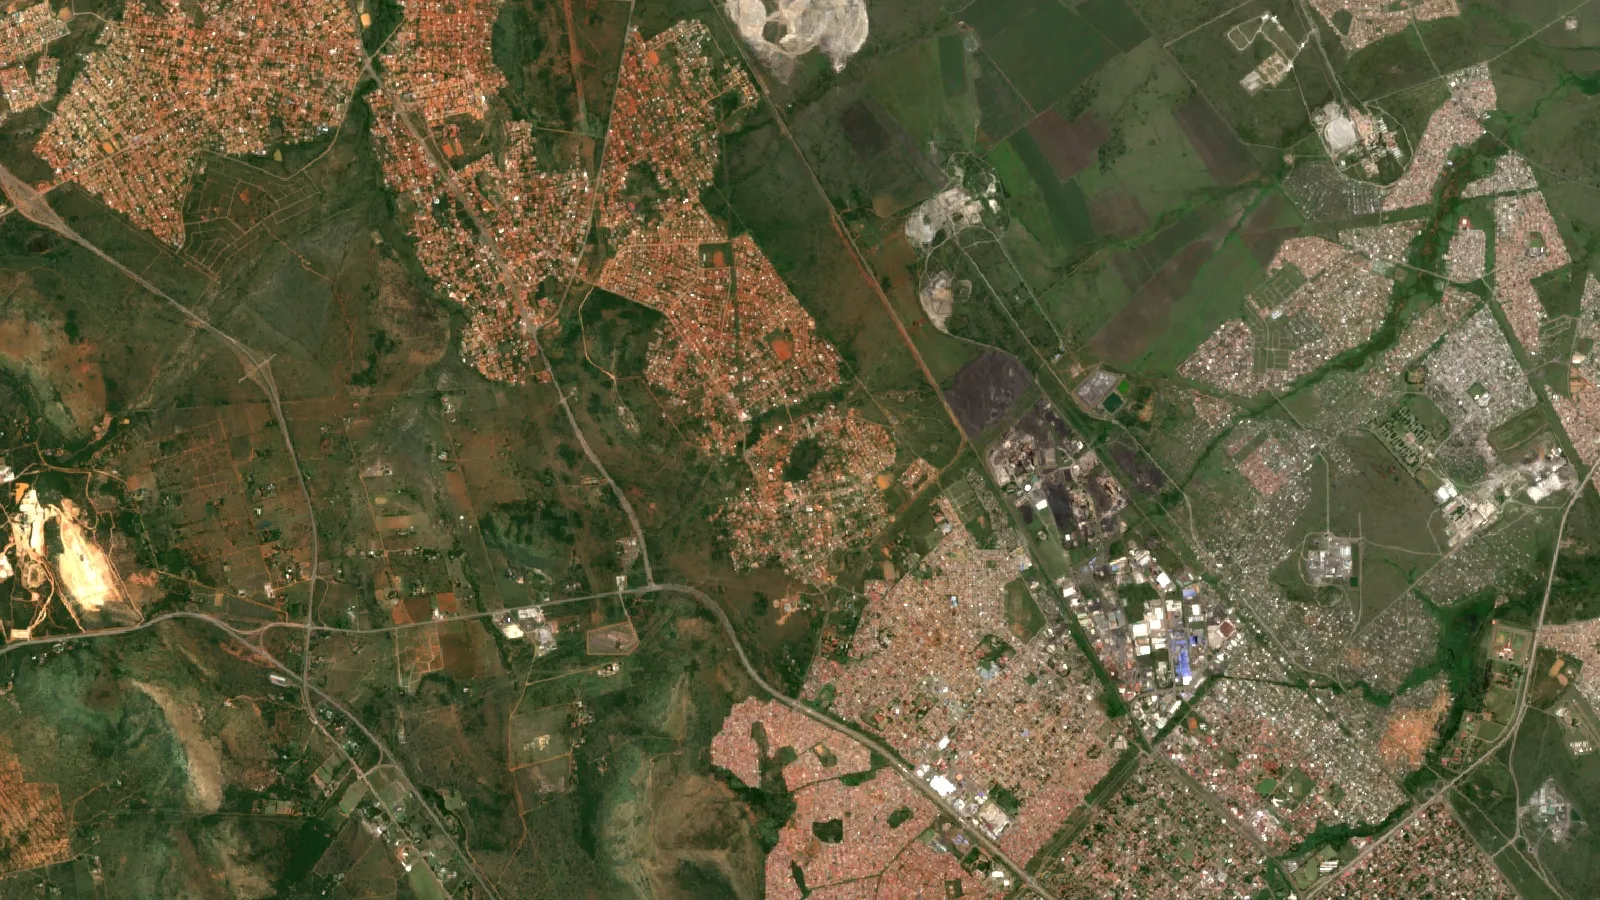
Among the large US-listed physical gold funds, SPDR Gold MiniShares (GLDM) charges the lowest annual fee at 0.10%, iShares Gold Trust (IAU) charges 0.25%, and SPDR Gold Shares (GLD) charges 0.40% but is the largest of the three, with US$138.6 billion in assets on 14 October 2026 (State Street). On the platinum side, two large producers are Impala Platinum, which refined 3.56 million ounces of 6E metal in the year to June 2026, and Valterra Platinum, which guides to 3.0 to 3.4 million ounces for 2026. This page ranks both groups on facts you can check, then gives a fee calculator and a Sentinel-2 view of the Bushveld Complex, where most platinum is mined. It is not investment advice.
How we chose and ranked the gold ETFs
An exchange-traded fund (ETF) is a fund whose shares trade on a stock exchange like a company share. A physical gold ETF owns gold bars held by a custodian and issues shares that track the gold price, less a yearly fee called the expense ratio or sponsor fee. The gold price used by these funds is usually the LBMA Gold Price, set twice a day in London.
We used three rules. First, the fund must hold physical gold, not futures or mining shares. Second, we only include funds whose fee we confirmed on the issuer’s own page or in its filing with the US Securities and Exchange Commission (SEC). Third, we rank by expense ratio, lowest first, because for funds that hold the same metal the fee is the main controllable difference. Size and trading volume are shown as a second check, since a bigger fund usually trades with a tighter gap between the buy and sell price.
Other physical gold funds exist, including GraniteShares Gold Trust (BAR), VanEck Merk Gold Trust (OUNZ) and Goldman Sachs Physical Gold ETF (AAAU). We could not confirm their fees from issuer or SEC pages for this update, so they are not ranked.
Best gold ETFs compared by fee and size
The table sets four funds side by side. Assets and net asset value (NAV, the value of the fund’s holdings per share) are issuer figures dated 14 October 2026, except SGOL, whose size is from its SEC annual report at 31 December 2025. Gold itself was quoted at US$4,157.70 per troy ounce (bid) on 15 October 2026 at 14:51 New York time (Kitco).
Chart
Assets of three large physical gold ETFs
US$ billion, 14 October 2026
| Rank by fee | Fund (ticker) | Annual fee | Assets, 14 Oct 2026 | Cost per US$10,000 a year | Listed |
|---|---|---|---|---|---|
| 1 | SPDR Gold MiniShares (GLDM) | 0.10% | US$30.4 billion | US$10 | June 2018 |
| 2 | abrdn Physical Gold Shares (SGOL) | 0.17% | US$7.3 billion (31 Dec 2025) | US$17 | n/a |
| 3 | iShares Gold Trust (IAU) | 0.25% | US$60.9 billion | US$25 | January 2005 (inception) |
| 4 | SPDR Gold Shares (GLD) | 0.40% | US$138.6 billion | US$40 | November 2004 |
1. SPDR Gold MiniShares (GLDM)
Best for: long-term holders who want the lowest fee. GLDM is a separate trust in the World Gold Trust, tracks the LBMA Gold Price PM and lists a gross expense ratio of 0.10%, with assets of US$30,431 million and a NAV of US$80.88 on 14 October 2026 (State Street).
Pros: lowest fee of the three; a lower share price, so smaller purchases are easier. Cons: smaller than GLD and IAU.
2. abrdn Physical Gold Shares (SGOL)
Best for: investors who want a fee close to the lowest while holding a fund that pays its sponsor in gold. SGOL’s sponsor fee accrues daily at an annualized 0.17% of adjusted net asset value and is paid in gold. The trust held US$7,332.6 million in net assets at 31 December 2025, tracks the LBMA Gold Price PM and uses ICBC as custodian (abrdn Gold ETF Trust annual report, filed with the SEC).
Pros: the second-lowest fee here. Cons: it is much smaller than GLD or IAU, and the size shown is from a different date than the other funds.
3. iShares Gold Trust (IAU)
Best for: investors who want a mid-priced fee and a large fund. IAU lists a sponsor fee of 0.25% and net assets of US$60,871,908,901 on 14 October 2026. It held 463.05 tonnes of gold in trust, its NAV was US$76.85, and its shares traded at a 0.29% premium to NAV (iShares).
Pros: the fee is 0.15 percentage points below GLD’s, and the fund is large. Cons: its 52-week NAV range of US$74.39 to US$101.77 and year-to-date NAV return of -5.27% show that a gold fund falls when gold falls. The fee does not protect you from price moves.
4. SPDR Gold Shares (GLD)
Best for: traders who need the deepest market. GLD has been listed since 18 November 2004, has a gross expense ratio of 0.40%, and held US$138,577 million with a NAV of US$374.84 on 14 October 2026 (State Street).
Pros: the largest gold fund in this comparison, so it is easy to trade in size. Cons: the highest fee of the three. On a US$100,000 holding, the gap to GLDM is US$300 a year.
What a gold ETF fee costs over time
A fee of 0.40% sounds small, but it is charged every year, and the funds pay it by selling a little gold. iShares states that the amount of gold behind each share falls over the life of the trust because gold is sold to pay the sponsor’s fee and expenses (iShares). Use the calculator to see what your own amount costs at each fee. The inputs are examples; the result is a simple estimate that ignores price changes and trading costs.
Calculator
What will a gold ETF fee cost me?
Enter your own amount, the fund’s fee and how long you will hold it.
- Fee in one year: $25
- Gold your money represents: 2.50 oz
- Share of the holding paid in fees: 2.5 %
Example values only. The fee is the expense ratio on the issuer’s page (GLDM 0.10%, IAU 0.25%, GLD 0.40% on 14 October 2026). Gold price is an input: example, use today’s price. The result is a simple estimate that ignores price changes, trading costs and tax.
Gold bullion fund or gold miners fund
A gold bullion fund such as GLD, IAU or GLDM follows the gold price. A gold miners fund holds company shares, for example the VanEck Gold Miners ETF (GDX) or VanEck Junior Gold Miners ETF (GDXJ). Those shares follow gold too, but with extra moving parts: mining costs, wages, power, taxes, project delays and management decisions. When the gold price rises, miners’ margins can widen faster than the metal price. When it falls, they can fall faster.
The choice comes down to what you want to own. Bullion funds have no mine risk. Miner funds carry it, and in return they offer exposure to production growth. For a closer look at smaller producers and how they are screened, see our guide to junior gold mining stocks.
Fees on miner funds are higher than on bullion funds. The VanEck Gold Miners ETF (GDX) shows total annual operating expenses of 0.51% in its summary prospectus dated 1 May 2026, against 0.10% to 0.40% for the bullion funds above.

▶ Follows a gold nugget from rock to ring, showing how gold is mined and refined. · 5:27
What is moving gold ETF demand
Gold ETF buying swung sharply in 2026. The World Gold Council (WGC) recorded outflows of 44.8 tonnes from ETFs and similar products in the second quarter, after 62.4 tonnes of inflows in the first quarter, and it linked the selling to a weaker gold price, higher inflation and rate expectations, and a stronger US dollar, mostly in North America (WGC Gold Demand Trends). The same report puts the LBMA Gold Price PM average at US$4,506.29 per ounce in the second quarter, 8% below the first-quarter record.
Chart
Gold ETF demand by quarter
Tonnes; positive is net buying, negative is net selling
Then the third quarter turned. Global gold ETFs took in a record US$31 billion in Q3, including US$10 billion in September, and global holdings rose 67 tonnes in September to a record 4,256 tonnes (WGC Gold ETF Flows, September 2026). Europe led with US$14 billion for the quarter, North American funds took US$12 billion, and Asian funds US$4.9 billion. UK-listed funds had their strongest quarter on record at US$7.5 billion.
The WGC noted that North American inflows came even though the US Federal Reserve raised rates by 25 basis points in September. It suggested that persistent inflation, worries about equity valuations and bond-market volatility may have supported demand. Treat this as the WGC’s reading, not a forecast. Fund flows tell you what investors did, not what gold will do next.
Platinum mining stocks ranked by reported output
Platinum is mined together with palladium, rhodium and gold, so companies report “PGM ounces”. The label matters. “4E” means platinum, palladium, rhodium and gold. “6E” adds iridium and ruthenium. Valterra reports “5E+Au”. The figures below are not like for like: Implats reports refined and saleable 6E output including third-party metal, Valterra’s number is 2026 guidance on a 5E+Au basis, and Northam’s is refined output from its own operations on a 4E basis.
We order the three producers by the size of the headline number each reports, with the basis shown in the table, and then list Sibanye-Stillwater and the two developers separately. Company names changed in 2025: Anglo American Platinum is now Valterra Platinum, after Anglo American completed the demerger on 31 May 2025 (Anglo American, 2025).
| Rank | Company | Listing | Latest output or guidance | Basis |
|---|---|---|---|---|
| 1 | Impala Platinum (Implats) | JSE; US ADR programme | 3.56 Moz refined and saleable, year to June 2026 | 6E, includes third-party metal |
| 2 | Valterra Platinum | JSE and London | 2026 guidance 3.0 to 3.4 Moz (Q2 actual 963,500 oz refined) | 5E+Au, guidance |
| 3 | Northam Platinum | JSE: NPH | 938,754 oz own-operations refined, year to June 2026 | 4E, own operations only |
1. Impala Platinum (Implats)
Best for: investors who want the largest reported PGM output in this group. Implats reported group 6E production of 3.50 million ounces (Moz) for the year to 30 June 2026, and refined and saleable output up 5% to 3.56 Moz. Managed operations made 2.75 Moz, joint ventures 526,000 oz, and third-party receipts 222,000 oz. Headline earnings rose thirty-one-fold to R22.9 billion, and total dividends for the year were 1,855 cents per share (Implats results, 3 September 2026).
Pros: broad asset base across South Africa, Zimbabwe and Canada, with a net cash position of R22.0 billion at year end. Cons: unit cost per 6E ounce rose 8% to R24,249, and earnings depend heavily on PGM prices and the rand.
2. Valterra Platinum
Best for: investors who want a pure PGM producer with a mix of own mines and purchased concentrate. In the second quarter of 2026, Valterra’s metal-in-concentrate output was 775,400 oz, own-mined output rose 13% to 525,700 oz, and refined output was 963,500 oz. Guidance for 2026 stays at 3.0 to 3.4 Moz, but the company recorded two work-related deaths in the quarter (Valterra Q2 2026 production report).
Pros: a recovery at Amandelbult after the 2025 flooding, and stated all-in sustaining cost guidance of about US$1,050 per 3E ounce. Cons: production from purchased concentrate fell 18% in the quarter, and the company said it is monitoring possible cost inflation from the Middle East conflict. For more on how the metal gets from mine to market, see our guide to platinum mining companies in South Africa.
3. Northam Platinum
Best for: those who want a smaller, South Africa-focused producer. For the year to 30 June 2026, Northam reported record own-operations refined output of 938,754 oz 4E and record purchases from third parties of 158,138 oz 4E, with total 4E metal sold of 1,087,327 oz (Northam JSE announcement, 13 July 2026). It also sold a record 1,690,495 tonnes of chrome concentrate.
Pros: output exceeded guidance on several measures, and the Eland mine is ramping up on schedule. Cons: the 4E basis understates its metal compared with the 6E basis used by Implats, and the Zondereinde mine awaits the commissioning of a new shaft.
Sibanye-Stillwater: a diversified group
Sibanye-Stillwater (JSE: SSW, NYSE: SBSW, where one ADR represents four ordinary shares) mixes PGMs, gold and recycling, so it does not fit a pure platinum ranking. For the six months to 30 June 2026 it reported revenue of R90 billion, up 64%, adjusted EBITDA of R31.8 billion, and an interim dividend of 201 cents per share. Its South African PGM segment earned an adjusted EBITDA of R19.2 billion, up 302%, as the 4E basket price rose 67% to R43,996 per ounce (Sibanye-Stillwater H1 2026 results, 1 September 2026). It is the choice for investors who want gold and platinum exposure in one company, with the extra complexity that brings.
Two developers: Platinum Group Metals and Ivanhoe Mines
Platinum Group Metals Ltd (TSX: PTM, NYSE American: PLG) owns 37.42% of the Waterberg project in the Northern Limb of the Bushveld Complex, with a further 12.97% held indirectly through Mnombo. Implats holds 14.63%. The project is in the study stage: a T-Zone mining study is under way to test a smaller first mine (Platinum Group Metals, 15 July 2026). It produces no platinum yet, so its shares move on funding and study news rather than on ounces.
Ivanhoe Mines (TSX: IVN) completed the first sale of concentrate from the Phase 1 concentrator at its Platreef project in the fourth quarter of 2025, and targets completion of the Phase 2 concentrator expansion in the fourth quarter of 2027 (Ivanhoe Mines, 12 January 2026). Check Ivanhoe’s latest quarterly report for ramp-up figures.
Platinum price, supply and ETF selling
Platinum was quoted at US$1,616.00 per ounce (bid) on 15 October 2026 at 14:50 New York time (Kitco). The US Geological Survey puts the 2025 average at US$1,200 per ounce, 25% above 2024, and estimates world mine output at 170,000 kg, with South Africa producing 120,000 kg (USGS Mineral Commodity Summaries 2026). That concentration is a risk in itself: power cuts, floods, strikes or safety stoppages in one country move the whole market.
Chart
World platinum mine output, selected countries, 2025 estimate
Thousand kilograms
The World Platinum Investment Council (WPIC) reported a 244,000 oz surplus in the second quarter of 2026, a first-half surplus of 548,000 oz, and a forecast second-half deficit of 283,000 oz. ETF holdings fell by 234,000 oz in the second quarter, and the council cut its 2026 investment-demand forecast by 601,000 oz, turning its full-year view from a 297,000 oz deficit to a 265,000 oz surplus (Miningmx, citing the WPIC Platinum Quarterly for the second quarter of 2026). The same article notes that the WPIC puts platinum’s beta to gold, a measure of how strongly it follows gold’s moves, at about 1.3, so platinum can gain more than gold on the way up and fall more on the way down.
These figures show that platinum is not in deficit every quarter. Producers’ profits rose sharply in 2026 because prices rose, not because they dug much more metal. Implats’ mined output was stable, yet its headline earnings rose thirty-one-fold.
Platinum fund or platinum miners
A physical platinum fund such as abrdn Physical Platinum Shares (PPLT) holds metal and follows the platinum price with no mine risk, but it also pays no dividend and carries a fee. Check the issuer’s page for the current fee. A platinum miner adds operating use: the same price move changes profit by more because costs are mostly fixed. Implats’ stock-adjusted unit cost of R24,249 per 6E ounce against a received price of R38,116 per ounce shows a wide gap now, but that gap can narrow quickly if prices drop.
The step-by-step process behind that cost base, from mining to refined metal, is in our guide to the steps of platinum mining.
Risks to check before you invest
- Premium or discount to NAV. An ETF’s market price can sit above or below the value of its holdings. IAU traded at a 0.29% premium on 14 October 2026. The US Securities and Exchange Commission explains premiums, discounts and bid-ask spreads in its investor bulletin on ETFs.
- Fee drag. The fee is taken from the gold in the fund, so the metal behind each share shrinks slowly.
- Price risk. IAU’s year-to-date NAV return was -5.27% on 14 October 2026. Gold fell from a first-quarter average of US$4,872.9 to US$4,506.3 in the second quarter (WGC).
- Concentration. South Africa produced about 70% of the world’s platinum in 2025 (120,000 kg of 170,000 kg, USGS).
- Safety and labour. Valterra reported two deaths in a single quarter. Mine stoppages cut output.
- Taxes and rules. Tax treatment of metal funds differs by country and account type. Ask a licensed adviser.
This page gives no price targets and no recommendation to buy or sell. Fund fees, assets and company results change, so confirm each figure on the issuer’s or company’s own page before you act.
How satellite screening fits metals research
ETFs and listed miners reflect what is already known. Before a deposit becomes a reported ounce, someone has to find it. Farmonaut’s satellite analysis screens a licence area from space for mineral signatures and returns exploration targets, which sit ahead of any resource estimate. Investors who follow junior explorers can use that kind of screening to ask better questions about a company’s ground. See the satellite mineral detection page for what is covered, or send a project description through the mining query form.
▶ Explains what satellites can and cannot see when screening ground for gold. · 2:00
For a closer look at a related question, see our guide: How to Buy Silver Stocks: 6 Steps With Costs.
If this topic matters to you, read ASX Copper ETFs Compared: Fees, Holdings and Size next.
Frequently asked questions
Which gold ETF has the lowest fee?
Of the four physical gold funds compared here, SPDR Gold MiniShares (GLDM) has the lowest at 0.10%, against 0.17% for SGOL, 0.25% for IAU and 0.40% for GLD (issuer pages and SEC filings, October 2026). Funds not ranked here may charge less or more.
What is the difference between GLD and IAU?
Both hold physical gold and track the LBMA Gold Price. GLD charges 0.40% and is larger, at US$138.6 billion in assets. IAU charges 0.25% and held US$60.9 billion with 463.05 tonnes of gold on 14 October 2026.
Is GLDM better than GLD?
GLDM has the lower fee and GLD has more assets and deeper trading. Neither is better for every investor. A long-term holder usually weighs the fee more, and a frequent trader weighs the market depth more.
Do gold ETFs hold real gold?
Physical gold funds such as GLD, GLDM and IAU hold gold bars through custodians and publish their gold holdings. IAU, for example, reported 463.05 tonnes in trust on 14 October 2026. Funds that hold futures or mining shares are different products.
Why did gold ETFs see outflows in the second quarter and record inflows in the third?
The WGC recorded outflows of 44.8 tonnes in the second quarter as gold weakened and rate expectations rose, then a record US$31 billion of inflows in the third quarter, led by Europe and North America.
Should I choose a gold ETF or a gold miners fund?
A bullion fund tracks the metal. A miners fund adds company risks and costs and usually has a higher fee. The right mix depends on your goals and risk tolerance, so ask a licensed adviser.
Which companies are the largest platinum producers?
Among listed companies that report comparable annual figures, Impala Platinum led with 3.56 Moz of refined 6E metal in the year to June 2026, and Valterra Platinum guides to 3.0 to 3.4 Moz for 2026. Northam refined 938,754 oz 4E from its own operations. Sibanye-Stillwater also produces large PGM volumes alongside gold.
Are Anglo American Platinum and Valterra Platinum the same company?
Yes. Anglo American Platinum was renamed Valterra Platinum when Anglo American demerged its majority stake on 31 May 2025, and Valterra added a London listing on 2 June 2025 to its JSE listing.
Is there an ETF for platinum?
Yes. abrdn Physical Platinum Shares (PPLT) holds physical platinum. The WPIC reported that platinum ETF holdings fell 234,000 oz in the second quarter of 2026. Check the issuer’s page for the fee and holdings.
Why did platinum miners’ profits jump when output barely changed?
Because prices rose. Implats’ 6E output was stable at 3.50 Moz, yet its received revenue per 6E ounce rose 51% in rand to R38,116 and headline earnings rose thirty-one-fold, and Sibanye-Stillwater’s South African PGM earnings rose on a 67% higher basket price.
This page is for information only. It is not investment advice. It gives no price targets and does not consider your goals, tax or risk tolerance. Fund fees, assets and company results change, so check each issuer’s own page and speak to a licensed adviser before you invest.
Farmonaut mining
See how satellites screen ground for minerals
Investors can see how satellite data screens a licence area for minerals as an exploration target, ahead of a resource estimate.

Mining Pro sample view, synthetic data
Keep reading
Sources
- State Street, SPDR Gold Shares (GLD) fund page: ssga.com
- State Street, SPDR Gold MiniShares (GLDM) fund page: ssga.com
- iShares, iShares Gold Trust (IAU) fund page: ishares.com
- World Gold Council, Gold Demand Trends Q2 2026: gold.org
- World Gold Council, Gold ETF Flows September 2026: gold.org
- Kitco, gold price chart (15 October 2026): kitco.com
- Kitco, platinum price chart (15 October 2026): kitco.com
- USGS, Mineral Commodity Summaries 2026: Platinum-group metals: pubs.usgs.gov
- Impala Platinum, results for the year ended 30 June 2026: implats.co.za
- Valterra Platinum, production report for Q2 2026: valterraplatinum.com
- Northam Platinum, voluntary production update (JSE SENS, 13 July 2026): sharedata.co.za
- Miningmx, platinum deficit beckons (WPIC Platinum Quarterly, Q2 2026): miningmx.com
- Platinum Group Metals Ltd, Q3 fiscal 2026 results: newsfilecorp.com
- Ivanhoe Mines, Platreef update (12 January 2026): newsfilecorp.com
- US SEC Investor.gov, Investor Bulletin: Exchange-Traded Funds: investor.gov
- VanEck ETF Trust, Gold Miners ETF summary prospectus (1 May 2026, SEC): sec.gov
- abrdn Gold ETF Trust, annual report on Form 10-K (SEC): sec.gov
- Sibanye-Stillwater, H1 2026 results (Form 6-K, SEC): sec.gov
Discussion
Questions, corrections or field experience? Share them below. First-time comments are reviewed before they appear, and your email is never published.
No comments yet. Be the first to add a question or your experience.

 Klusetic Mining Investments
 Mine4Africa
 Lithspo Minerals Limited
 Tintina Mining Group
 Dalgety Minerals Pty Ltd
 Vortex Minerals Pty Ltd
 Faith At Work (Pty) Ltd
 Geotech Mining Solutions plc
 Vulcan International Limited
 Kidepo Associates
 GKY Mining
 Alkimy SARL
 Double A Trading
 GemSprout Metals Limited
 Qader Group
 Ileys General Trading
 SG Gold Mining LLC
 VRV Global Pte Ltd
 Omsri International FZE
 G.I.T.T.
 Jaunita Erss Ltd
 Almosi SARL
 SRK Consulting
 Berks Gold Limited
 Mwerezi Minerals Company Limited











