

Rare earths · US map and project guide
Rare Earth Minerals in USA Map: Mines, Data and Status
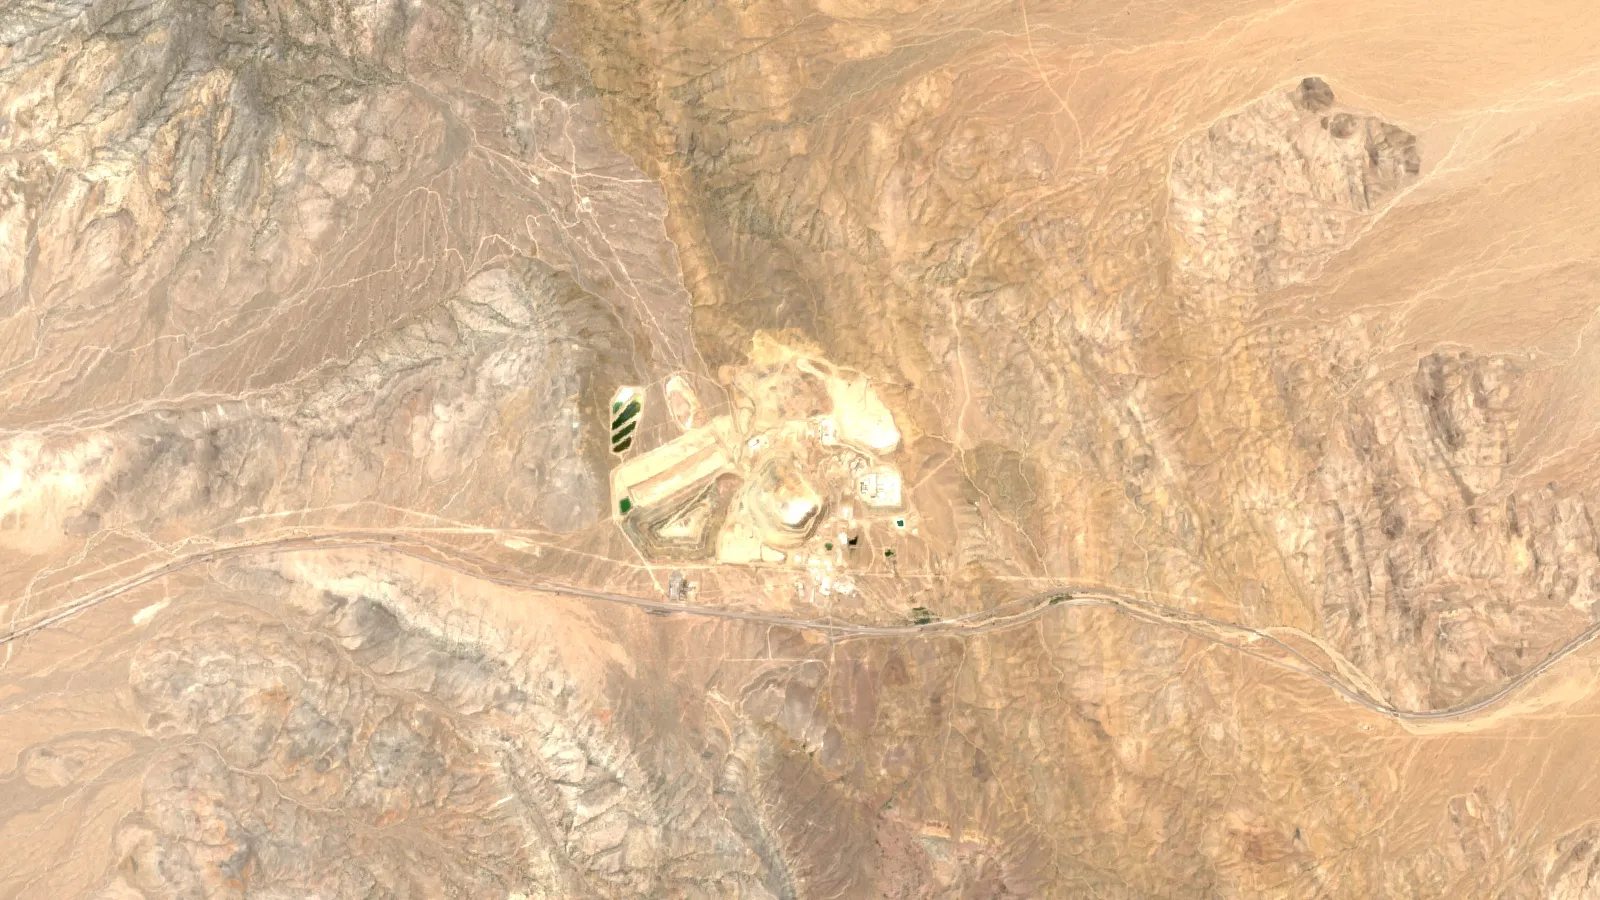
The US mined an estimated 51,000 tons of rare earth oxide in 2025, almost all at Mountain Pass, California (USGS, 2026). This page maps US rare earth deposits by state, shows each project’s stage, and lists where to find mine location data.
Key takeaways
- The US mined an estimated 51,000 tons of rare earth oxide in 2025, second to China’s 270,000 tons (USGS, 2026).
- Mountain Pass reports 1.96 million short tons of REO reserves at 5.89% ore grade and made 50,692 metric tons of REO in concentrate in 2025 (MP Materials, 2026).
- Bear Lodge, Wyoming joined the FAST-41 permitting list in March 2026. Bokan-Dotson Ridge, Alaska reported 24,371 tonnes of measured and indicated contained TREO in April 2026.
- Net import reliance for rare earth compounds and metals was an estimated 67% in 2025, and 100% for heavy rare earths (USGS, 2026).
- For project data and locations, start with USGS report 2010-5220 and MRDS, then check SEC, SEDAR+ or ASX filings for current status.
In this article
- Overview of US Rare Earth Minerals (REMs): National Significance in 2025–2026
- 2025–2026 Strategic Mining Trends & Industry Revival: The Rise of Domestic Producers
- Rare Earth Minerals in USA Map: Geographic Hotspots & Key Deposits
- Key Rare Earth Mineral Deposits and Strategic Insights in the USA (2025-2026)
- Technological Infrastructure & Domestic Processing: Building a Sustainable Future
- Supply Chain Strategies & National Security: The Defense Dimension
- Mining Intelligence for the Future: Farmonaut’s Satellite-Powered Mineral Detection
- Emerging Opportunities, Current Challenges, and the Path Forward
- FAQ: US Rare Earth Minerals Map
- Conclusion: Strategic Leadership in Critical Minerals and Beyond
Overview of US Rare Earth Minerals (REMs): National Significance in 2025–2026
The United States is at a turning point regarding rare earth minerals (REMs)—a group of 17 chemically similar elements that are essential for the supply of advanced manufacturing, defense technologies, and the next generation of infrastructure and sustainable energy systems. In 2026, the strategic management and development of these critical mineral resources have shifted from being a long-term aspiration to an urgent national priority underscoring both economic security and technological leadership for the country.
Chart
Rare earth mine output, selected producers, 2025 estimate
Tons of rare earth oxide equivalent, selected countries
Quick answer. The United States mined an estimated 51,000 tons of rare earth oxide in mineral concentrates in 2025, worth about US$240 million. Bastnaesite (a rare earth carbonate mineral) from Mountain Pass, California, made up almost all of it, and monazite (a rare earth phosphate mineral) from heavy-mineral sands in the southeastern states added a smaller stream (USGS Mineral Commodity Summaries, 2026). That is second place behind China at 270,000 tons. USGS puts US reserves, the part that is economic to mine today, at 1.9 million tons of rare earth oxide, against 44 million tons for China.
On counting: USGS defines the rare earth elements as the 15 lanthanides plus yttrium (USGS SIR 2010-5220). Adding scandium gives the 17 elements often quoted. The map and tables below show where the deposits sit and what stage each project has reached.
Rare earth minerals—despite the misleading “rare” label—are relatively abundant globally, including across the USA. Yet, most REMs are seldom found in economically extractable concentrations. Their strategic importance lies in producing permanent magnets for electric vehicles (EVs), wind turbines, consumer electronics, modern batteries, and core defense systems.
2025–2026 Strategic Mining Trends & Industry Revival: The Rise of Domestic Producers
The early 2020s saw the USA address the vulnerabilities of an overreliance on foreign supply chains—especially China, which accounted for the vast majority of global rare earth production over recent decades. The shift has led to the strategic revival of domestic mining and processing capacity, with MP Materials and other developers restoring America’s mineral production capabilities.
Chart
US rare earth concentrate output, 2021 to 2025
Tons of rare earth oxide in mineral concentrates
Federal initiatives in 2025 have focused on revitalizing existing mines like the Mountain Pass mine in California—historically the nation’s REM flagship—and supporting the development of new extraction sites in Alaska, Wyoming, and the Appalachian region.
- ✔ Advanced Technologies: AI, satellite mapping, and remote sensing accelerate resource assessment.
- 📊 Federal Projects: New initiatives increase domestic supply and invest in infrastructure.
- ⚠ Risk: Environmental management and community acceptance are critical challenges.
- ✔ Economic Diversification: Rare earth mining supports job creation in rural mining communities.
- 💡 Innovation: Integration of satellite-based mineral detection enhances early-stage exploration efficiency.
Read more about how satellites are changing mineral detection on our
Satellite-Based Mineral Detection
product page.

▶ Farmonaut explainer: what AI in mineral exploration does, where it fails and how to check any claim. · 4:37
Rare Earth Minerals in USA Map: Geographic Hotspots & Key Deposits
The rare earth minerals in USA map for 2025–2026 is a showcase of critical deposits and emerging sites that form the backbone of the country’s rare earth infrastructure. Several zones stand out for their estimated reserves, prospective mineral types, and their roles in national supply chains:
- Mountain Pass, California: The largest US producer, historically significant, yielding key REMs like neodymium, praseodymium, cerium, and lanthanum.
- Bokan Mountain, Alaska: Notable for rich heavy rare earths (yttrium, dysprosium), important for advanced electronics and defense.
- Bear Lodge, Wyoming: In federal permitting; the Bull Hill resource averages 4.08% TREO (measured and indicated, company, 2024).
- Appalachian Basin: Unique potential from mining residues, with REMs linked to coal and phosphate extraction.
- Other Strategic Deposits: Texas, Idaho, and ongoing discoveries across Western and Southeastern US states, driving diversification and resilience.
See a sample 3D Prospectivity Report.
Rare earth deposits map by state: projects and status
The list below covers the rare earth deposits and projects that matter most for a rare earth mines map of the United States. Stage and figures are as last reported by each operator or agency.
| State | Project and operator | Stage and latest figures |
|---|---|---|
| California | Mountain Pass (MP Materials) | Operating. Reserves of 1.96 million short tons of rare earth oxide (REO) in 28.96 million short tons of ore at 5.89% (SRK Consulting, December 2025); 50,692 metric tons of REO in concentrate made in 2025 (10-K, results release). |
| Wyoming | Bear Lodge, Bull Hill deposit (Rare Element Resources) | In federal permitting; added to the FAST-41 fast-track list in March 2026 (Permitting Council). Company resource: 6.02 million tonnes measured and indicated at 4.08% total rare earth oxide (TREO), about 245,500 tonnes contained, plus 1.90 million tonnes inferred at 3.61% (company release, March 2024). |
| Wyoming | Brook Mine (Ramaco Resources) | Exploration-stage rare earth and critical mineral property near Sheridan; the resources are inferred, the lowest confidence class (Ramaco 10-Q, June 2026). |
| Wyoming | Halleck Creek (American Rare Earths, ASX-listed) | Development stage per the operator. JORC resource of 2.63 billion tonnes at 3,292 ppm TREO (1,479 million tonnes measured and indicated, 1,147 million inferred); a 2025 scoping study covers the first phase, the Cowboy State Mine (operator project page). |
| Alaska | Bokan-Dotson Ridge (Ucore Rare Metals) | Resource update of April 2026: 4,826 tonnes measured, 19,545 tonnes indicated and 5,568 tonnes inferred contained TREO, with heavy rare earths at roughly 37% to 40% of TREO (Ucore release). |
| Texas | Round Top (USA Rare Earth, Nasdaq: USAR) | Exploration stage, construction not begun. In March 2026 the company scheduled a preliminary feasibility study for the end of Q3 2026 and a definitive feasibility study for Q1 2027, and targeted commercial production for late 2028; agreement to buy Texas Mineral Resources signed in March 2026 (SEC filing, March 2026). |
| Missouri | Pea Ridge (Caldera Holding, private) | Pre-feasibility stage. The study counts about 24 million tonnes of surface tailings; an underground restart is a later phase and needs a full feasibility study and financing (Rare Earth Exchanges, June 2026). |
| Southeastern states | Monazite in heavy-mineral sands | Monazite concentrate from heavy-mineral sands is produced in the southeastern United States, a smaller stream than Mountain Pass (USGS, 2026). |
| Colorado, Idaho and Montana, Illinois, Nebraska, New Mexico, New York | Iron Hill, Lemhi Pass, Hicks Dome, Elk Creek, Gallinas Mountains, Mineville and others | Described as principal US rare earth deposits in the USGS 2010 summary. Use that report for geology; operator reports give current status. |
For a longer list of owners and project status, see our guide to US rare earth deposits, projects and owners. Note that rare earths are not precious metals. If you want one US map with rare earths next to gold, silver or copper, filter the USGS database below by commodity.
Where to find rare earth project data and mine locations
Five public sources cover most of what a claim owner, consultant or investor needs:
- USGS Scientific Investigations Report 2010-5220. It summarizes the principal US deposits state by state and includes an index map in PDF and TIF form (report page). The geology is sound, but the status text dates from 2010.
- USGS Mineral Resources Data System (MRDS). Reports on deposits worldwide, with name, location, commodity, reserves and references, a map viewer and downloads. WMS and WFS services load it into GIS software. USGS stopped systematic updates in 2011, and the Alaska Resource Data File is the fuller record for Alaska (MRDS).
- USGS Mineral Commodity Summaries. Yearly production and reserves by country, revised each February (rare earths chapter).
- Company technical reports and filings. US-listed firms file reserve and resource reports under SEC Regulation S-K 1300, as Rare Element Resources did for Bull Hill. Canadian-listed firms use NI 43-101, and Ucore’s 2026 report follows both. Australian-listed firms announce through the ASX.
- Federal Permitting Dashboard. Projects under FAST-41, such as Bear Lodge, show their review timetable there (Permitting Council notice).
Satellite imagery adds a screening layer. Before you stake or buy ground near a known carbonatite or alkaline intrusion, imagery can map rock types, alteration and structure to rank where to sample first. It does not detect rare earth elements directly, so rock sampling and assays still set the grade. Farmonaut delivers this kind of screening as exploration targets, ahead of a resource estimate.
Claim, licence and land-access rules differ by state and agency. Check with the BLM or a qualified professional, and plan field safety before any site visit.
Key Rare Earth Mineral Deposits and Strategic Insights in the USA (2025-2026)
| Deposit/Location | State | Reserves or resources (latest report) | Main Minerals | Infrastructure Status (2025) | Major Operators | Strategic Importance |
|---|---|---|---|---|---|---|
| Mountain Pass | California | 1.96 million short tons REO reserves (Dec 2025) | Neodymium, Praseodymium, Cerium, Lanthanum | Full-scale production; on-site processing renewal | MP Materials | Defense, Electronics, EVs, Renewable Energy |
| Bokan Mountain | Alaska | Resource: 24,371 t measured and indicated TREO plus 5,568 t inferred (Apr 2026) | Yttrium, Dysprosium, Terbium, Heavy REMs | Resource update April 2026; processing plant planned in Louisiana | Ucore Rare Metals | Advanced Electronics, Magnets, Defense |
| Bear Lodge | Wyoming | Resource: 6.02 Mt measured and indicated at 4.08% TREO (company, 2024) | Light to Medium REMs | Federal permitting under FAST-41 (March 2026) | Rare Element Resources | Defense, EV Components |
| Pea Ridge Mine | Missouri | About 24 Mt of surface tailings in the pre-feasibility study | Heavy REMs, Iron | Pre-feasibility stage; underground restart is a later phase | Caldera Holding LLC | Multi-mineral (industrial/defense) |
| Appalachian Basin (multiple) | Multiple | ~Varies/Unknown | Mixed REMs (coal residue-based) | Pilot extraction projects ongoing | DOE partnerships, private firms | Critical for diversification of supply |
Reserves, resources and what the table numbers mean
Only Mountain Pass reports proven and probable reserves in the table above. The other projects report resources, which have not been shown to be economic. Within resources, measured and indicated tonnes carry more confidence than inferred ones. USGS puts measured and indicated US rare earth resources at 3.6 million tons, compared with reserves of 1.9 million tons (USGS, 2026).
Check three things before you compare two projects: the unit (short tons or tonnes), the basis (reserve or resource) and the grade measure (TREO, or only the magnet metals neodymium and praseodymium). A high TREO grade can hide a heavy share of cerium and lanthanum, which sell for about US$1 to US$2 per kg as oxides, against US$69 per kg for NdPr oxide (USGS, 2025 averages). The calculator below turns a tonnage and grade into contained and recoverable oxide.
Calculator
How much rare earth oxide is in a resource?
Enter a tonnage and grade from a technical report, then your own recovery, NdPr share and price.
- Recoverable TREO: 11,727 t
- NdPr oxide in the recoverable TREO: 1,994 t
- Gross NdPr oxide value in US$ at your price: $137,556,584
Example values only, not a benchmark. Defaults use the Bokan-Dotson Ridge indicated tonnage and grade (Ucore, April 2026); the NdPr share of 17% comes from Ucore’s indicated oxide grades (Nd2O3 0.080% plus Pr2O3 0.02% of 0.58% TREO) and recovery is an example, and the price is the USGS 2025 average for NdPr oxide (US$69 per kg, estimate). Price is an input: use today’s price. Processing costs, payability and royalties are not included.
Technological Infrastructure & Domestic Processing: Building a Sustainable Future
Increased rare earth mineral production is reshaping American infrastructure. The rise of electric vehicles, wind energy farms, and the modernization of defense systems is driving urgent demand for a reliable, domestic supply of REMs.
Examples of Infrastructure Investments (2025–2026):
- Separation capacity at Mountain Pass (CA), where MP Materials made 2,599 tons of NdPr oxide in 2025, and a planned Ucore processing plant in Louisiana
- Federal permitting support, such as the FAST-41 listing of Bear Lodge in Wyoming in March 2026
- R&D programs targeting more energy-efficient, sustainable extraction and processing technologies
- Strategic investments in remediation and environmental management to ensure long-term viability
▶ Farmonaut explainer: remote sensing for mining in three minutes, and why agreement between instruments matters. · 2:01
Supply Chain Strategies & National Security: The Defense Dimension
The US Department of Defense (DoD) places a premium on securing domestic rare earth mineral supply chains due to their role in core defense systems. In the post-2025 defense strategy, the focus is on reducing dependence on foreign elements to mitigate the risks of supply disruptions during periods of international tension.
Chart
NdPr oxide price, 2021 to 2025
Average US$ per kg, 99% minimum purity
Strategic Focus Areas (2025–2026):
- ✔ Critical Defense Components: REMs are embedded in precision munitions, radar systems, advanced guidance devices, and secure communication electronics.
- ⚠ Vulnerability: Any bottleneck in import-dependent supply chains (especially from China) creates risk for US national security.
- ✔ Federal Oversight: Increased collaboration with domestic mining operators to scale production and introduce advanced monitoring across key sites.
- ✔ Stockpiling & Resilience: Strategic stockpiles and multi-source strategies are being built for defense stability.
Rare earth supply chain map: mine, separation, metal and magnet
| Stage | US position and latest figures |
|---|---|
| Mining | About 51,000 tons of REO in concentrates in 2025, almost all from Mountain Pass (USGS, 2026). |
| Separation to oxide | MP Materials made 2,599 metric tons of NdPr oxide in 2025, up 101% on 2024 (MP Materials, February 2026). |
| Metal | MP Materials commissioned NdPr metal electrowinning in 2024 and 2025 (10-K). |
| Magnets | MP Materials made its first magnets on commercial equipment at its Independence plant and plans a 10X plant in Northlake, Texas with a US$200 million incentive package. USA Rare Earth commissioned Phase 1a of its Stillwater, Oklahoma magnet plant in March 2026 and expects 600 metric tons a year of run-rate magnet capacity by the end of Q4 2026 (SEC filing). |
The gaps are in the middle of the chain. USGS estimates net import reliance at 67% of apparent consumption of rare earth compounds and metals in 2025 and 100% for heavy rare earths (rare earths, heavy rare earths). China added export controls on samarium, gadolinium, terbium, dysprosium, lutetium, scandium and yttrium in April 2025 and suspended a wider October expansion for one year in November. A price floor of US$110 per kg for NdPr products at Mountain Pass has applied since 1 October 2025 under MP Materials’ agreement with the Department of War, compared with a 2025 average market price of US$69 per kg (MP Materials).
Mining Intelligence for the Future: Farmonaut’s Satellite-Powered Mineral Detection
Modern mineral exploration is being rapidly transformed through advanced satellite-based intelligence. Traditional methods—like field surveys and drilling—are slow, costly, and often environmentally disruptive. Instead, new solutions use space-borne observation, AI-driven analytics, and multispectral/hyperspectral imaging.
At Farmonaut, we help mining companies and investors to screen ground for rare earth exploration targets swiftly and sustainably. Our
Satellite-Based Mineral Detection
platform enables targeted exploration across the USA and globally. Using earth observation technology, we:
- Map host rocks, alteration zones and structures linked to carbonatites and alkaline intrusions
- Map mineralized veins & structural features over vast areas
- Provide quantifiable prospectivity heatmaps, optimal drilling recommendations, and georeferenced intelligence
- Deliver all outputs digitally, reducing time/cost and environmental disturbance compared to field-only approaches
- ✔ Coverage: 100,000+ hectares scanned across 20+ minerals in 25+ countries.
- ✔ Speed: Reduce exploration workflows from months to days.
- 📊 Data Insight: Spectral signatures map host rocks and alteration halos that guide where to sample—no ground disturbance required at this phase.
- ⚠ Limitation: While satellite data narrows targets, on-ground validation is still essential for reserve certification.
- 💡 ESG Impact: Satellite-mounted detection avoids unnecessary disruption and waste. Supports next-gen responsible mining.
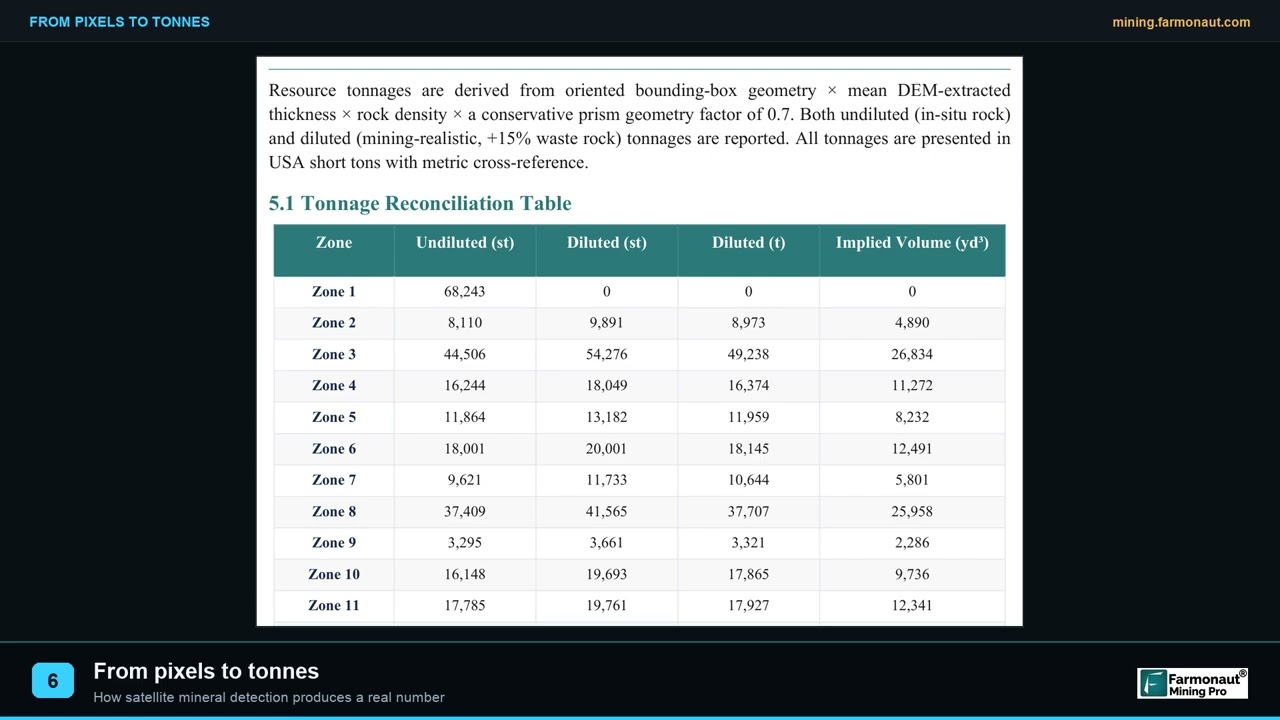
▶ Farmonaut explainer: how a satellite picture becomes a tonnage and grade, and which inputs are measured versus assumed. · 2:54
Emerging Opportunities, Current Challenges, and the Path Forward
- ✔ Strategic Autonomy: domestic operators such as MP Materials are scaling a tech-driven supply resurgence.
- 📊 Global Positioning: The United States ranked second in 2025 mine output, at an estimated 51,000 tons of rare earth oxide against China’s 270,000 tons (USGS, 2026).
- ⚠ Risk: Ongoing permitting and regulatory timelines can still slow projects and limit near-term supply.
- ✔ Policy Support: Increased federal infrastructure and R&D incentives are helping mining and processing expansion thrive.
Visual List — 🔎 Main Drivers for Growth+)
- Electrification of transport & the rise of electric vehicles (EVs)
- Renewable energy capacity expansion (wind, solar, grid storage)
- Manufacturing “reshoring” for advanced electronics & magnets
- Escalating defense technology requirements
- ESG-driven sustainable mining initiatives
Visual List — 🛑 Potential Bottlenecks to Watch:
- Processing/refinery capacity lagging behind mining growth
- Community/environmental opposition and land-use disputes
- Skilled workforce shortages in advanced manufacturing/mining tech
- Capital flow and project financing uncertainty
- Ongoing global competition for strategic elements
Ready to evaluate your exploration zone or rare earth deposit? Get a custom quote with Farmonaut’s satellite mineral intelligence by submitting your project details here: Get Quote.
Questions or want to discuss your geospatial analysis needs? Reach us any time at Contact Us.
For all minerals, not just rare earths, see the US mining map of active mines by state.
For Wyoming’s projects in detail, see Wyoming rare earth deposits compared.
FAQ: US Rare Earth Minerals Map
What are rare earth minerals and why are they strategically important to the United States?
Rare earth minerals refer to a group of 17 chemically similar elements essential for producing advanced electronics, permanent magnets, batteries, and defense systems. Their strategic importance in the USA lies in ensuring economic security, technological leadership, and defense independence—key drivers for future infrastructure and green energy.
Where are the main rare earth mineral deposits in the United States?
Significant rare earth mineral deposits in the USA include Mountain Pass (California), Bokan Mountain (Alaska), Bear Lodge (Wyoming), the Appalachian Basin, and Pea Ridge Mine (Missouri). These are catalogued in the “rare earth minerals in USA map” and underpin the 2025–2026 infrastructure strategy.
How are US rare earth mineral companies like MP Materials positioned?
Companies such as MP Materials and USA Rare Earth are central to the US supply chain resurgence. They are focusing on revitalizing existing mines and developing new extraction and domestic processing capacity, with support from federal infrastructure investments.
What challenges exist for US rare earth mineral production and processing?
Challenges include environmental regulatory hurdles, permitting delays, community and land-use disputes, and lagging processing/refinery infrastructure compared to mining activity. Policy support and technological advances (such as satellite-based detection) are helping address these challenges through 2026.
How does Farmonaut help the US mining sector with rare earth mineral intelligence?
Farmonaut offers satellite-based mineral detection and 3D prospectivity mapping, accelerating early-stage rare earth exploration. Our platform provides rapid, ESG-friendly, and data-driven insights for site selection and investment, helping companies and investors optimize exploration budgets and timelines. See our product and reporting capabilities: Satellite Based Mineral Detection.
Where can I find rare earth project data and mine locations?
Start with the USGS 2010 summary of principal US deposits, which has an index map, and the MRDS database, which you can load into GIS. For current status, use each operator’s SEC, SEDAR+ or ASX filings and the Federal Permitting Dashboard. The data-sources section above lists all five.
How many rare earth mines are in the US?
USGS names one mine that produced rare earths as a primary product in 2025: Mountain Pass, California, where bastnaesite is mined. It also reports monazite produced from heavy-mineral sands in the southeastern states (USGS, 2026). The other projects in the state table are in permitting, study or exploration stages.
Where are rare earth minerals found in Wyoming?
Three projects are best documented. Bear Lodge (Bull Hill) is in northeastern Wyoming and in federal permitting (Permitting Council). Ramaco’s Brook Mine property is near Sheridan (10-Q). American Rare Earths reports the Halleck Creek project.
Are there rare earth deposits in Alaska?
Yes. Ucore Rare Metals holds the Bokan-Dotson Ridge project on Prince of Wales Island, and its April 2026 update reported 24,371 tonnes of measured and indicated contained TREO (Ucore). Its heavy rare earth share makes it a heavy-element target.
Are rare earths precious metals?
No. The rare earth elements are 15 lanthanides plus yttrium, used mainly in magnets, catalysts and electronics, and they are not precious metals such as gold or platinum. To view them together on one US map, filter MRDS by commodity.
What does REM mining mean?
In this article REM is shorthand for minerals rich in rare earths. Geologists and filings write REE for the elements, REO for oxides and TREO for total rare earth oxides. Searching those terms returns the technical reports.
Can satellites find rare earth deposits?
Satellites cannot see rare earth elements directly. They map the host rocks, alteration and structures that guide where to sample, and the result is a ranked set of exploration targets. Sampling and assays confirm grade before any resource estimate.
Conclusion: Strategic Leadership in Critical Minerals and Beyond
In 2026, rare earth minerals continue to be at the heart of US economic development, defense security, and technological innovation. The United States ranks second in mine output and is building separation and magnet capacity, but China still mined more than five times as much in 2025 (USGS, 2026).
The deliberate mapping, extraction, and processing of US rare earths—along with strong national policy support—form the foundation of a secure, resilient, and sustainable future for American industry and national defense.
Farmonaut is proud to be part of this transformation. Our satellite-powered analytics deliver timely mineral intelligence and foster more responsible, efficient mining exploration in a resource-constrained world.
Ready to accelerate your rare earth mineral exploration?
Request a Farmonaut premium mineral intelligence report.
Move from initial discovery to investment-ready evaluation—faster and smarter than ever.
Explore More or Connect With Us
For more in-depth insights, 3D mineral modeling examples, or to discuss your mining intelligence needs, connect with our experts through our
Contact Us
page.
This page is for information only. It is not investment advice. Company names and tickers are facts, not recommendations. Resource and reserve figures come from each operator’s latest report and can change. Satellite results are exploration targets that sit ahead of a resource estimate. Claim, licence and land-access rules differ by state and agency; this page is not legal advice.
Farmonaut mining
Map your mining site from space
Request a quote to screen a licence or claim area with satellite data and get ranked exploration targets, ahead of a resource estimate.

Mining Pro sample view, synthetic data
Keep reading
Sources
- USGS, Mineral Commodity Summaries 2026: Rare Earths: pubs.usgs.gov
- USGS, Mineral Commodity Summaries 2026: Rare Earths (Heavy): pubs.usgs.gov
- USGS, Scientific Investigations Report 2010-5220: principal rare earth deposits of the United States: pubs.usgs.gov
- USGS, Mineral Resources Data System (MRDS): mrdata.usgs.gov
- MP Materials, Form 10-K for 2025: s25.q4cdn.com
- MP Materials, fourth quarter and full year 2025 results (26 Feb 2026): mpmaterials.com
- Ucore Rare Metals, updated mineral resource estimate for Bokan-Dotson Ridge (April 2026): newsfilecorp.com
- Permitting Council, Bear Lodge Rare Earth Project gains FAST-41 coverage (20 Mar 2026): permitting.gov
- Rare Element Resources, updated Bull Hill mineral resource (4 Mar 2024): rareelementresources.com
- USA Rare Earth, fourth quarter and full year 2025 results, SEC exhibit 99.1 (30 Mar 2026): sec.gov
- Ramaco Resources, Form 10-Q for the quarter ended 30 June 2026: sec.gov
- Rare Earth Exchanges, Pea Ridge redevelopment (30 Jun 2026): rareearthexchanges.com
- American Rare Earths, Halleck Creek project page: americanree.com
Discussion
Questions, corrections or field experience? Share them below. First-time comments are reviewed before they appear, and your email is never published.
No comments yet. Be the first to add a question or your experience.

 GemSprout Metals Limited
 Qader Group
 Ileys General Trading
 SG Gold Mining LLC
 VRV Global Pte Ltd
 Omsri International FZE
 G.I.T.T.
 Jaunita Erss Ltd
 Almosi SARL
 SRK Consulting
 Berks Gold Limited
 Mwerezi Minerals Company Limited
 Mining SARL
 SenGold Invest SAS
 Sean Mining Limited
 NTS Group (Pty) Ltd
 Mine4Africa
 Lithspo Minerals Limited

 Client · Oregon, USA · Gold










