

Mining data · Source guide
World Mineral Deposits Map: MRDS, GIS Data and Sources
The USGS MRDS holds 304,632 mapped records worldwide but has had no systematic updates since 2011. See which open databases, GIS files and geology maps to use instead, with formats, record counts and the checks to run before you trust a dot.
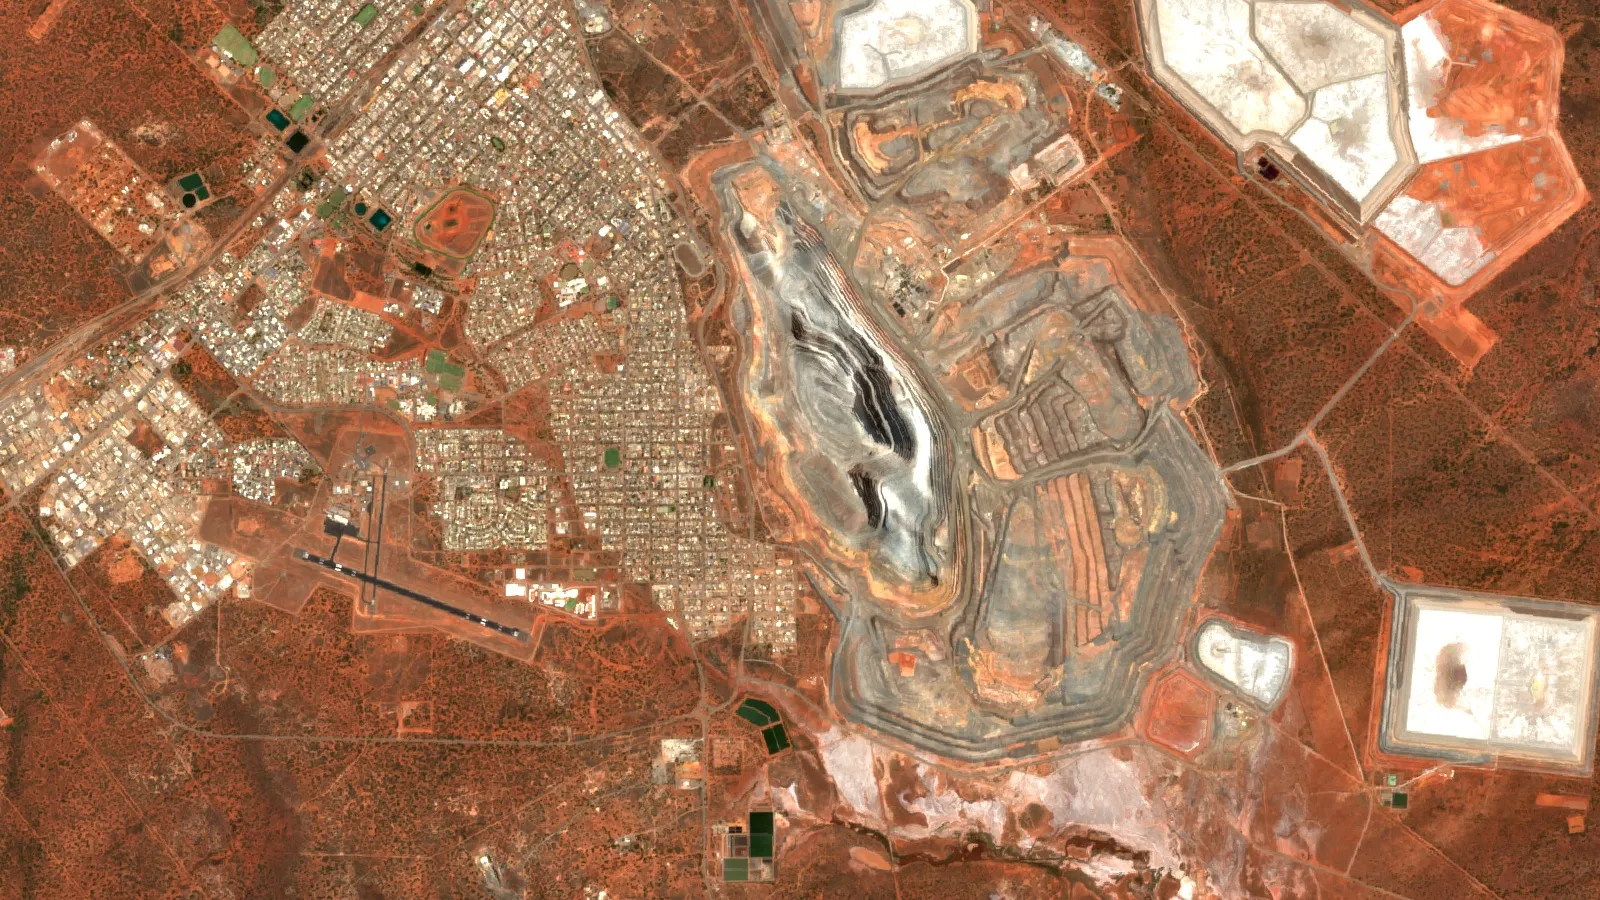
Key takeaways
- The USGS Mineral Resources Data System returned 304,632 records on 20 November 2026; 128,823 are past producers and 42,879 producers, and the USGS stopped systematic updates in 2011.
- MRDS holds 1,533 records tagged Canada, while British Columbia’s MINFILE alone lists 16,261, so a national archive is a sample, not a census.
- Current records sit in state and national sources such as MINEDEX (Western Australia), MINFILE (British Columbia), the Ontario Mineral Inventory and the Alaska Resource Data File (7,448 records).
- No open, high-detail world geology shapefile exists: the CGMW 1:35,000,000 GIS is licensed, and GLiM gives 1,235,400 rock-type polygons at about 1:3,750,000.
- A US map at 1:24,000 is accurate to about 12.2 m for well-defined points; a 1:1,000,000 source is about 508 m, so check source scale before using a point.
In this article
- Which mineral deposit database should you start with?
- USGS MRDS: what the world mineral deposits database holds
- USMIN and the USGS critical-mineral deposit data
- Global deposit layers from USGS: major deposits and critical minerals
- National and state sources that are kept current
- World geological map shapefile: what really exists
- Read a deposit record before you trust the dot
- How accurate is a mapped location?
- Satellite-mapped mining areas: the Maus global dataset
- Load the data into QGIS in six steps
- Where satellite imagery fits with these maps
- Frequently asked questions
The largest single mineral deposit map you can open today is the USGS Mineral Resources Data System (MRDS), which holds 304,632 mapped records worldwide, but it is a frozen archive and it is thin outside the United States. This guide sorts the open sources into three groups: global point databases (MRDS, USGS major deposits, critical-mineral deposits), national and state databases that are kept current (British Columbia, Ontario, Western Australia, Alaska, the UK, the EU), and geological base maps (CGMW, GLiM and the OneGeology archive). For each one you get the portal address, the file formats, the record count or date, and what to watch for before you trust a dot on the map.
Two terms first. A mineral occurrence is a place where a mineral of possible interest has been recorded; it may be a rock sample, a showing or an old pit, and it says nothing about size. A deposit is an occurrence that has been drilled or mined enough to suggest a body worth studying. Databases mix both on one map, so the status column matters more than the symbol.
Which mineral deposit database should you start with?
Start from the question, not the map. If you want a worldwide overview of known sites, use MRDS and the USGS major-deposits layer. If you work in one jurisdiction, use that jurisdiction’s own database, because it is updated and carries resource and production data that MRDS lacks. If you need rock type rather than ore, you want a geological map and not a deposit map. The table below lists what each source holds, in the formats it offers.
| Source | Coverage | Formats and access | Best used for |
|---|---|---|---|
| USGS MRDS | Worldwide; 304,632 records; no systematic updates since 2011 | CSV, shapefile, WMS, WFS, KML | First look at known sites, especially in the US |
| USGS major mineral deposits of the world | Global; 3,161 features; regional reviews published 2005 to 2009 | Shapefile (zipped CSV), KMZ, WMS, WFS | Large deposits by commodity and region |
| USGS critical-mineral deposits geodatabase | Global; 22 minerals; data as of 2017 | Geodatabase from the USGS catalog | Cobalt, lithium, rare earths, tin and similar |
| USMIN deposit database | United States; 13 critical-mineral packages and growing | Geodatabase, shapefile, CSV, KML, WMS, WFS | Reviewed US deposit records with geology fields |
| Alaska Resource Data File | Alaska; 7,448 records | Shapefile, KML, WMS, WFS | Alaska prospects and mines |
| BC MINFILE | British Columbia; more than 16,000 records | Web search, MINFILE/pc download | Canadian Cordillera occurrences |
| Ontario Mineral Inventory | Ontario; occurrences back to 1890 | KML, web viewer | Greenstone-belt gold and base metals |
| MINEDEX (Western Australia) | Western Australia; mines, deposits, resources | CSV, shapefile, geodatabase, KMZ, MapInfo TAB | Resource estimates and project status |
| EGDI and RMIS | European Union; 21 member states in part | Map viewer, data search | European occurrences and mines |
| OneGeology (initiative closed; services remain online) | Geological maps from many surveys | WMS, WFS, WCS, CSW | Rock units under your deposit points |
USGS MRDS: what the world mineral deposits database holds
MRDS is the database most people mean when they search for a mineral deposits database or “usgs mrds”. The USGS MRDS page describes it as a collection of reports on metallic and nonmetallic mineral resources throughout the world, with deposit name, location, commodity, description, geology, production, reserves, resources and references. It merges two older systems: the USGS Mineral Resources Data System and the Mineral Availability System/Mineral Industry Locator System (MAS/MILS) that started in the US Bureau of Mines.
Chart
MRDS records by development status
Number of point records, 20 November 2026
The USGS calls MRDS large, complex and somewhat problematic, and the metadata is blunt about why. The compilation was meant to cover the United States completely, and its coverage elsewhere is incomplete. Content came from reports that were available to USGS staff, so each record is current only as of its source report. Mine status, ownership, production figures and resource estimates are likely out of date (USGS MRDS metadata).
How many records, and what do they say?
We queried the USGS web feature service for MRDS on 20 November 2026. It returned 304,632 point records. The status field splits them as the chart below shows: 128,823 past producers, 67,526 occurrences, 42,879 producers, 35,587 prospects and 26,809 with an unknown status, plus 3,008 with another or blank value. The word “producer” means the site produced at the time of the source report. It does not mean a mine is open today.
The same query shows how uneven the coverage is. MRDS holds 4,038 records tagged Chile, 1,533 tagged Canada and 1,157 tagged Australia. British Columbia’s own MINFILE database lists more than 16,000 occurrences for one Canadian province, so the national archive in MRDS is a sample and not a census. For Canada and Australia use the national and provincial sources further down, or the country map pages on this site for Canada and Australia.
Record quality grades A to E
MRDS ranks records by how much they contain. According to the USGS, grade A records carry information on more aspects of the resource, grade D records hold only summary information, B and C sit between them, and E records generally lack bibliographic references. The map interface and search form rank results by this grade, so a grade A dot near your area is the first record to read in full. Records of the grade D and E type are best treated as leads that point you to a report, not as evidence.
MRDS download formats and sizes
The MRDS page offers four downloads: a single flattened CSV (23 MB), a compact shapefile (10 MB), a compact multi-table CSV set (20 MB) and the comprehensive multi-table CSV set (118 MB). The shapefile keeps only the main fields: site name, status, commodity codes and a link to the full record. The flattened CSV carries 44 commonly requested fields, with multiple values separated by semicolons. For GIS use you can also connect to the OGC services without downloading anything: WMS at https://mrdata.usgs.gov/services/mrds and WFS at https://mrdata.usgs.gov/services/wfs/mrds.
Useful MRDS fields include latitude and longitude in WGS84, the country, state and county, the development status, deposit type, the ore and gangue minerals, the host rock, and the deposit model codes. If you want to filter for a deposit style, the model field is worth learning; it records numbered deposit models, delimited by braces when a site fits more than one.
USMIN and the USGS critical-mineral deposit data
MRDS stopped systematic updates in 2011, and the USGS says it is building a replacement focused mainly on the conterminous United States. That replacement is USMIN, a developing national-scale database of the most important mines, deposits and districts. It is released commodity by commodity, so it is smaller than MRDS but each record is compiled and reviewed with geology fields. Today the USMIN page lists packages for 13 commodities: cobalt, gallium, germanium, graphite, indium, lithium, niobium, rare earth elements, rhenium, tantalum, tellurium, tin and tungsten. Each package comes as a geodatabase, shapefiles and CSV, with metadata and a data release citation. A web query on 20 November 2026 returned 550 point and 481 polygon features from the USMIN service.
One practical limit: shapefiles cap text fields at 254 characters, and the USGS notes that the rare earth shapefile truncates the remarks field in three records. If remarks matter to you, use the CSV or geodatabase.
A second USGS layer is easy to confuse with USMIN. Prospect- and mine-related features on USGS topographic maps holds symbols digitised from historical topographic maps in the western United States: prospect pits, shafts and adits, quarries, open pits, tailings and gravel pits. It is a map-symbol dataset, which makes it good for finding old workings that no report mentions. The whole set is a 253 MB shapefile download or a 142 MB file geodatabase, and there are state files in shapefile and KMZ form.
For a state-by-state view of active mines and the sources behind it, see our US mining map guide.
Global deposit layers from USGS: major deposits and critical minerals
The USGS Major mineral deposits of the world layer gives regional locations and general geology for known deposits of the major nonfuel commodities. It comes from Open-File Report 2005-1294, a set of regional reviews: the United States, Latin America and Canada, Asia and the Pacific, Europe and northern Central Asia, and Africa and the Middle East. A web query on 20 November 2026 returned 3,161 features. Downloads are a zipped shapefile with attributes as CSV text (305 KB), a KML or KMZ file for Google Earth, and WMS and WFS services. Because it covers only major deposits, it is a better first screen for a world map than 304,632 mixed-quality MRDS dots.
A third global dataset focuses on critical minerals. The USGS data release Global Distribution of Selected Mines, Deposits, and Districts of Critical Minerals is a geodatabase of point and polygon layers for 22 minerals as of 2017. It accompanies Professional Paper 1802 (Schulz and others, 2017), which discusses 23 critical minerals; selenium is left out of the geodatabase because it is mainly a by-product of other metals (data.gov catalog record, USGS Professional Paper 1802). The catalog shows the dataset last updated in September 2020, so treat the commodity status as a 2017 snapshot.
The USGS global mineral resource assessment (Scientific Investigations Report 2010-5090) adds a different kind of layer. Its chapters on porphyry copper and sediment-hosted stratabound copper map permissive tracts, which are areas where the geology allows that deposit type, next to known deposits (USGS Scientific Investigations Report 2010-5090). The USGS global map viewer lists these under “Global Cu Assessment”, plus mineral deposit type layers for volcanogenic massive sulfides, sediment-hosted zinc-lead, SedEx and MVT, nickel-chromium PGE, carbonatites, rare earth elements, nickel-cobalt laterites, phosphates, podiform chromite, sediment-hosted gold and evaporite-hosted potash (USGS MRData global map). Permissive tracts are not discoveries; they show where a model fits.
For gold and uranium specifically, see our global gold deposits map and uranium deposits map, and for rare earths the rare earth elements map.
National and state sources that are kept current
If your project sits in one jurisdiction, a state or provincial database will beat MRDS on every count: it is updated, it often has resource and production tables, and it uses local place names and tenure. These are the main ones.
Chart
Records in selected open mineral databases
Point or record counts, 20 November 2026 unless stated
British Columbia: MINFILE
The British Columbia Geological Survey says MINFILE holds geological, location and economic information on more than 16,000 metal, industrial mineral and coal mines, deposits and occurrences in the province. The search page showed 16,261 records. Status values include Showing, Prospect, Developed Prospect, Producer, Past Producer, Anomaly and Unknown, which is a useful model of how a good occurrence database separates a rock showing from a producing mine. You can download MINFILE/pc, a ZIP of about 36 MB that the province updates daily, and the page notes that MINFILE will move to a modernised system, with redirects in place.
Ontario: Ontario Mineral Inventory
The Ontario Mineral Inventory (OMI, formerly the Mineral Deposit Inventory) gives an overview of mineral occurrences in Ontario, with location, geological setting and exploration history for metallic and industrial mineral occurrences, some building stone and aggregate sites, and production and resource data where known. The catalogue lists the data as a KML file, updated monthly, with records dated from 1890 to August 2026, and the dataset page links to the Geology Ontario data hub.
Western Australia: MINEDEX and GeoVIEW.WA
The Western Australian Government describes MINEDEX as its database of mines, mineral deposits, prospects and project owners, with locations, geology, commodities, project status and ownership, mineral resource estimates, production data, environmental registrations, operators and an inventory of abandoned mine sites. It is a full-text search database that needs no login. Spatial searching is done in GeoVIEW.WA, and spatial downloads from the Data and Software Centre come as CSV, Esri shapefile, Esri file geodatabase, Google Earth KMZ and MapInfo TAB. If you only want one place to see how a state database should work, this is it.
Australia nationally: Geoscience Australia and AGSON
Geoscience Australia points users to the Australian Geological Survey Organisations Network portal (AGSON), a discovery and analysis portal for geoscience data from the federal, state and territory governments. It includes mines, deposits and mineral resources data from Geoscience Australia’s OZMIN database, along with tenement boundaries, infrastructure, geophysical and geological data (Geoscience Australia, Mineral resources and advice).
Alaska: Alaska Resource Data File
For Alaska the USGS recommends the Alaska Resource Data File over MRDS. It describes mines, prospects and occurrences quadrangle by quadrangle at 1:250,000, compiled from published literature and unpublished industry, US Bureau of Mines and USGS reports, and holds 7,448 records. Downloads are a zipped shapefile (2.5 MB) and KML, and there are WMS and WFS services.
United Kingdom and Europe
The British Geological Survey runs MineralsUK for mineral resources, planning and statistics, with World Mineral Production 2020 to 2024 and the UK Minerals Yearbook 2025 as downloads, and its OpenGeoscience service offers map viewers, borehole scans, publications and data downloads under open licences, with the acknowledgement line each licence requires. For the EU, the European Commission’s RMIS mineral inventory shows mineral occurrences and mine locations in two layers; it is an adapted version of the EGDI Mineral Resources dataset built in the GeoERA Mintell4EU project, and the 2021 version covers 21 member states, leaving out Bulgaria, Estonia, Latvia, Lithuania, Luxembourg and Malta (EU RMIS mineral inventory). The EGDI site offers a map viewer, data search and a metadata catalogue for its mineral theme (EGDI mineral resources).
▶ How to read GeoVIEW.WA, WAMEX, MINEDEX and Tengraph, the Western Australian map and database portals. · 4:13
World geological map shapefile: what really exists
Searches for a world geological map shapefile usually end at the same wall: there is no single open, high-detail, ready-to-download world geology layer. What exists is a set of options with different trade-offs.
- CGMW Geological Map of the World at 1:35,000,000, GIS edition. The Commission for the Geological Map of the World, set up in 1913 and affiliated with the International Union of Geological Sciences, sells the 2017 edition as a geodatabase in WGS84 with ArcGIS map documents. A licence agreement must be signed before the download link is sent (CCGM product page).
- CGMW World 5M. A smooth 1:5,000,000 digital geological map is under construction. The first version, released in 2024, is a licensed PDF that cannot be edited, so it works for reading but not for GIS analysis (CCGM World 5M page).
- GLiM, the Global Lithological Map. Built by Hartmann and Moosdorf, it holds 1,235,400 polygons classed into 16 first-level rock types, with an average resolution of about 1:3,750,000. In their summary, sediments cover 64% of the Earth surface, metamorphic rocks 13%, plutonic rocks 7% and volcanic rocks 6%. The University of Hamburg points to the CGMW site for the original GIS data, and a 0.5 degree raster version is on PANGAEA under CC-BY-3.0 (University of Hamburg GLiM page, PANGAEA record). GLiM describes rock type, not age or structure, so it suits regional screening.
- OneGeology web services. OneGeology was a network of geological surveys; the initiative closed after 18 years, and its resources stay available while a new host for the portal is sought. The portal lists registered map services, and its documentation says it opens with the CGMW 1:50,000,000 geological units layer at full world extent. Maps are served as WMS, data as WFS and WCS, with a CSW catalogue; maps are usually queryable, but the underlying data is generally not downloadable directly, and some conditions of use exclude commercial access (OneGeology services, Using the OneGeology portal).
- National survey downloads. For serious work, take the geology from the country’s own survey: the BGS Geology Viewer for Great Britain, state surveys in the United States and Australia, and provincial surveys in Canada.
The USGS MRData viewer also draws geologic units, contacts and structures, so you can see MRDS dots over geology without downloading anything.
Read a deposit record before you trust the dot
A dot on a map hides four separate questions. Each has a quick check.
- How old is the source? MRDS records are current only to the date of their source report, and many were compiled decades ago. Read the reference list in the full record and look at the report date.
- What does the status mean? Producer, Past Producer, Prospect, Occurrence and Showing are database words, not legal or financial statements. None of them is a resource estimate. A resource under JORC, NI 43-101 or SAMREC needs a qualified person, and a database record is not one.
- How accurate is the position? Points taken from small-scale maps can sit hundreds of metres from the real site; the calculator below shows 508 m for a 1:1,000,000 source. The calculator below turns a map scale into a ground tolerance.
- Is it a duplicate? The same mine can appear under several names or at two nearby coordinates. MRDS keeps a names field for old and alternative names; search it before you count.
Also confirm land status. A deposit record tells you nothing about who holds the ground now. Check the tenure database for the jurisdiction and ask the regulator before you plan any field work.
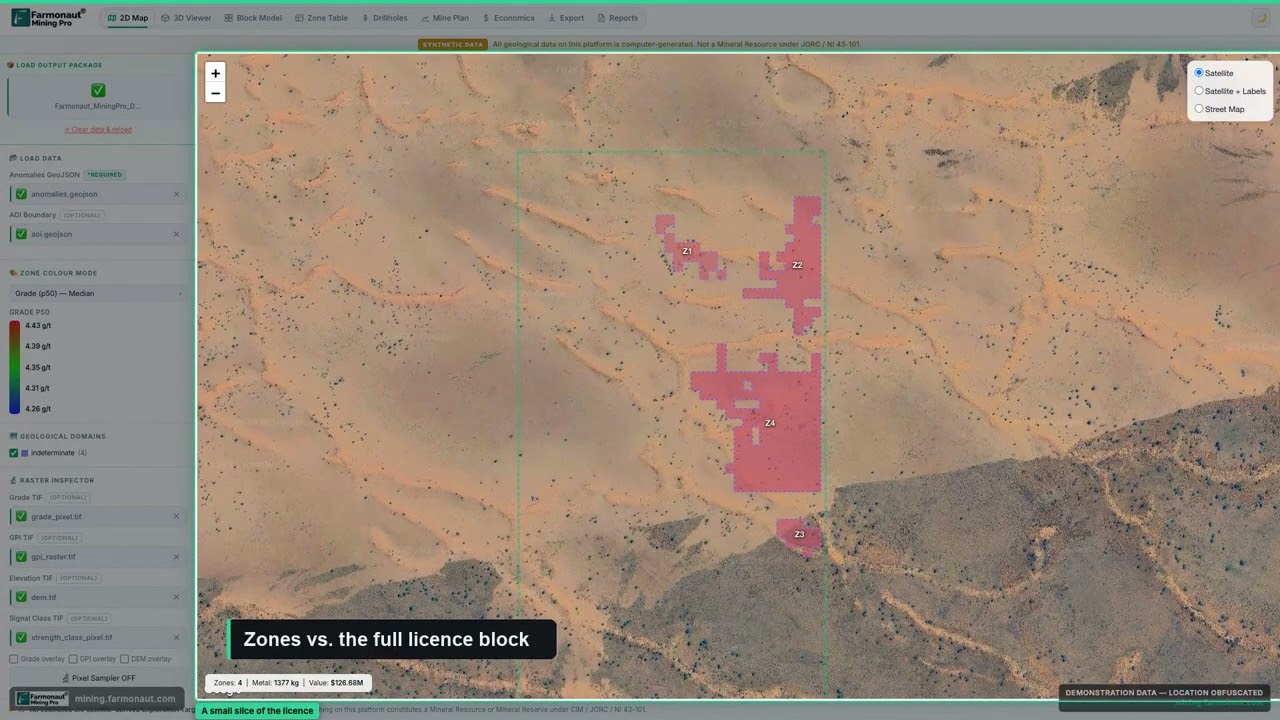
▶ A tour of reading a mining GIS map: licence boundaries, detected zones and live statistics on satellite imagery. · 5:38
How accurate is a mapped location?
For US topographic maps, the National Map Accuracy Standards say that on maps with a publication scale of 1:20,000 or smaller, not more than 10 percent of well-defined points tested may be in error by more than 1/50 inch measured at publication scale. The USGS gives the 1:24,000 example: 1/50 inch is 40 feet, or 12.2 metres, on the ground (USGS National Mapping Program fact sheet; USGS Map Accuracy Standards fact sheet). The rule applies to well-defined points and to maps that were tested, so use it as a lower bound for a database that was compiled from maps of that scale. A point digitised from a 1:250,000 sheet can be off by far more on the ground.
Use the calculator to turn the scale of the source map into a ground tolerance, and compare it with the size of your claim or licence.
Calculator
How far off can a mapped point be?
Enter the scale of the source map and the width of your claim or licence block.
- Search radius to use around the point: 254.0 m
- Tolerance in feet: 416.7 ft
- Tolerance as share of your block width: 25.4 %
Uses the US National Map Accuracy Standards limit of 1/50 inch at publication scale, which applies to maps at 1:20,000 or smaller (USGS); enter 20,000 or more, because larger-scale maps use a tighter 1/30 inch limit. It applies to well-defined points on tested maps; points in databases compiled from untested or older maps can be worse. Example values only. The search-buffer multiple is your own choice, not a standard.
Satellite-mapped mining areas: the Maus global dataset
Deposit points say where ore was reported. A different type of global layer maps where mining has actually disturbed ground. Maus and co-authors built a global dataset of mining areas by tracing polygons on satellite imagery. The first version, published in 2020, held 21,060 polygons covering 57,277 square kilometres (Maus and others, Scientific Data, 2020). The 2022 update holds 44,929 polygons covering 101,583 square kilometres, mapped on 2019 Sentinel-2 imagery around more than 34,000 mining locations, and it includes artisanal and small-scale mining as well as large mines (Maus and others, Scientific Data, 2022). The polygons cover open cuts, tailings dams, waste rock dumps and similar features, not the ore body below them.
Chart
Mapped mining area, two versions
Square kilometres
Chart
Mining-area polygons, two versions
Number of polygons
This is a footprint layer. It is a good check on a point database: if an MRDS “producer” has no mining polygon nearby, the record may be old, misplaced or an underground operation with little surface trace. For disturbance near a licence, a polygon layer tells you about the present ground; it cannot tell you about grade.
Load the data into QGIS in six steps
QGIS is an open-source GIS that reads all of the formats above. Its documentation lists web map and data services (WMS and WMTS, WFS and OGC API features, WCS, CSW) among the providers it handles (QGIS Opening Data). A short workflow that works for every database in this guide:
- Set the project coordinate system first. Use WGS84 (EPSG:4326) for MRDS, USMIN and Ontario KML; use the UTM zone of your licence for distance work.
- Add the points. Drag the shapefile or CSV into QGIS. For a CSV, use the delimited text option and pick the latitude and longitude fields.
- Or connect to the service. Open the Data Source Manager, choose the WFS tab, create a new connection and paste the WFS address (for MRDS, https://mrdata.usgs.gov/services/wfs/mrds). For a WMS base map such as the USGS geology layers or a survey’s own service, use the WMS/WMTS tab the same way (QGIS OGC client documentation).
- Filter by status and commodity. Show only Producer and Prospect points, or one commodity code, so the map is readable.
- Add geology and your licence boundary. Load the rock-unit layer under the points and import your licence polygon as KML or shapefile.
- Record your source and date. Save the layer name, the download date and the licence terms in the project notes. The data changes, and so do the conditions of use.
Check the licence terms for each layer. Open data usually asks for an acknowledgement, and some services restrict commercial use.
Where satellite imagery fits with these maps
These databases show what other people have recorded. Satellite imagery adds a current view of the ground itself. Multispectral and radar sensors can map iron-oxide staining, clay alteration and faults across a licence in a way a point database cannot, and a survey record can be tied to the surface pattern around it. A deposit database tells you where to look first; the imagery tells you which parts of that ground show the signatures of the deposit style, and sampling and drilling confirm what is there. The video below explains the measurement idea in plain words.
Farmonaut produces satellite mineral reports for licence owners, who send a boundary and receive mapped target zones for the ground; see our guide to satellite mineral detection for how the method works.
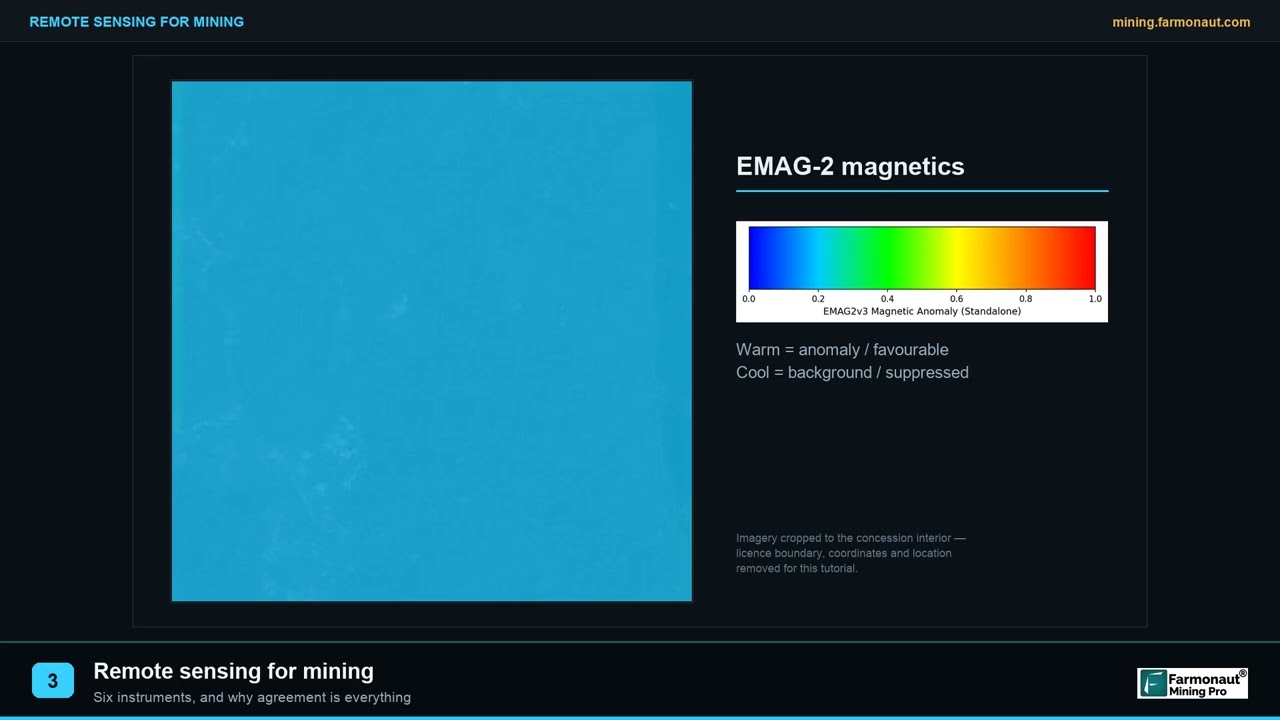
▶ Remote sensing for mining in three minutes: the six instrument families and why their agreement matters. · 2:01
Frequently asked questions
Is there one map of all mineral deposits in the world?
No. The nearest thing is the USGS MRDS with 304,632 records, plus the USGS major deposits layer with 3,161 features, but both are archives with uneven coverage. Current data lives in national and state databases, and company resource tables sit in filings.
Is USGS MRDS still updated?
No. The USGS stopped systematic updates in 2011, and the downloadable edition in the metadata is dated 15 March 2016. About 600 records were lightly updated for western US studies. For the United States the USGS points to USMIN, and for Alaska to the Alaska Resource Data File.
Can I download MRDS as a shapefile?
Yes. The MRDS page offers a compact shapefile of about 10 MB, a single flattened CSV of 23 MB and two multi-table CSV sets. You can also load it live in GIS through the WMS and WFS addresses.
What is the difference between a mineral occurrence and a mineral deposit?
An occurrence is a recorded presence of a mineral of interest, with no claim about size. A deposit is an occurrence with enough work behind it to suggest a body that could be studied for mining. Databases use their own status words, so read each database’s definition.
Where can I find a mineral occurrence map for my country?
Search for the national geological survey’s mineral occurrence database. Examples are BC MINFILE, the Ontario Mineral Inventory, MINEDEX in Western Australia, the Alaska Resource Data File, MineralsUK and the RMIS inventory for the EU. Our country pages cover Canada, Australia and the United States.
Where can I get a world geological map as a shapefile?
The CGMW sells the 1:35,000,000 geological map of the world as a GIS geodatabase under a licence agreement, and GLiM offers a global rock-type polygon map with about 1.2 million polygons. OneGeology’s registered services (the initiative has closed but its resources remain online) serve many surveys’ maps through WMS, usually for viewing and not for download.
What is OneGeology?
OneGeology was an initiative of geological surveys to make geological maps accessible online. The initiative has now closed, but its resources remain available while a new host for the portal is sought. The portal lists registered services, and the maps are delivered as WMS, with data as WFS and WCS and a CSW catalogue. Conditions of use vary by layer, and the services depend on each survey keeping its server running.
Are MRDS “producer” mines still operating?
Not necessarily. The status reflects the source report, which may be decades old. Check the national mine register, regulator records or company filings for current status.
How accurate are the coordinates in mineral deposit databases?
It depends on the source map. On a US topographic map at 1:24,000 the accuracy standard is about 12.2 metres for well-defined points; coordinates taken from maps at 1:1,000,000 can be off by about 500 metres or more. Treat any point as a pointer to a report, and confirm in the field.
Can I use a deposit map to choose where to stake a claim?
A deposit map shows where others have recorded minerals, not who holds the ground or whether it is open. Check land status and tenure with the regulator first, and get permission before field work. Deposit records are not resource estimates.
Which software opens these files?
QGIS, which is open source, reads shapefiles, GeoPackage, KML, CSV and the web services. Google Earth opens KML and KMZ. Commercial packages such as ArcGIS open geodatabases directly.
How does a satellite report differ from a deposit database?
A database is a record of past reports at known sites. A satellite report maps surface and near-surface signatures across the ground you hold, including areas nobody has recorded. Sampling and drilling confirm what the signatures mean.
This page is for information only. It is not investment advice or legal advice. A database record is not a mineral resource estimate. Confirm land status, permission and licensing with the landowner and the regulator before any site work.
Farmonaut mining
Map your licence area from space
Send a licence or claim boundary and get a satellite-based screening report that maps target zones for the ground.
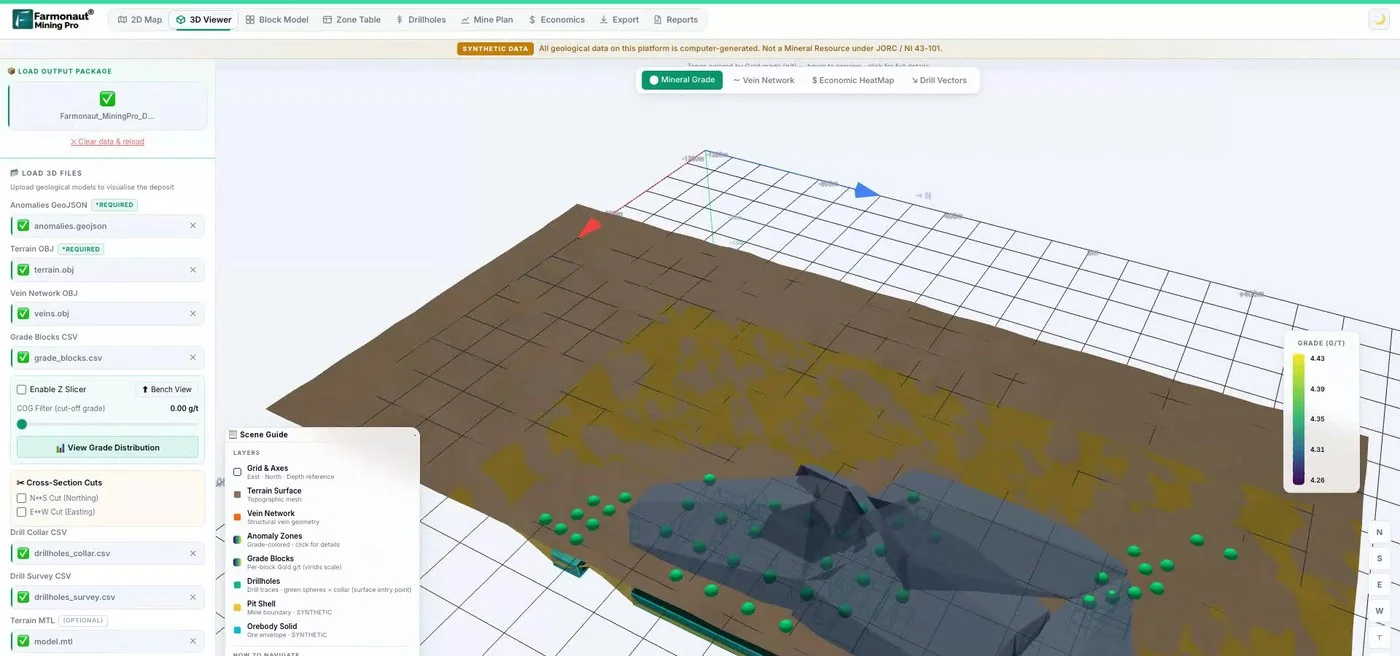
Mining Pro sample view, synthetic data
Sources
- USGS, Mineral Resources Data System (MRDS): mrdata.usgs.gov
- USGS, MRDS metadata: mrdata.usgs.gov
- USGS, USMIN Mineral Deposit Database: mrdata.usgs.gov
- USGS, Prospect- and mine-related features on USGS topographic maps: mrdata.usgs.gov
- USGS, Major mineral deposits of the world: mrdata.usgs.gov
- USGS, Alaska Resource Data File: mrdata.usgs.gov
- USGS, MRData global map viewer: mrdata.usgs.gov
- data.gov, Global Distribution of Selected Mines, Deposits, and Districts of Critical Minerals: catalog.data.gov
- USGS, Professional Paper 1802, Critical mineral resources of the United States: pubs.usgs.gov
- USGS, Scientific Investigations Report 2010-5090, Global mineral resource assessment: pubs.usgs.gov
- British Columbia Geological Survey, MINFILE mineral inventory: www2.gov.bc.ca
- Ontario Data Catalogue, Ontario Mineral Inventory: data.ontario.ca
- Government of Western Australia, Access Mines and Mineral Deposits (MINEDEX): wa.gov.au
- Geoscience Australia, Mineral resources and advice: ga.gov.au
- British Geological Survey, MineralsUK: bgs.ac.uk
- British Geological Survey, OpenGeoscience: bgs.ac.uk
- European Commission JRC, RMIS mineral inventory: rmis.jrc.ec.europa.eu
- EuroGeoSurveys, EGDI mineral resources: europe-geology.eu
- OneGeology, Benefits, services and membership: onegeology.org
- OneGeology, Using the OneGeology portal: onegeology.org
- Commission for the Geological Map of the World, Geological map of the world at 1:35 M, GIS: ccgm.org
- Commission for the Geological Map of the World, 1:5 M geological map of the world: ccgm.org
- University of Hamburg, GLiM Global Lithological Map: geo.uni-hamburg.de
- PANGAEA, Global Lithological Map Database v1.0 (Hartmann and Moosdorf, 2012): doi.pangaea.de
- Maus and others, A global-scale data set of mining areas, Scientific Data (2020): nature.com
- Maus and others, An update on global mining land use, Scientific Data (2022): nature.com
- USGS, National Mapping Program, National Map Accuracy Standards: pubs.usgs.gov
- USGS, Map Accuracy Standards fact sheet: fss.lsu.edu
- QGIS Documentation, Opening Data: docs.qgis.org
- QGIS Documentation, OGC client support: docs.qgis.org
Discussion
Questions, corrections or field experience? Share them below. First-time comments are reviewed before they appear, and your email is never published.
No comments yet. Be the first to add a question or your experience.

 Timestream Mining
 Lithspo Minerals Limited
 Tintina Mining Group
 Dalgety Minerals Pty Ltd
 Faith At Work (Pty) Ltd
 Geotech Mining Solutions plc
 Vulcan International Limited
 Kidepo Associates
 GKY Mining
 Alkimy SARL
 Double A Trading
 GemSprout Metals Limited
 Qader Group
 Ileys General Trading
 SG Gold Mining LLC
 VRV Global Pte Ltd
 Omsri International FZE
 G.I.T.T.
 Jaunita Erss Ltd
 Almosi SARL
 SRK Consulting
 Berks Gold Limited
 Mwerezi Minerals Company Limited

 Exploration consultancy · South Africa · Gold










