

Uranium · Country and mine guide
Map of Uranium Deposits: Top Countries and Mines Ranked
Australia holds the most identified uranium (1.70 million tU, Red Book data for 1 January 2025), but Kazakhstan mines the most. This guide maps both, by country, deposit type and mine, with a calculator for contained pounds.
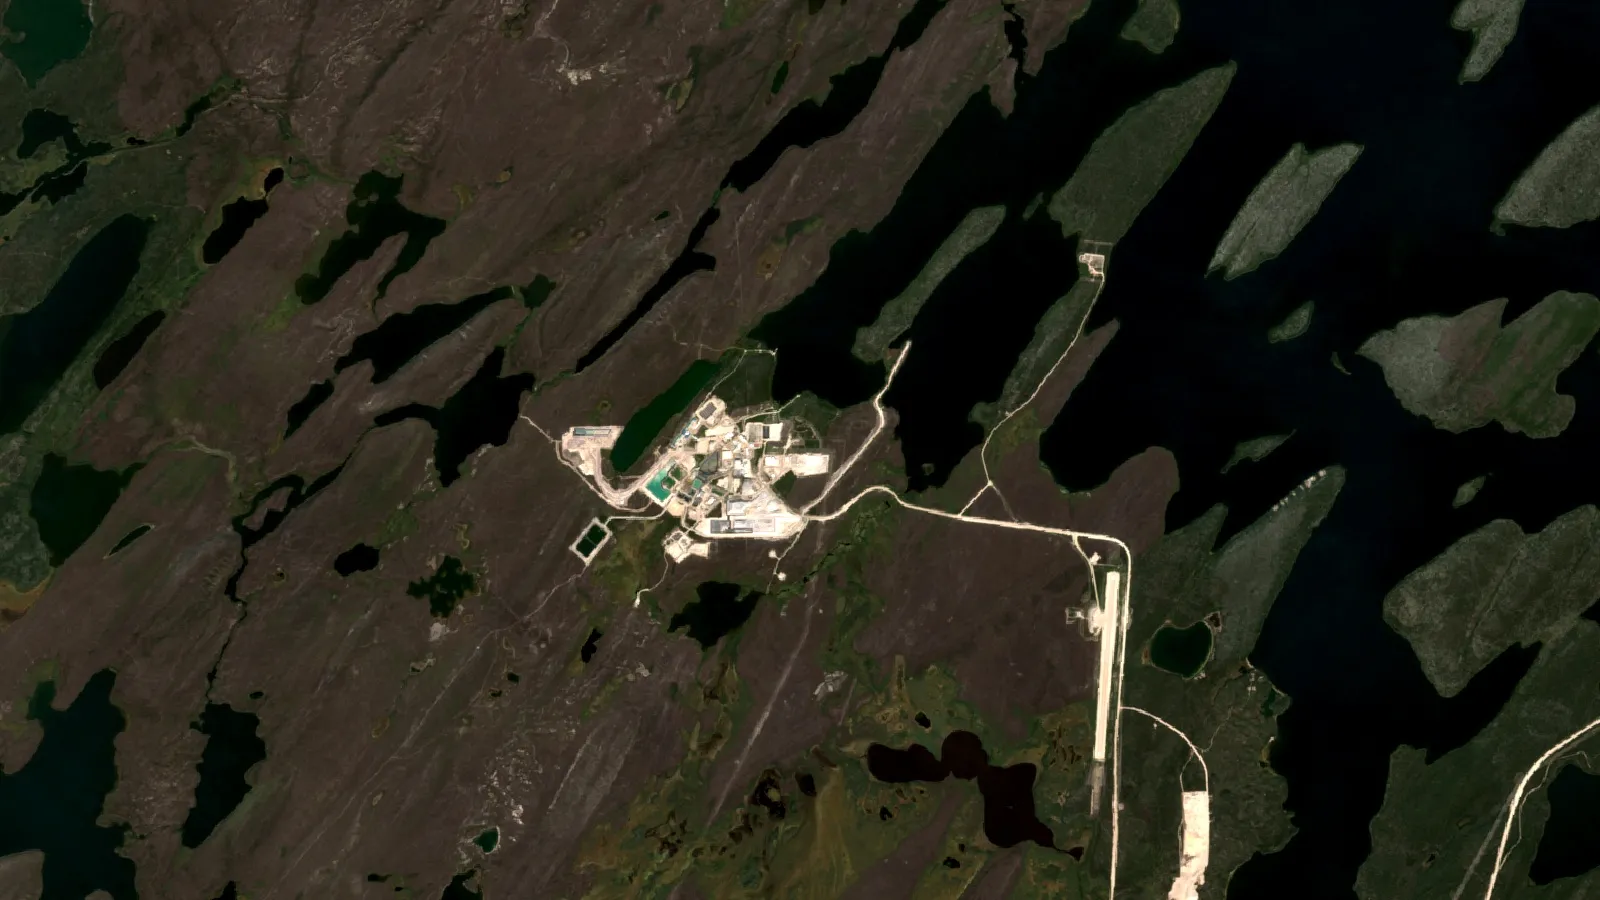
Key takeaways
- Australia holds 29% of identified uranium resources at up to US$130/kg U (1,701,600 tU of 5,864,500 tU, 1 January 2025; WNA from the Red Book).
- The 2026 Red Book counts more than 8.1 million tU below US$260/kg U, up 2.1% on the previous edition (NEA/IAEA via World Nuclear News, September 2026).
- Kazakhstan mined 39% of world uranium in 2024, Canada 24% and Namibia 12% (World Nuclear Association).
- Ten mines produced 62% of 2024 output; McArthur River/Key Lake (7,808 tU) and Cigar Lake (6,501 tU) lead.
- Cigar Lake reserves average 15.9% U3O8, against about 0.032% U3O8 (0.027% U, December 2017) at Kazakhstan’s Inkai (WNA, company-reported).
In this article
- Which countries hold the most uranium in the ground
- Map of uranium deposits by region
- Uranium deposit types: the four that explain the map
- Largest uranium mines by output
- Where mined uranium comes from, and how that has shifted
- Ore grade: why Canada's deposits stand apart
- Uranium deposits in the United States
- Uranium in Africa: Namibia, Niger and the rest
- What a deposit is worth: contained pounds calculator
- Land and water around a uranium deposit
- How satellites help at the screening stage
- Frequently asked questions
Australia holds the largest share of the world’s known uranium: 1,701,600 tonnes of uranium (tU) recoverable at up to US$130/kg U, or 29% of the 5.86 million tU world total as of 1 January 2025 (World Nuclear Association, from the OECD-NEA/IAEA Red Book). Kazakhstan comes second with 827,500 tU and Canada third with 551,700 tU. Mining is a different map: Kazakhstan produced 39% of the world’s mined uranium in 2024, Canada 24% and Namibia 12%. The sections below put both maps side by side, then show the deposit types, the biggest mines and a calculator for the metal in a deposit.
Which countries hold the most uranium in the ground
Geologists split uranium into resources (metal that has been measured or inferred in the ground and could be mined at a stated cost) and reserves (the part a company has shown to be economic). The Red Book, published jointly by the OECD Nuclear Energy Agency and the IAEA, counts resources in cost classes. The 2026 edition reports more than 8.1 million tU recoverable below US$260/kg U on 1 January 2025, up 2.1% on the previous edition (World Nuclear News, 14 September 2026). The cheaper class, up to US$130/kg U, is the one most readers mean by “uranium deposits”, and it is the one charted here.
Chart
Identified uranium resources by country
Thousand tonnes U recoverable at up to US$130/kg U, 1 January 2025
The eight countries in the chart hold about 84% of that cheaper class. Australia’s total sits mostly in five deposits: Olympic Dam, Ranger, Jabiluka, Kintyre and Yeelirrie (World Nuclear Association, Australia). Brazil (167,800 tU), Ukraine (161,300 tU) and Mongolia (144,600 tU) follow the first eight, and Tanzania holds 57,700 tU.
Map of uranium deposits by region
Read the table as a location guide, not a ranking of quality. A large resource in low-grade sandstone can be cheaper to mine than a small, deep, high-grade body, and a country with a big resource can produce little if mines are shut or licences are slow. Resources are also reported in cost classes, so a figure at US$130/kg U is not comparable with one at US$260/kg U (5.86 million tU against 8.1 million tU here). Output rows use the latest full year, 2024.
The table lists the main uranium regions by country, with the deposit type from the IAEA classification, the best-known deposits, and the 2024 mined output (World Nuclear Association). Resource figures are the Red Book numbers for 1 January 2025 at up to US$130/kg U. A dash means the country is outside the eight largest holders.
| Country | Resources, tU | Main deposit type | Named deposits and districts | 2024 output, tU |
|---|---|---|---|---|
| Australia | 1,701,600 | Iron-oxide breccia; unconformity | Olympic Dam, Ranger, Jabiluka, Kintyre, Yeelirrie | 4,598 |
| Kazakhstan | 827,500 | Sandstone, roll-front | Budenovskoye, Inkai, Tortkuduk, Moinkum, Mynkuduk | 23,270 |
| Canada | 551,700 | Proterozoic unconformity | McArthur River, Cigar Lake (Athabasca Basin); Kiggavik (Thelon Basin) | 14,309 |
| Russia | 471,700 | Sandstone; volcanic-related | Dalur and Khiagda (basal channel); Streltsovskoye caldera | 2,738 |
| Namibia | 392,800 | Intrusive (alaskite) | Husab, Rössing | 7,333 |
| Niger | 351,100 | Sandstone, tabular | Arlit and Akouta, Imouraren | 962 |
| China | 325,400 | Volcanic-related; sandstone | Xiangshan (volcanic) | 1,600 (estimate) |
| South Africa | 320,900 | Intrusive; Karoo sandstone | Palabora by-product; Karoo basin | 200 (estimate) |
| United States | – | Sandstone; collapse breccia pipe | Powder River Basin, Colorado Plateau, south Texas, Arizona Strip | 260 |
Deposit types and examples come from the IAEA classification as summarised by the World Nuclear Association; output is from its world production table. The Red Book itself counted 61,924 tU of production in 2024, the highest since 2006 (World Nuclear News), a little above the 60,213 tU in the World Nuclear Association table because the two bodies use different estimates for a few countries.
Uranium deposit types: the four that explain the map
The IAEA groups uranium deposits into 15 types by geological setting, adopted in the Red Book from 2014 onward. Four of them account for most of the mines on the map.
- Proterozoic unconformity. Uranium collected where old, folded basement rock meets younger undeformed sandstone. The type makes up about one-third of western-world resources. The Athabasca Basin in Saskatchewan holds the richest examples, and some ore runs about 20% uranium.
- Sandstone. Uranium dropped out of groundwater where it met reducing material in a river or shoreline sandstone. These deposits hold about 28% of world reasonably assured resources and 40% of inferred resources. Grades are low to medium (0.05-0.35% U). The roll-front sub-type, an arc-shaped body that cuts across the bedding, can be mined by in situ leaching. Sandstone deposits are of major economic importance in Kazakhstan, Uzbekistan, the US and Niger.
- Polymetallic iron-oxide breccia complex. Olympic Dam in South Australia is the world’s largest known uranium deposit, but uranium is recovered there only as a by-product of copper, with gold and silver. Uranium grades average 0.035-0.07% U.
- Intrusive. Uranium in granite-like rocks such as alaskite. Rössing and Husab in Namibia are the major examples. The ore is very low grade (0.01% U is a Namibian example of ore that can still be mined), so the mines are large open pits.
Other types matter locally: volcanic-related deposits in China, Mongolia and Russia, collapse breccia pipes near the Grand Canyon, and quartz-pebble conglomerates that are mined for uranium as a by-product of gold in some places. Knowing the type tells an explorer what to look for. A roll-front is a redox boundary in a sandstone; an unconformity deposit is a fault zone beneath a basin edge.
Largest uranium mines by output
Ten mines produced 37,156 tU in 2024, 62% of the world total (World Nuclear Association). Two Canadian underground mines lead: McArthur River/Key Lake produced 7,808 tU and Cigar Lake 6,501 tU. Husab in Namibia is third. Five of the top ten are Kazakh in situ leach operations. Ownership is concentrated too. By company, Kazatomprom produced 12,463 tU (21% of the world), Cameco 10,193 tU (17%) and Orano 6,815 tU (11%) in 2024. Cameco and Orano share Cigar Lake, with Cameco holding 57.418% and Orano the rest as of mid-2026. Husab is run by Swakop Uranium, owned by CGN. Olympic Dam is owned by BHP, and Rössing by CNNC.
Chart
Largest uranium mines, 2024 output
Tonnes U
Read the output column with care. A mine’s output is not its resource: Olympic Dam holds the largest known uranium deposit but ranks only seventh by output, because uranium is recovered there only as a by-product of copper.
Where mined uranium comes from, and how that has shifted
Mined output fell to 47,731 tU in 2020 and has since recovered to 60,213 tU in 2024. Canada drove most of the swing: its output dropped from 14,039 tU in 2016 to 3,885 tU in 2020, then returned to 14,309 tU as McArthur River restarted. Niger fell from 4,116 tU in 2015 to 962 tU in 2024. In situ leaching supplied 55% of 2024 output, underground and open-pit mines 40% and by-product recovery 5% (World Nuclear Association).
Chart
Mined uranium, three largest producers, 2015-2024
Thousand tonnes U mined per year, 2015-2024
Chart
Mined uranium by country, 2024
Thousand tonnes U (Uzbekistan and China are estimates)
The wider picture explains why prices and mine news matter. The Red Book puts current requirements at about 64,500 tU a year, rising to between 84,800 and 143,900 tU by 2050, and counts exploration and development spending above US$1.78 billion in 2023-2024, up 46% on the previous two years (American Nuclear Society, 15 September 2026). For prices, Cameco’s industry-average spot price for September 2026 was US$89.63 per pound of U3O8 and the long-term price US$96.50 (Cameco, from UxC and TradeTech month-end prices). Spot is the price for immediate delivery; most uranium is sold under longer term contracts. Our guides to yellowcake price per pound and the uranium price per kg explain how to read those quotes.
Ore grade: why Canada’s deposits stand apart
The World Nuclear Association gives typical ore grades of 20% U for the richest Canadian ore, 2% for high-grade ore, 0.1% for low-grade ore and 0.01% for very low-grade ore in Namibia, against 2.8 parts per million for the average continental crust. Company-reported reserves at Cigar Lake average 15.9% U3O8 and at McArthur River 9.6% U3O8 (about 13.5% and 8.1% U), and the World Nuclear Association notes that many Canadian deposits are about one hundred times the world average ore grade (World Nuclear Association, Uranium in Canada). High grade has a cost: Cigar Lake sits in soft sandstone and is mined with ground freezing and remote water-jet boring, and flooding in 2006 and 2008 delayed first production to 2014.
Kazakh sandstone deposits are the opposite case. Cameco reported Inkai reserves of 103,725 tU at 0.027% U, about 0.032% U3O8 (December 2017, quoted by the World Nuclear Association). Low grade works because dissolving the uranium in place avoids digging and milling the rock. All but one of the operating or planned ISL mine groups in Kazakhstan are in the 40,000 km2 Chu-Sarysu province, mined at depths of 100-300 metres.
Uranium deposits in the United States
US production is small: 260 tU in 2024, mostly from in situ leach plants in Wyoming and Texas, plus feed processed at the White Mesa mill in Utah. Most producing states regulate uranium mining themselves as NRC agreement states, and Wyoming became one in 2018. Land access also shapes the map. A 2011 order withdrew about 4,000 km2 in Arizona from new hardrock uranium mining, which the Nuclear Energy Institute said sterilised 145,000 tU of known resources, and in August 2023 the area became a national monument with a permanent ban on new claims. Valid existing claims are not affected (World Nuclear Association, US uranium mining). In May 2024 the US banned imports of Russian-origin natural uranium and unirradiated low-enriched uranium from August 2024, with waivers to January 2028.
Uranium in Africa: Namibia, Niger and the rest
Namibia’s Husab and Rössing mines made up 12% of world output in 2024 from very low-grade intrusive ore. Niger’s Arlit, Akouta and Imouraren deposits are tabular sandstone bodies in palaeochannels, and output there has fallen from 4,116 tU in 2015 to 962 tU in 2024. South Africa’s resources include Karoo sandstone, which also extends into Tanzania, Malawi and Zambia.
The video above shows why a map must be read with care: a mapped uranium occurrence is not a mine, and only drilling and a formal resource estimate show what is there.

▶ A short explainer on whether Zimbabwe has uranium and what is known about Kanyemba. · 4:27
What a deposit is worth: contained pounds calculator
A deposit’s grade and tonnage convert into pounds of U3O8, the unit the market quotes. One tonne of U3O8 is 2,204.62 pounds, and uranium metal (U) is 84.8% of U3O8 by weight. Enter your own tonnage, grade, recovery and price below.
Calculator
How many pounds of U3O8 are in a deposit?
Enter your own tonnage, grade, recovery and price.
- Recovered U3O8 (tonnes): 850
- Recovered U3O8 (lb): 1,873,927
- Gross value at your price (US$): $168,653,430
Example values only, not a benchmark or forecast. 1 tonne = 2,204.62 lb. Grade is % U3O8. Price is an input: example, use today’s price (US$ per lb U3O8); Cameco’s September 2026 industry-average spot price was US$89.63 (UxC/TradeTech). Costs, royalties and payables are left out, so the result is gross value, not profit.
Land and water around a uranium deposit
Where a deposit sits shapes the permit, not just the geology. Open pits like Rössing and Husab need land clearing and dust control in dry country. Underground mines like Cigar Lake keep the surface footprint small but need water treatment. In situ leach avoids pits and tailings dams, but the operator must show that groundwater in the mined sandstone stays inside the well field, and the US EPA’s January 2015 proposed rule would require groundwater characterisation before ISL mining starts. Milling leaves tailings that need lined storage and long-term monitoring. Exploration teams check these constraints at the same time as grade: protected areas, communities, rivers and aquifers all decide whether a deposit can be mined.
The claymation video below walks through the seven environmental impacts of mining in plain words.
▶ A plain-language claymation on the seven environmental impacts of mining. · 2:31
How satellites help at the screening stage
Satellites do not detect uranium directly. They map the surface clues that go with it: clay and iron-oxide alteration, bleached sandstone, palaeochannels, faults and basin edges. For a licence owner or consultant, that narrows where to send a field crew, and the result is an exploration target, not a resource estimate. Farmonaut’s satellite mineral detection uses public satellite imagery to screen a boundary you supply, and the mining query form is the way to ask for a quote. For Canadian ground, read the public geoscience first; see our guide to exploration spending in Canada.
Frequently asked questions
Which country has the most uranium deposits?
Australia has the largest identified resources, 1,701,600 tU at up to US$130/kg U on 1 January 2025 (World Nuclear Association, from the Red Book), mostly in five deposits led by Olympic Dam.
Which country produces the most uranium?
Kazakhstan, with 23,270 tU in 2024, about 39% of world output (World Nuclear Association). Canada was second with 14,309 tU.
Where is the highest-grade uranium found?
In the Athabasca Basin of Saskatchewan, Canada. Cigar Lake reserves average 15.9% U3O8 and McArthur River 9.6% (World Nuclear Association).
What is the largest uranium deposit in the world?
Olympic Dam in South Australia is the world’s largest known uranium deposit, mined mainly for copper with uranium as a by-product (World Nuclear Association).
What is the largest uranium mine by output?
McArthur River/Key Lake in Canada produced 7,808 tU in 2024, 13% of the world total, followed by Cigar Lake at 6,501 tU.
How much uranium is left in the world?
The 2026 Red Book reports more than 8.1 million tU of identified resources recoverable below US$260/kg U, enough by its own assessment to meet the highest projected demand through 2050 (World Nuclear News).
Is uranium common in the Earth’s crust?
Yes. The crust averages about 2.8 parts per million uranium, about as common as tin or zinc, and seawater holds 0.003 ppm (World Nuclear Association). Rock only becomes ore where uranium is concentrated and can be recovered at a profit.
What is in situ leaching?
A solution is pumped through the ore-bearing sandstone, dissolves the uranium and is pumped back to a plant, so the rock is not dug up. It supplied 55% of world output in 2024.
Are there uranium deposits in the United States?
Yes. Wyoming, the Colorado Plateau, south Texas and the Arizona Strip hold sandstone and breccia-pipe deposits, but US output was only 260 tU in 2024.
Can satellites find uranium?
They map alteration, lithology and structure that point to likely host rocks. Only drilling and assays confirm uranium, so satellite results are exploration targets.
This page is for information only. It is not investment advice or legal advice. Confirm licence and permit rules with the regulator. Uranium is radioactive: do not prospect or sample without permission, a licence and radiation-safety training. Resource figures depend on the cost class and the date; production and price figures are as dated above.
Farmonaut mining
Map your mining site from space
Consultants can screen a licence boundary for uranium-style surface clues and get exploration targets, ahead of any resource estimate.

Mining Pro sample view, synthetic data
Keep reading
Sources
- World Nuclear Association, Supply of Uranium (updated 29 Sep 2026): world-nuclear.org
- World Nuclear Association, World Uranium Mining Production (updated 9 Oct 2026): world-nuclear.org
- World Nuclear Association, Geology of Uranium Deposits (updated 23 Oct 2026): world-nuclear.org
- World Nuclear Association, Uranium in Canada: world-nuclear.org
- World Nuclear Association, Australia’s Uranium: world-nuclear.org
- World Nuclear Association, Uranium and Nuclear Power in Kazakhstan: world-nuclear.org
- World Nuclear Association, US Uranium Mining and Exploration (updated 10 Apr 2026): world-nuclear.org
- World Nuclear News, Red Book confident on uranium resources (14 Sep 2026): world-nuclear-news.org
- American Nuclear Society, Newest Red Book notes the need for more U investment (15 Sep 2026): ans.org
- Cameco, Uranium Price (UxC and TradeTech month-end averages): cameco.com
Discussion
Questions, corrections or field experience? Share them below. First-time comments are reviewed before they appear, and your email is never published.
No comments yet. Be the first to add a question or your experience.

 Riverside Resources Limited
 Congo Mining Solutions
 Mining SARL
 SenGold Invest SAS
 Sania Corporation
 Sean Mining Limited
 NTS Group (Pty) Ltd
 Mine4Africa
 Lithspo Minerals Limited
 Tintina Mining Group
 Dalgety Minerals Pty Ltd
 Vortex Minerals Pty Ltd
 Faith At Work (Pty) Ltd
 Geotech Mining Solutions plc
 Vulcan International Limited
 Kidepo Associates
 GKY Mining
 Alkimy SARL
 Double A Trading

 Licence holder · Nigeria · Gold + lithium










