Normalized Difference Built-up Index: Urban Change Guide
“NDBI values above 0.2 typically indicate built-up urban areas, helping track city expansion with over 85% accuracy.”


Introduction: Monitoring Urban Change with NDBI
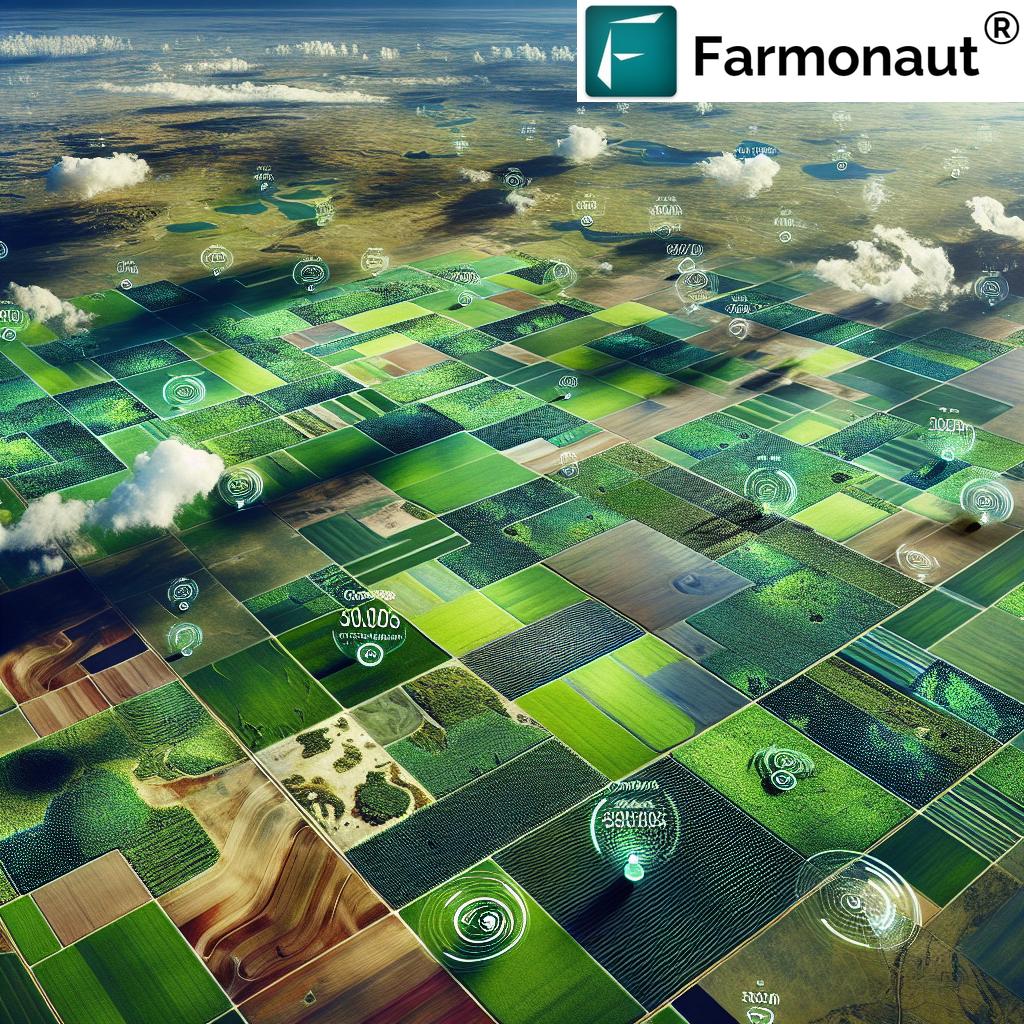
As our world becomes increasingly urban, tracking how cities expand and impact their surroundings has never been more crucial for sustainable land management. With rapid development, we’re witnessing the transformation of natural landscapes, agricultural fields, and forests into dense urbanized environments. To address the need for data-driven insights, the Normalized Difference Built-up Index (NDBI) has emerged as a powerful remote sensing metric. This technology leverages satellite imagery and spectral analysis to help us map, identify, and monitor changes in built-up areas and their influence on agriculture and forestry.
In this comprehensive guide, we’ll explain NDBI from its fundamentals to advanced applications—including how it supports planners, conservationists, and farmers in making informed decisions. Our focus will be on both technical needs and sustainability, aligning with current environmental assessments and global goals for responsible resource management.
Understanding the Normalized Difference Built-up Index (NDBI)
What is NDBI?
The Normalized Difference Built-up Index (NDBI) is a scientifically established index used to assess the presence and intensity of urban built-up areas using satellite remote sensing data. Unlike indices such as NDVI (Normalized Difference Vegetation Index), which targets vegetation, NDBI is specifically geared toward detecting urbanization, making it a vital tool for urban land use monitoring.
NDBI Calculation: The Science Behind the Metric
The core idea of NDBI is to exploit the differences in how various land surfaces—urban fabric, soil, vegetation, and water bodies—reflect energy in specific spectral bands. Built-up surfaces tend to reflect more in the Shortwave Infrared (SWIR) region than in the Near Infrared (NIR).
NDBI = (SWIR – NIR) / (SWIR + NIR)
- SWIR: Shortwave Infrared reflectance
- NIR: Near Infrared reflectance
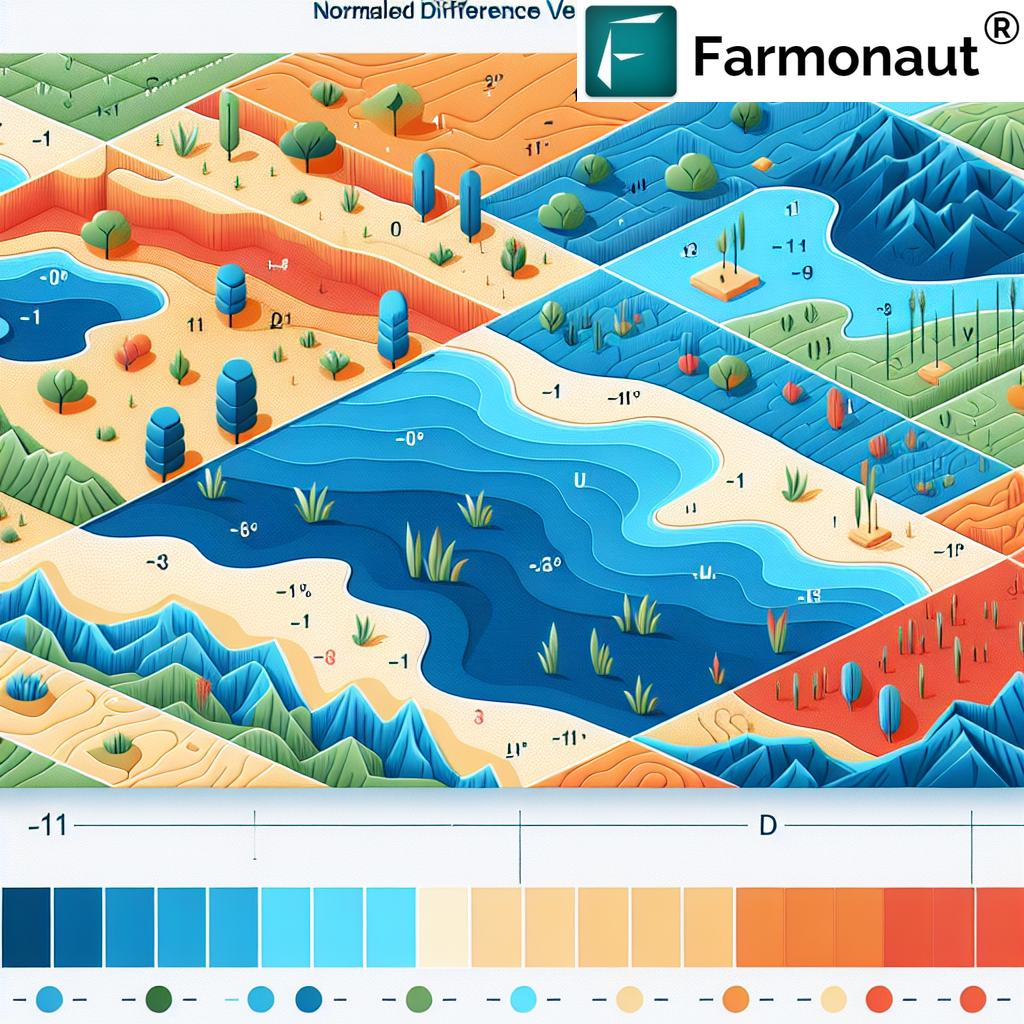
By applying this formula to each pixel in a satellite image, we produce an NDBI map where:
- Positive values (>0) indicate urban or built-up land.
- Negative values (<0) reveal the presence of vegetation, water bodies, or other natural landscapes.
Why SWIR and NIR Bands?
- SWIR (Shortwave Infrared): Urban areas, such as concrete and asphalt, tend to reflect strongly in these bands, making them stand out in satellite imagery.
- NIR (Near Infrared): Vegetation reflects highly in NIR, while built-up areas and water reflect less. By analyzing NIR and SWIR simultaneously, it’s possible to enhance contrast between urban and non-urban regions.
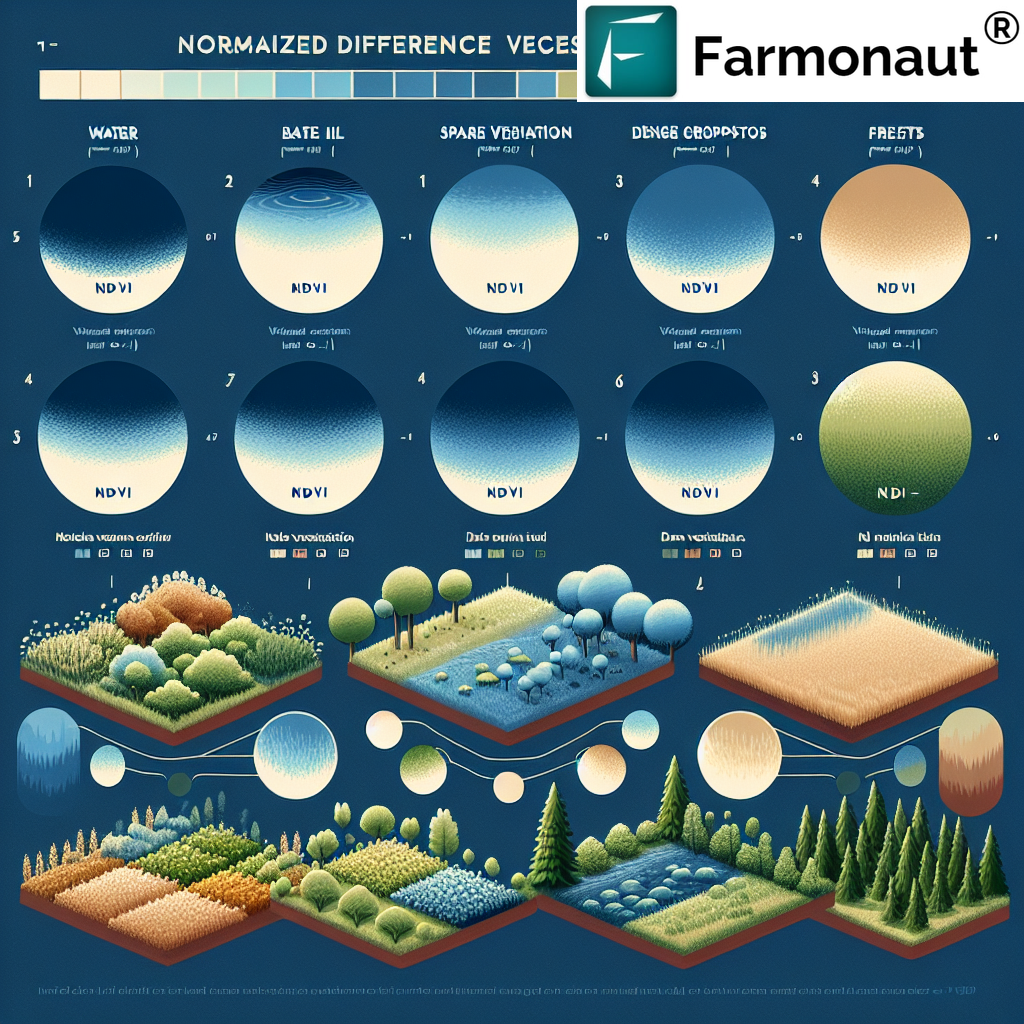
Interpreting NDBI Results
NDBI values are typically interpreted as follows:
- Values between 0.2 and 0.7: Signify urban built-up areas—roofs, roads, concrete, etc.
- Values < 0.2: Often correspond to agriculture (arable fields), forested regions, water bodies, or bare soil.
We can therefore use NDBI maps to monitor the spatial distribution and expansion of urban areas, track changes in land use, and help guide sustainable development decisions.
The result? Powerful data supporting everything from planning for smart urban growth to preserving valuable agricultural lands and forests.
“Urban land use change detected by NDBI can impact up to 30% of surrounding agricultural zones within a decade.”
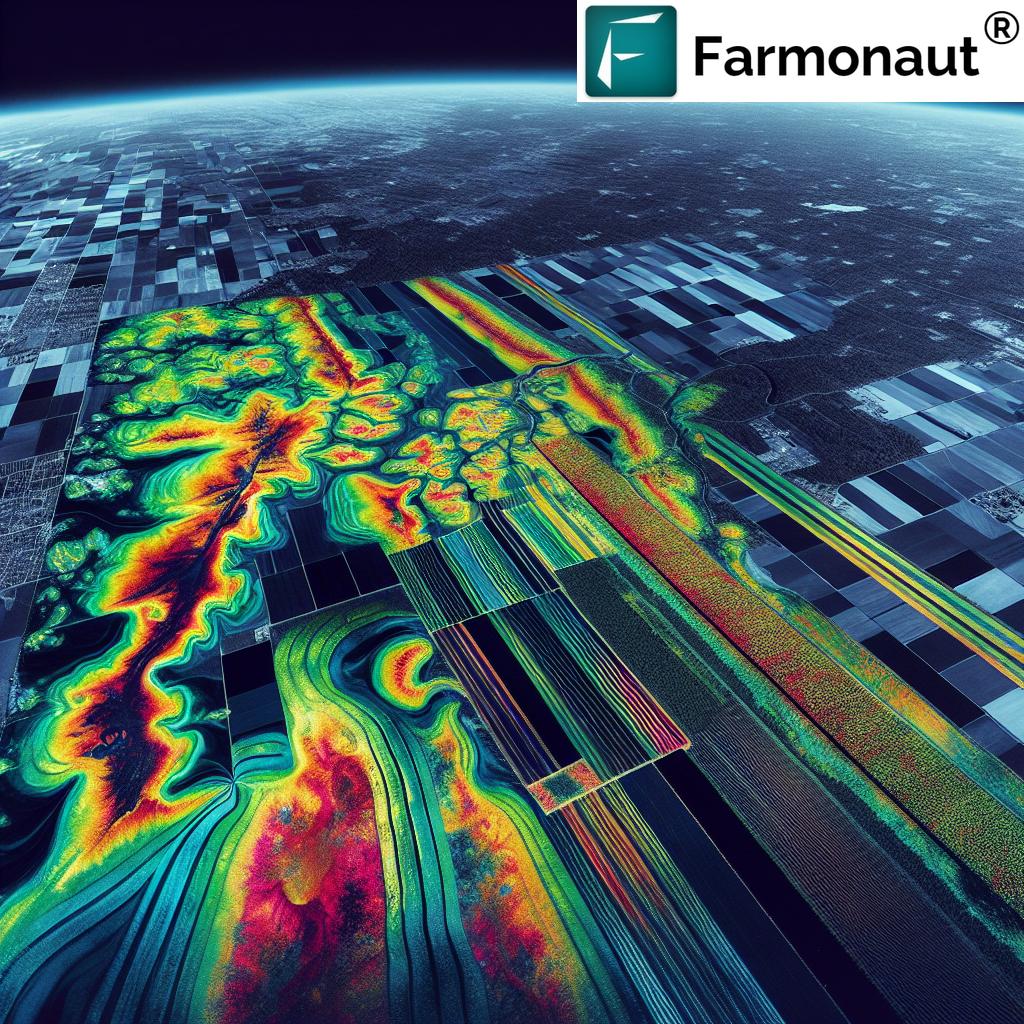
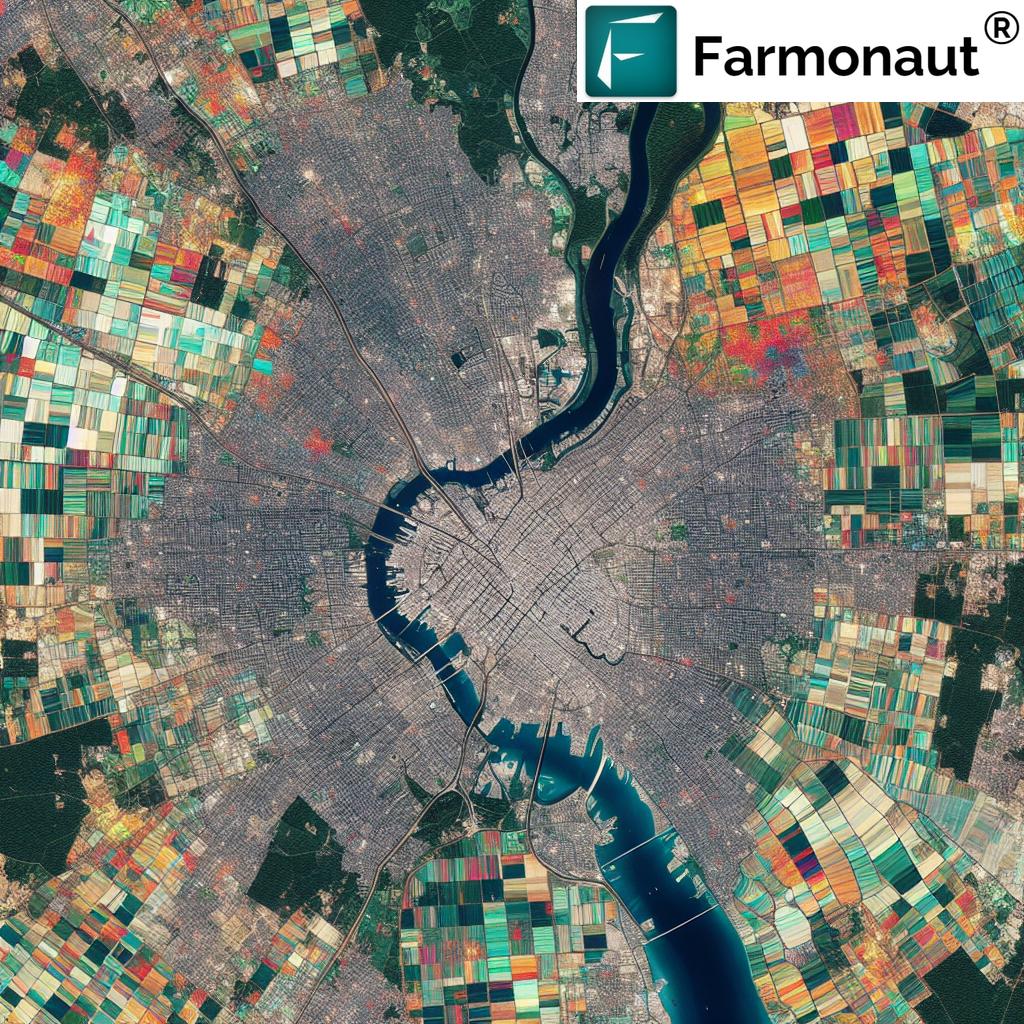
NDBI Satellite Imagery and Urban Land Use Monitoring
The success of Normalized Difference Built-up Index in detecting urban transformation hinges on advanced, multi-spectral satellite imagery. Platforms like Landsat, Sentinel, and proprietary agricultural technology solutions (such as Farmonaut) deliver detailed, up-to-date images covering vast landscapes and critical spectral bands, including SWIR and NIR.
Why Satellite Remote Sensing?
- Wide Coverage: Allows for regional, national, or even global land use analysis, providing a holistic view of urbanization impact on agriculture and forestry.
- Temporal Monitoring: Repeat imagery at regular intervals helps track urban sprawl, agricultural field changes, and forest conversion over time.
- High Objectivity: Satellite-based monitoring reduces subjective errors and offers consistent, scientific measurements for environmental assessments.
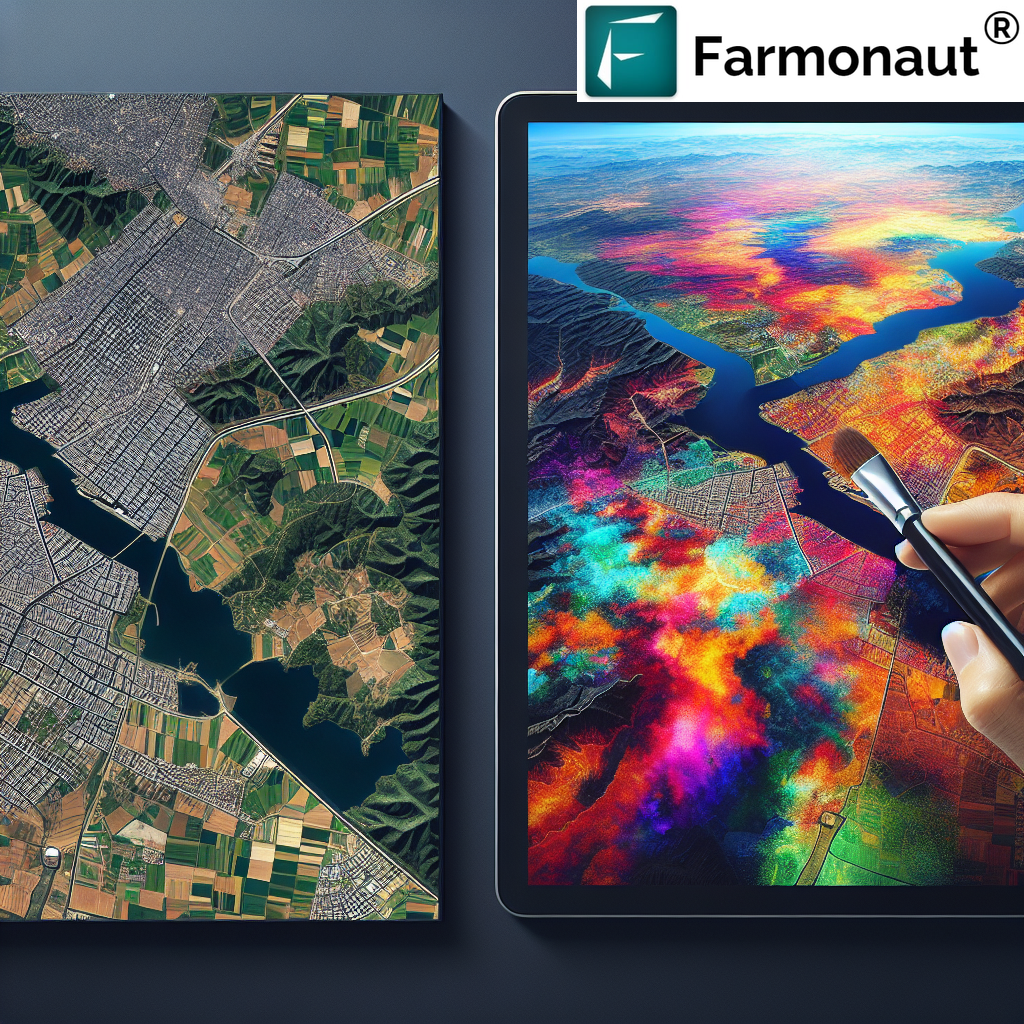
How Are NDBI Maps Produced?
We can generate NDBI maps by processing specific bands (SWIR and NIR) from satellite sensors using remote sensing software or automated platforms like Farmonaut’s Web and Mobile Apps. Modern agricultural technology platforms automate NDVI, NDWI, and NDBI calculations, offering user-friendly visualization and export tools for farmers, planners, and conservationists alike.
Tools for Practitioners:
- Farmonaut: Leverage advanced satellite-based crop and land monitoring directly from your mobile or browser, affordably and efficiently.
- APIs for Satellite Data Access: Integrate NDBI, NDVI, and other spectral index data into custom systems or research pipelines.
- Developer Docs: Access technical documentation for easy API adoption.
Typical Data Pipeline:
- Obtain multi-spectral satellite images covering SWIR and NIR bands.
- Process imagery and calculate NDBI for each pixel/location.
- Visualize or map built-up areas, urban encroachment zones, and land use changes.
- Analyze spatial trends for sustainable development and conservation planning.
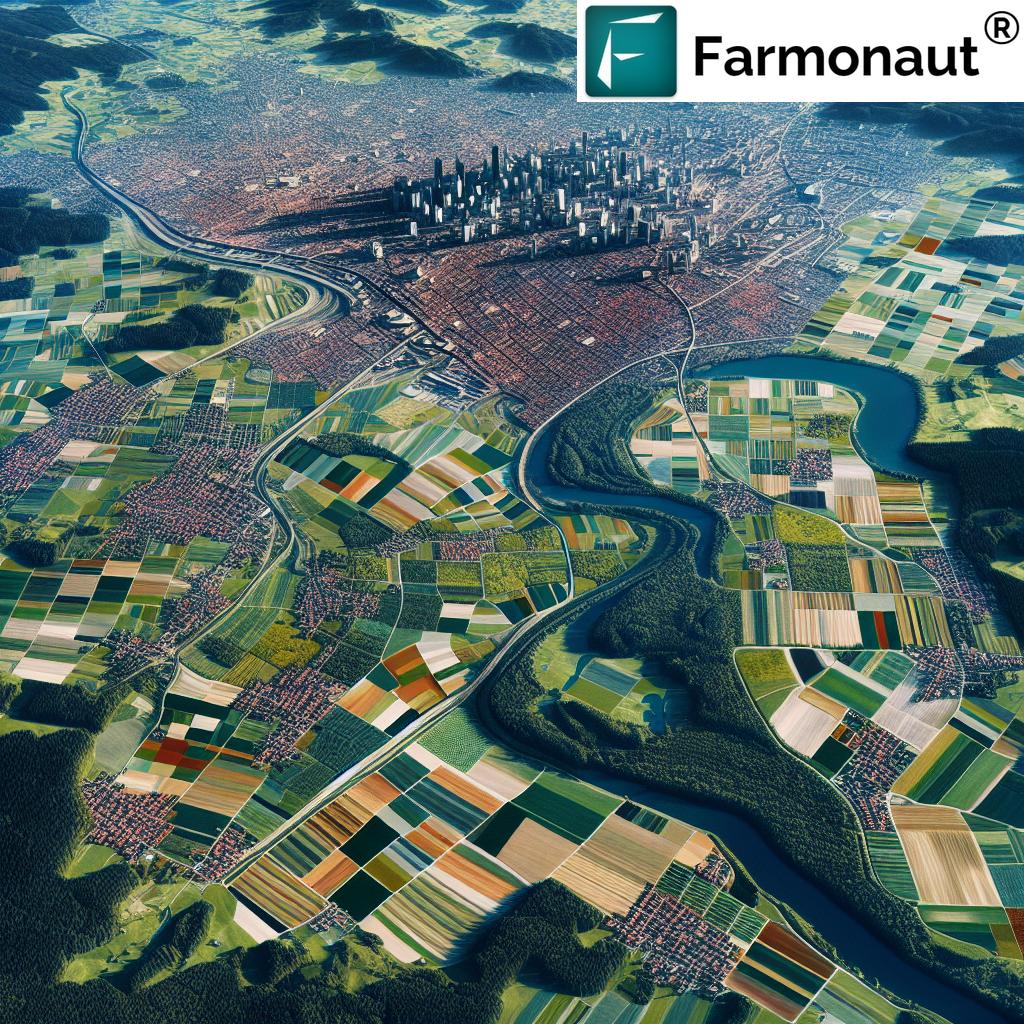
NDBI in Agriculture and Forestry: Tracking Urbanization Impact
Leading-edge remote sensing in agriculture now integrates NDBI satellite imagery to tackle some of the most pressing challenges arising from urbanization. As cities grow, they often encroach on arable land, displacing productive agricultural and valuable forested regions. This not only reduces available farmland but also threatens biodiversity and resource sustainability.
- Urban Encroachment Monitoring: NDBI helps precisely monitor urban encroachment onto agricultural and forested land. Policy-makers, planners, NGOs, and local authorities utilize NDBI maps to quantify lost land, plan buffer zones, and inform urban growth boundaries.
- Quantifying Land Conversion: By comparing NDBI values over time (e.g., annually), we can measure the rate of conversion from natural (vegetation, arable, forest) to built-up environments.
- Assessing Spatial Impact: Studies reveal that NDBI-detected urban land use change can influence up to 30% of surrounding agricultural land in just a decade.
- Sustainable Land Use Planning: Integrating NDBI data supports long-term strategies for balancing urban expansion, agricultural output, forestry conservation, and ecosystem health.
Key Benefits of NDBI for Land Managers:
- Early detection of informal or unplanned urban sprawl.
- Scientific basis for land use policy formation.
- Enabling environmental impact assessments for new development projects.
- Enhancing conservation practices in threatened forested landscapes.
- Strengthening agricultural land preservation initiatives.
Did You Know?
- Farmonaut’s Carbon Footprinting solution can be paired with NDBI for benchmarking and reducing the environmental footprint of farms affected by urbanization!
- Crop Plantation & Forest Advisory Tools allow users to get dynamic, AI-driven recommendations for protecting vulnerable lands.
Top Applications of NDBI: Mapping, Planning, and Conservation
1. Monitoring Urban Encroachment
By analyzing NDBI values and maps over multiple time frames, stakeholders can accurately track urban growth into adjacent agricultural or forested lands. This time-series spatial analysis is essential for rapid detection of at-risk areas.
2. Land Use Change Detection
NDBI supports precise land use change detection by contrasting current land cover with past conditions. Users can quantify how much arable land, vegetation, or forest cover has been lost to urban environments—crucial for reporting, policy-making, and compensation processes.
3. Sustainable Urban and Regional Development Planning
Transport planners, municipal authorities, and conservation organizations rely on NDBI data to inform sustainable growth strategies—balancing the needs for housing, industry, and infrastructure with those for food production and ecosystem services.
4. Environmental Impact Assessments (EIA)
For any major development project, a robust environmental assessment is mandatory. Incorporating NDBI-derived maps ensures better understanding of direct and indirect effects on agricultural and forested lands.
5. Precision Farm Management
Farmers, cooperatives, and agricultural businesses use real-time NDBI and multispectral data via solutions like Farmonaut to optimize resource allocation, avoid encroachment, and anticipate land-at-risk, thus maximizing yield and protecting long-term farmland value.
Farmonaut’s Satellite API:
Integrate real-time NDBI, NDVI, and land use data directly into your farm management system or app!
NDBI Values for Land Cover Types: Urbanization vs. Agriculture Impact
To demonstrate the quantitative power of NDBI satellite imagery, here’s a comparison table showing estimated NDBI values for core land cover types across two time periods (e.g., Year 1 vs. Year 5). This allows us to observe urban encroachment and its impact on natural and agricultural landscapes.
| Land Cover Type | Estimated NDBI Value (Year 1) | Estimated NDBI Value (Year 5) | Observed Change |
|---|---|---|---|
| Urban/Built-Up Area | 0.35 | 0.52 | +0.17 (Urban expansion) |
| Agricultural Fields | 0.07 | -0.02 | -0.09 (Loss to urban area) |
| Forest Patches | -0.12 | -0.22 | -0.10 (Forest reduction) |
| Water Bodies | -0.21 | -0.19 | +0.02 (Slight change) |
As shown above, urban NDBI values rise over time, reflecting city expansion, while agriculture and forest zones exhibit negative or declining values, indicating conversion to built-up areas and loss of natural cover.
Table Legend:
- Urban/Built-Up: Highest positive NDBI, rapid increase indicates city/factory/housing growth.
- Agricultural Fields: Mid to slightly positive/negative, shift to negative with urban expansion.
- Forest Patches: Strongly negative, further decline as forests shrink.
- Water Bodies: Strong negative values, little change unless shoreline is developed.
Valuable Farmonaut Services Supporting Land Use Monitoring
-
Farmonaut AI Advisory and Jeevn System:
Receive personalized strategies for sustainable crop and land management, including risk predictions tied to large-scale farm and land cover monitoring. -
Resource & Fleet Management:
Reduce costs and environmental impact with intelligent fleet tracking for agricultural logistics and fieldwork. -
Blockchain-based Product Traceability:
Instill consumer trust using Farmonaut’s end-to-end traceability—documenting every stage from farm to shelf. -
Insurance & Loan Verification:
Minimize risk for all stakeholders using satellite-powered crop area estimation for crop loans and insurance.
Limitations and Challenges in NDBI Analysis
While NDBI has revolutionized the detection and tracking of urbanization, some important limitations and challenges must be considered for accurate interpretation:
- Seasonal Variations: Changes in vegetation cover and soil moisture throughout the year can affect the spectral signatures used for NDBI, potentially reducing built-up area detection accuracy during certain seasons.
- Spectral Similarity: Certain natural surfaces, such as bare soil, dry riverbeds, or sparsely vegetated areas, may exhibit spectral reflectance similar to urban features, leading to possible misclassification.
- Cloud and Shadow Effects: Clouds, shadows from buildings, or atmospheric haze can distort satellite imagery, requiring additional pre-processing or data correction steps.
- Resolution Limits: Finer land features (e.g., small farm plots or narrow urban edges) may not be picked up on coarse-resolution imagery. High-resolution satellites or complementary data sets can improve classification.
Nonetheless, when used alongside other indices (NDVI, NDWI) and expert review, NDBI analysis remains a cornerstone for large-scale, cost-effective urban and agricultural monitoring.
Best Practices: NDBI in Sustainable Land Management
- Combine with Other Indices: Use NDBI in tandem with Normalized Difference Vegetation Index (NDVI) and Normalized Difference Water Index (NDWI) for best-in-class landscape classification.
- Regular Updates: Monitor urban sprawl and conversion rates every season for proactive decision-making in urban, agricultural, and forest management.
- Ground-truth Data: Where possible, supplement satellite-derived NDBI maps with on-the-ground assessments to improve classification reliability.
- Automate with Farmonaut: Take advantage of platforms that automate data processing, monitoring, and analytical reporting, making advanced remote sensing technologies accessible for all.
With current advances in machine learning and AI-driven analysis—such as Farmonaut’s Jeevn system—we can now harness NDBI data to automatically flag at-risk zones, instruct farmers about nearby urban encroachment risks, and shape policies for responsible growth.
Practical Example:
If NDBI analysis from your Farmonaut dashboard suddenly flags a positive jump near your farm boundary, you could immediately review the history, inform authorities, and plan mitigative action. That’s decision-making powered by remote sensing in agriculture and forestry.
Frequently Asked Questions (FAQ)
What is the Normalized Difference Built-up Index (NDBI)?
NDBI is a remote sensing metric calculated from satellite imagery using Shortwave and Near Infrared bands. It highlights built-up areas for urbanization monitoring and land use planning.
How does NDBI help agriculture and forestry?
NDBI tracks urban encroachment on agricultural lands and forests. This enables managers to conserve productive areas, design sustainable policies, and balance urban development with environmental preservation.
What are typical NDBI values for various land types?
- Urban/Built-up: 0.2 to 0.7
- Agricultural Fields: ~0.0 (may be slightly positive or negative)
- Forests: -0.1 to -0.3
- Water bodies: Typically < -0.1
What causes errors in NDBI-based urban detection?
- Seasonal variation in crops or vegetation cover
- Spectral similarity between urban surfaces and bare soils
- Cloud/shadow/haze artefacts in imagery
Using multi-season imagery and combining with other indices improves reliability.
Is NDBI analysis affordable and scalable?
Yes! Platforms like Farmonaut make precision agriculture and remote sensing affordable, scalable, and accessible on any device.
Can I automate NDBI via API?
Absolutely. Use the Farmonaut Satellite API for seamless integration into your dashboards, research, or custom applications.
How is NDBI different from NDVI?
NDVI targets vegetation health using NIR and Red bands. NDBI specifically highlights built-up/urban areas using SWIR and NIR bands, making them complementary tools for landscape monitoring.
Conclusion: Driving Sustainability Through Remote Sensing
The Normalized Difference Built-up Index is a cornerstone of modern urban land use monitoring, unlocking new possibilities for data-driven sustainable development and conservation. By combining advanced NDBI satellite imagery, AI tools, and accessible platforms like Farmonaut, we can:
- Quantitatively track urbanization’s impact on agriculture and forestry
- Mitigate risks from urban encroachment
- Safeguard natural resources and ecosystem services
- Support informed sustainable land management practices at any scale
As we look to the future, remote sensing in agriculture and forestry will remain at the forefront of addressing the global challenges of urban growth, food security, and environmental sustainability.