

Reviewed August 2026 against USDA AMS price reporting (via University of Illinois farmdoc), the World Bank Commodity Markets Outlook, and CF Industries and Nutrien filings.
Try it: Nitrogen cost per acre, per bushel, and against corn →
Nitrogen Fertilizer Manufacturers: Who Makes What, Where
Four publicly traded companies dominate United States nitrogen fertilizer manufacturing — CF Industries, Nutrien, CVR Partners and LSB Industries — alongside privately held Koch Fertilizer and the North American arms of foreign producers. The plants are not spread evenly: the U.S. Geological Survey’s Mineral Commodity Summaries 2026 nitrogen chapter, published January 2026, counted 38 ammonia plants run by 18 companies across 19 states, with about 57% of national ammonia capacity sitting in Louisiana, Oklahoma and Texas, because ammonia is made from natural gas and that is where the gas is. Globally, China produces roughly a quarter of all fertilizer nutrients; the United States ranks fourth in ammonia behind China, India and Russia.
That is the short answer. The rest of this page gives you the plant-level geography, the capacity figures with their filing sources, the production-by-country picture, what nitrogen actually cost per ton and per acre through the 2026 crop year, and — most usefully — the exact documents to pull so you can refresh every number here yourself.
What this page covers
- The named U.S. nitrogen fertilizer manufacturers and their disclosed capacity
- Where fertilizer is manufactured — state concentration and why
- How production works: ammonia first, then urea, UAN and nitrates
- Nitrogen fertilizer production by country and the export chokepoint
- Prices through 2026, with a per-acre calculator
- A repeatable method for sizing the nitrogenous fertilizer market yourself
The nitrogen fertilizer manufacturers, with capacity and sources
“Nitrogen fertilizer manufacturer” almost always means an ammonia producer. Ammonia is the parent molecule; urea, UAN solution, ammonium nitrate and ammonium sulfate are all upgrades of it. So capacity is quoted on a gross ammonia basis, and that is the number to compare.
| Manufacturer | Nitrogen production sites | Disclosed gross ammonia capacity | Primary feedstock | Where to verify |
|---|---|---|---|---|
| CF Industries (NYSE: CF) | 9 nitrogen complexes — 6 in the United States, 2 in Canada, 1 in the United Kingdom | Nearly 10.5 million tons per year | Natural gas | Company newsroom and 10-K, Item 2 Properties |
| Nutrien (NYSE/TSX: NTR) | 11 production and upgrade facilities in the US and Canada, plus Point Lisas, Trinidad | 7.3 million tonnes nameplate | Natural gas | Nutrien nitrogen business page; annual report |
| CVR Partners (NYSE: UAN) | Coffeyville, Kansas; East Dubuque, Illinois | Not stated on the public site — read the 10-K | Petroleum coke gasification (Kansas); natural gas (Illinois) | SEC EDGAR, form 10-K |
| LSB Industries (NYSE: LXU) | Cherokee, Alabama; El Dorado, Arkansas; Pryor, Oklahoma | Not stated on the public site — read the 10-K | Natural gas | SEC EDGAR, form 10-K |
| Private and foreign-parent producers (Koch Fertilizer, Yara North America, Dyno Nobel, Simplot and others) | Plants across the Gulf Coast, Corn Belt and Great Plains | Not filed with the SEC | Natural gas | State air-permit records (Title V) and company sites |
Two of those capacity numbers come straight from the companies. CF Industries states in its own fertilizer pricing FAQ that its nine complexes carry nearly 10.5 million tons of gross ammonia capacity, that it spends about $500 million a year on capital improvements, that it invested more than $5 billion between 2012 and 2016 to lift capacity 25%, and that it has a $3.7 billion U.S. ammonia plant planned. Nutrien describes itself as the world’s third-largest nitrogen producer at 7.3 million tonnes of gross ammonia nameplate capacity, with North America accounting for roughly 85% of nitrogen sales volumes and about 5,600 owned or leased railcars moving product.
Utilisation separates the operators more than nameplate does. CF reported 97% gross ammonia utilisation for 2025 and a five-year average of 96%. Nutrien’s full-year 2025 results put its ammonia operating rate at 92% for the year, a four-percentage-point improvement excluding Trinidad and Joffre. Against that, USGS put the average across all active U.S. ammonia plants at about 80% of rated capacity in 2025 — which tells you how wide the spread is between best-in-class complexes and the tail of the fleet.
How to check any manufacturer’s real capacity
- Search SEC EDGAR by company name and open the most recent 10-K. Item 2, “Properties,” lists each plant and its daily or annual capacity.
- Cross-check against the quarterly production tables in the 10-Q, which report actual tons made — capacity and production are rarely the same.
- For private producers, request the plant’s Title V air permit from the state environmental agency. Permitted throughput is a hard number.
- For the national picture, pull the nitrogen chapter of the USGS Mineral Commodity Summaries. It is republished every January by the National Minerals Information Center, so the plant count, state concentration and utilisation figures above are refreshed annually.
Where is fertilizer manufactured?
Nitrogen plants follow cheap natural gas. More than 70% of the variable cost of making ammonia is the gas itself, according to CF Industries, so siting is an energy decision rather than an agricultural one. University of Illinois farmdoc’s primer on synthetic nitrogen fertilizer in the U.S. identifies Louisiana, Oklahoma and Texas as the primary ammonia-producing states for exactly this reason, and USGS quantifies it at about 57% of national capacity in those three states as of the January 2026 edition.
That creates a structural mismatch. Nitrogen is made on the Gulf Coast and in the southern Plains; it is consumed in the Corn Belt. Product moves north by pipeline, barge, rail and truck, which is why Nutrien’s railcar fleet is a competitive asset and why spring logistics, not manufacturing, is often the binding constraint. Imports fill the seasonal peak: farmdoc’s March 2026 analysis of the Middle East energy attacks notes the United States imports about 18% of the nitrogen it consumes and produces more than 80% domestically — against 97% import reliance for potassium and 13% for phosphate.
The import share has moved a long way. farmdoc’s July 2025 review of the U.S. fertilizer industry in global markets put net import reliance for nitrogen at 5.5% in 2024, down from more than 20% in 2000, with Trinidad and Tobago and Canada as the main sources. The gap between 5.5% net and 18% gross is real, not a contradiction: the United States exports nitrogen too, and the net figure cancels the flows. Which number you want depends on the question — gross imports tell you about spring availability, net reliance tells you about structural dependence. For background on domestic output, see our overview of whether the US produces its own fertilizer.
Production of nitrogen fertilizer: what actually happens in the plant
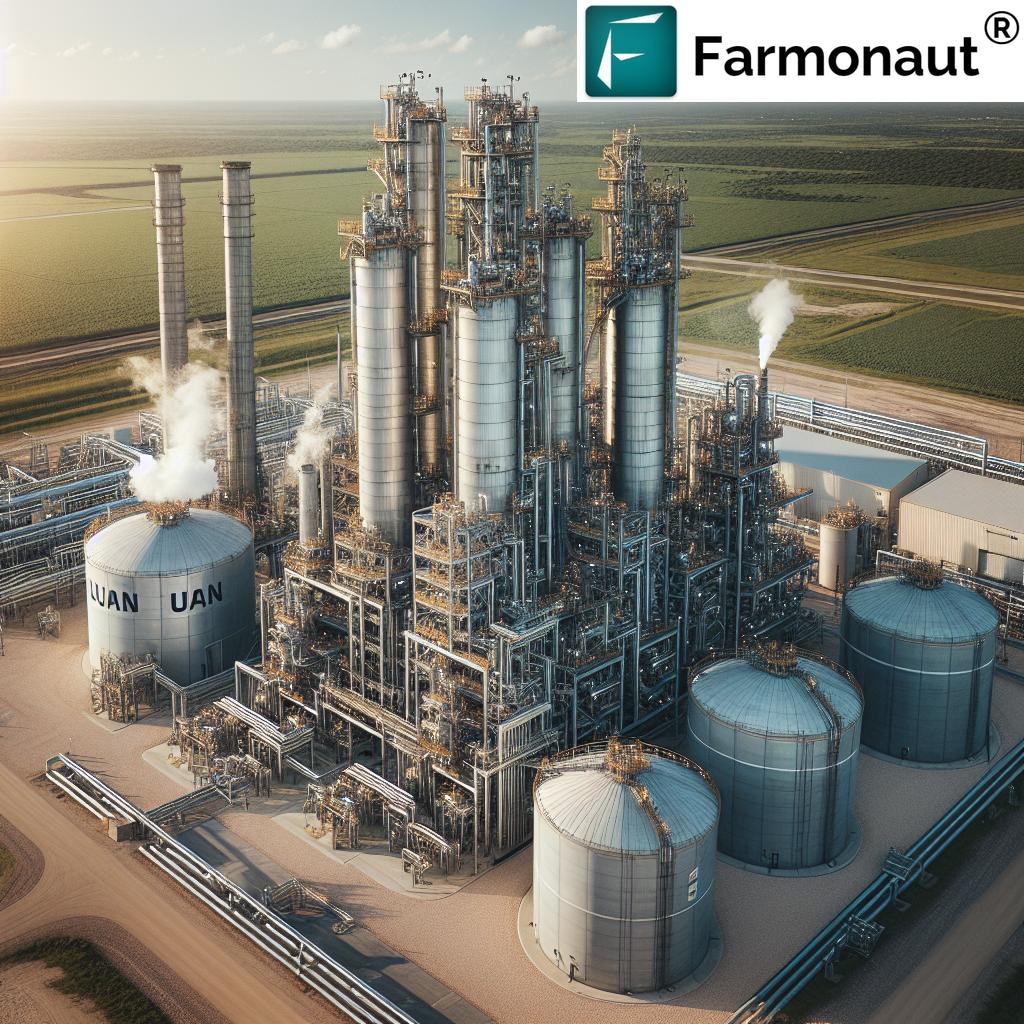
Every synthetic nitrogen fertilizer starts with the same step. Hydrogen is stripped from a feedstock, combined with nitrogen pulled from the air, and reacted under high temperature and pressure into ammonia. Almost all U.S. plants get their hydrogen by steam-reforming natural gas. One does not: CVR Partners’ Coffeyville, Kansas plant is, per CVR Energy, the only nitrogen fertilizer operation in North America using a petroleum coke gasification process to make hydrogen, while its East Dubuque, Illinois plant runs on natural gas. That is what a “dual-train gasifier complex” refers to, and it matters commercially: a pet-coke plant is insulated from the gas price swings that set everyone else’s cost floor.
From ammonia to the product in the tank
- Anhydrous ammonia (82% N) — sold as-is for direct injection. Highest nitrogen concentration per ton, so the cheapest way to buy a pound of N, and the reason Corn Belt growers pay for the handling equipment.
- Urea (46% N) — ammonia plus carbon dioxide. Granulated, storable, shippable worldwide. This is the globally traded nitrogen product and therefore the one that sets the international price.
- UAN solution (28% or 32% N) — urea and ammonium nitrate dissolved in water. Lower concentration, but it flows through sprayers and fertigation, which suits split applications and variable-rate work.
- Ammonium nitrate and ammonium sulfate — smaller volumes, plus significant industrial and mining demand.
USGS reported that about 88% of U.S. ammonia production went to fertilizer use in 2025, with urea the largest derivative by quantity. The remaining 12% goes to explosives, plastics, nitric acid and emissions control — which is why nitrogen manufacturers are not purely agricultural businesses and why their filings separate agricultural from industrial volumes. Interest in low-carbon routes is concrete rather than theoretical: LSB Industries is retrofitting carbon capture at El Dorado, Arkansas, and Nutrien has evaluated a clean ammonia plant at Geismar, Louisiana. If you want the wider picture of how process change reaches the field, see our piece on production technology in agriculture.

Nitrogen fertilizer production by country
Global ammonia output runs at approximately 200 million tons a year, per CF Industries. Production is concentrated, and so — far more sharply — is export capacity. Those are two different concentrations, and confusing them is the most common error in reading this market.
| Measure | Figure | Source and vintage |
|---|---|---|
| China’s share of world fertilizer nutrient production | About 25% | farmdoc, July 2025 |
| Russia’s share | Under 10% | farmdoc, July 2025 |
| United States share | Under 10% | farmdoc, July 2025 |
| Top five producers combined (China, Russia, US, India, Canada) | Over 60% | farmdoc, July 2025 |
| US ammonia rank | Fourth, behind China, India and Russia | USGS, January 2026 edition |
| US nitrogen output, nutrient basis | About 14 million metric tons of N | USGS estimate for 2025; farmdoc gives the same order for 2024 |
| Share of nitrogen production that crosses a border | 10–15% | farmdoc, July 2025 |
The one number sources disagree on
How much of globally traded urea comes out of the Gulf? You will find three different answers, and all three are defensible:
- About one quarter of global urea exports from the Middle East — World Bank, May 2026.
- About 35% of globally traded urea and 30% of traded ammonia — CF Industries, 2026 pricing FAQ.
- Nearly 49% of global urea exports and roughly 30% of ammonia exports from the Persian Gulf specifically — farmdoc, March 2026.
The spread comes from geographic definition (Middle East versus Persian Gulf), from whether ammonia and urea are pooled, and from the base year. No AI summary will flag that for you; it will pick one and state it flatly. If you are making a purchasing or hedging decision, use the widest of the three as your risk case.
Nitrogen fertilizer prices, and what set them in 2026
Before 2020, farmdoc’s Illinois series had anhydrous ammonia averaging just under $650 per ton, urea around $440 and 28% liquid nitrogen around $300. By 8 August 2025, those had reached $786, $594 and $431 per ton respectively — 6%, 10% and 20% above the same week of 2024, per the fertilizer decisions for the 2026 crop year analysis, which also put nitrogen at $0.48 per pound of N and an anhydrous-to-corn price ratio of 0.11.
Then supply broke. Attacks on Middle East energy infrastructure in mid-March 2026 removed a large slice of Gulf nitrogen export capacity — farmdoc estimated a 17% cut to Qatar’s LNG export capacity and a three-to-five-year rebuild timeline — while China’s ban on urea, MAP and DAP exports ran through August 2026. Urea export prices jumped roughly 40%, from under $500 to over $700 per metric ton. The World Bank recorded urea above $850 per metric ton in April 2026, an 80% rise since February 2026 and the highest level since April 2022, with its fertilizer price index up 12% in the first quarter of 2026.
For a grower, the number that matters is per acre. farmdoc’s May 2026 study of fertilizer cost increases resulting from the conflict put total fertilizer cost on high-productivity central Illinois corn at $190 per acre before the disruption and $217 after on an anhydrous programme, or $205 rising to $227 on a 28% solution programme. Soybeans moved only $85 to $87, because they fix their own nitrogen — a reminder that a nitrogen shock is a corn, wheat and cotton problem far more than a soybean one. Phosphate and potash barely budged: DAP rose 0.9% to $870 and potash 2% to $505.
Run your own numbers rather than borrowing an Illinois average.
Nitrogen cost per acre, per bushel, and against corn

Sizing the nitrogenous fertilizer market without buying a report
Market-research summaries quote a global figure and a growth rate and rarely show their working. You can build a defensible estimate from free public data in four steps, and it will survive whatever the headline number does.
- Start from volume, not value. Global ammonia output is around 200 million tons a year (CF Industries), with roughly 88% of U.S. production going to fertilizer (USGS). Apply a comparable fertilizer share to get the nitrogen fertilizer tonnage.
- Attach a traded price. Use the urea line in the World Bank Commodity Markets Outlook and its monthly price data, which is republished every month. Urea is the benchmark because it is the most traded nitrogen product.
- Separate domestic from traded value. Only 10–15% of nitrogen production crosses a border (farmdoc), so a price index built on export quotations describes a minority of tonnes. Domestic markets clear at delivered retail — for the United States, that is the USDA AMS regional production cost reports.
- Sanity-check with revenue. Sum the nitrogen segment results of the listed producers. Nutrien's nitrogen adjusted EBITDA was $2.15 billion in 2025, up from $1.88 billion in 2024. CF Industries reported full-year 2025 net earnings of $1.46 billion, or $8.97 per diluted share, on adjusted EBITDA of $2.89 billion, with $1.79 billion of free cash flow and 16.6 million shares repurchased for $1.34 billion. If your market estimate cannot accommodate those, it is wrong.
For US consumption by nutrient and by crop, USDA's Fertilizer Use and Price data product is the reference series, with 32 tables covering 1960 onward — though note that individual tables end in different years (consumption through 2015, use by crop through 2018), so check the vintage of the specific table before quoting it. For state-level nitrogen purchased, EPA republishes the AAPFCO Commercial Fertilizer Purchased series.
What would change the picture
Three levers move nitrogen supply and price, and each one is trackable.
Natural gas. Nutrien reported natural gas at $3.53 per MMBtu across its nitrogen operations in 2025. EIA's January 2026 Short-Term Energy Outlook forecast Henry Hub just under $3.50 per MMBtu for 2026, a 2% decline, then just under $4.60 per MMBtu in 2027 — a 33% rise driven by LNG export demand. Since gas is over 70% of ammonia's variable cost, that 2027 forecast is the single most important number for North American nitrogen cost in the coming crop years. EIA reissues the STEO monthly.
Capacity, which is slow. CF Industries states that new nitrogen fertilizer capacity takes at least three to four years to build. So a supply shock cannot be answered by construction; it is answered by utilisation, inventory and trade reallocation.
Individual plant outages. These are large enough to show up in national statistics. Nutrien's 2026 nitrogen sales volume guidance of 9.2 to 9.7 million tonnes is below its 2025 actual specifically because Trinidad (1.4 million tonnes) and New Madrid (0.2 million tonnes) come out of the base.
Demand moves too, and USDA measures it directly. The NASS Acreage report of 30 June 2026 put corn plantings at 95.3 million acres, down 3% from 2025, with soybeans up 5% at 85.4 million acres and all wheat down 6% at 42.7 million. Corn and wheat acres down, soybean acres up, is a demand-negative mix for nitrogen — worth holding against the supply-side news when you read a price forecast.

The lever growers actually control: rate and placement
You cannot influence a Gulf Coast gas contract. You can influence how many pounds you apply and where. At the August 2025 price point, farmdoc's MRTN guidance pointed to 180 lb of N per acre in northern and central Illinois and 200 lb in southern Illinois — economically optimal rates that shift as the nitrogen-to-crop price ratio changes. When ammonia moves from $828 to $1,123 per ton, the optimum rate falls, and so does the tolerance for uneven application.
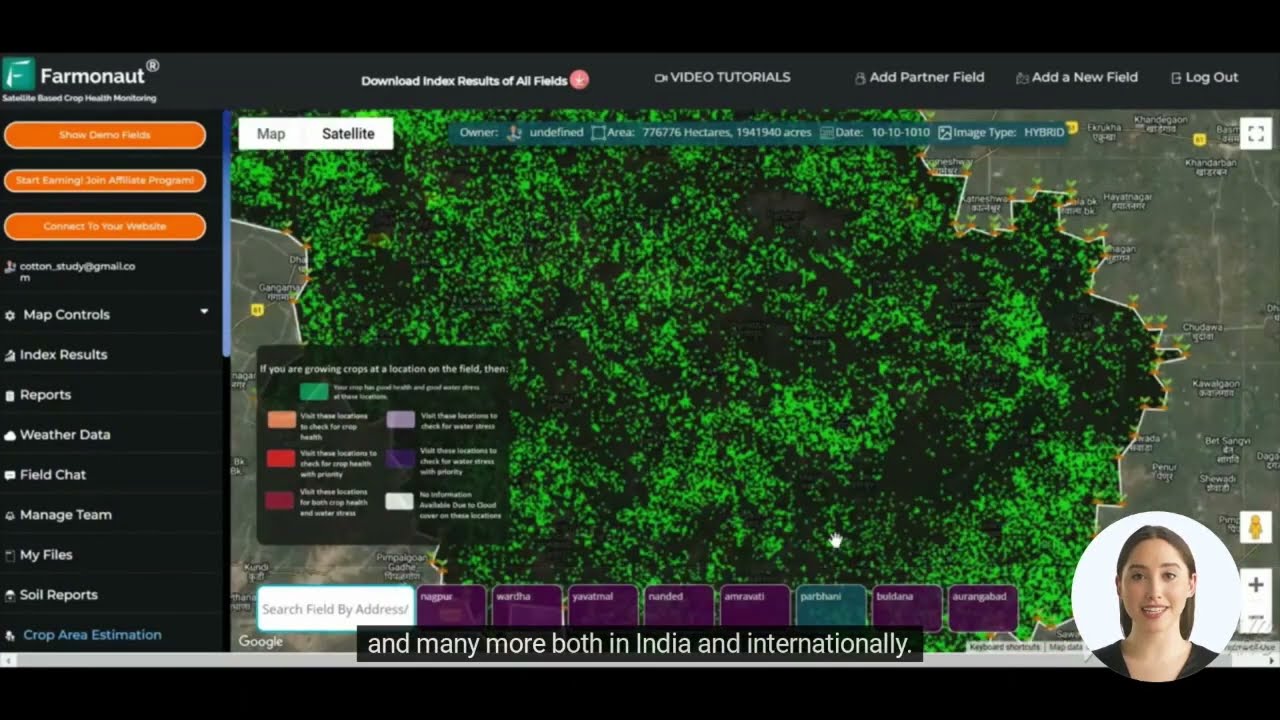
Satellite monitoring is how that gets managed at field scale. Farmonaut's satellite-based crop monitoring tracks vegetation and nitrogen-related indices across a field over time, so in-season variation shows up as a map rather than a hunch — useful for split applications, for judging whether a side-dress is warranted, and for spotting the zones where extra nitrogen will not pay. Larger operations can pull the same layers into agronomy or ERP systems through the Farmonaut API, and field staff can work from the Android app or iOS app. For grassland and pasture programmes specifically, see our guide to nitrogen fertilizer for grass, and for the wider agronomic sequence, steps in farming to boost crop yield.
There is an environmental dimension with the same arithmetic behind it. Nitrogen that does not reach the crop reaches water. EPA tracks commercial fertilizer purchased by state precisely because fertilizer is a primary source of nitrogen entering water systems through runoff and infiltration — the same reasoning that drives scrutiny of extractive industry environmental impacts. Cutting over-application is the rare measure that reduces cost and loading at once.
Frequently asked questions
- Who is the largest nitrogen fertilizer manufacturer?
By disclosed gross ammonia capacity among listed producers, CF Industries is the largest in North America at nearly 10.5 million tons a year across nine complexes. Nutrien describes itself as the world's third-largest nitrogen producer at 7.3 million tonnes of nameplate capacity. Neither is the largest globally — Chinese state-linked producers are, and they do not file with the SEC. - Where is nitrogen fertilizer manufactured in the United States?
Across 38 plants in 19 states, per the USGS January 2026 nitrogen chapter, with about 57% of capacity in Louisiana, Oklahoma and Texas. Named sites include Coffeyville, Kansas and East Dubuque, Illinois (CVR Partners) and Cherokee, Alabama, El Dorado, Arkansas and Pryor, Oklahoma (LSB Industries). - Which country produces the most nitrogen fertilizer?
China, at roughly a quarter of world fertilizer nutrient production. USGS ranks the United States fourth in ammonia, behind China, India and Russia. - Why did nitrogen fertilizer prices rise in 2026?
Mid-March 2026 attacks on Middle East energy infrastructure cut Gulf nitrogen export capacity while China's urea, MAP and DAP export ban ran through August 2026. Urea passed $850 per metric ton in April 2026, up 80% from February 2026 — the highest since April 2022, per the World Bank. - How much does nitrogen cost per acre of corn?
farmdoc put total fertilizer cost on high-productivity central Illinois corn at $217 per acre after the disruption, against $190 before, on an anhydrous programme. Use the calculator above with your own delivered price and rate — the AMS regional production cost report for your state is republished twice monthly. - Are new nitrogen plants being built?
Yes, but slowly. CF Industries has a $3.7 billion U.S. ammonia plant planned and states that new nitrogen capacity takes at least three to four years to build. Carbon capture retrofits at existing plants, such as LSB's El Dorado project, arrive sooner than greenfield capacity.
Earn With Farmonaut: Affiliate Program
Earn 20% recurring commission with Farmonaut's affiliate program by sharing your promo code and helping farmers save 10%. Onboard 10 Elite farmers monthly to earn a minimum of $148,000 annually—start now and grow your income!
Farmonaut Subscriptions



Every figure on this page carries a date and a source that republishes on a schedule: USGS nitrogen statistics each January, USDA AMS production cost reports twice monthly, EIA's Short-Term Energy Outlook monthly, the World Bank's commodity price data monthly, and quarterly filings from CF Industries, Nutrien, CVR Partners and LSB Industries. Pull the fresher number, run it through the calculator, and the analysis holds.
Discussion
Questions, corrections or field experience? Share them below. First-time comments are reviewed before they appear, and your email is never published.
No comments yet. Be the first to add a question or your experience.

 Yutz Automation
 AgroGreen Dynamics
 Leher
Leher AgroRisk
 Oath Inc
 Reddane Farming
 Esri North East Africa
 Cresol
 Atur Kuliner
 MDCV UK
 Zerella Group
 Etech Consulting Madagascar
 Vestlandsforsking
 Delicio
 WB Dev
 Sama Premium
 Prochecker
 Tres Valles
 LACOS Geoinformation
 Magrifly
 LatConnect 60
 Blickwinkel
 Agricultural Credit Policy Council
