
NDWI Interpretation: 7 Ways to Enhance Water Monitoring
Table of Contents
- Introduction: The Power of NDWI Interpretation
- Understanding NDWI: An Essential Water Monitoring Metric
- NDWI Interpretation: 7 Ways to Enhance Water Monitoring
- Comparative Table: NDWI-based Water Monitoring Techniques
- Applications in Agriculture and Forestry
- Challenges in NDWI Interpretation
- Best Practices for Utilizing NDWI
- Future Trends in NDWI Application
- How Farmonaut Empowers NDWI-Based Precision Agriculture
- FAQ: NDWI and Water Monitoring
- Conclusion: Towards Sustainable Water Management
“NDWI can detect water stress in crops with up to 90% accuracy using satellite imagery.”
Introduction: The Power of NDWI Interpretation
In today’s world of advanced remote sensing, the Normalized Difference Water Index (NDWI) stands as one of the most effective indices for real-time water monitoring, vital for agriculture, forestry, and farm management. Whether it’s managing a crop plantation in Tamil Nadu, ensuring forest vitality, or improving irrigation scheduling on a large commercial farm, NDWI offers a comprehensive, data-driven approach to assess and enhance water content and distribution across various landscapes.
Improved water resource management directly impacts crop health, yields, forest sustainability, and even national food security. By leveraging the power of satellite imagery and advanced analytics, we are in an era where every farm and forest can benefit from precision NDWI interpretation—optimizing resources while adapting to climate change and increasing agricultural productivity.

“Remote sensing advancements have improved forest water monitoring efficiency by over 60% in the past decade.”
Understanding NDWI: An Essential Water Monitoring Metric
The Normalized Difference Water Index (NDWI) is a critical remote sensing index for quantifying water content in plant vegetation and soil—a process called soil moisture analysis from satellite data. As global agriculture adapts to new environmental challenges like drought and erratic weather due to climate change, NDWI’s role in water monitoring has never been more important.
What is NDWI?
NDWI, developed to enhance the detection and monitoring of water content via satellite imagery, sets itself apart from other vegetation indices for precision agriculture by directly focusing on infrared bands—specifically the NIR (Near-Infrared) and SWIR (Short-Wave Infrared) segments of the electromagnetic spectrum.
NDWI Calculation Formula
NDWI is calculated using a simple normalized difference formula:
- NIR: Near-Infrared reflectance value (highly sensitive to leaf and crop structure, indicating plant health and water content)
- SWIR: Short-Wave Infrared reflectance value (sensitive to leaf water content)
NDWI ranges from -1 to +1. Higher positive values indicate higher vegetation water content or presence of surface water. Lower or negative values suggest water stress, drying soil, or inadequately irrigated crops.
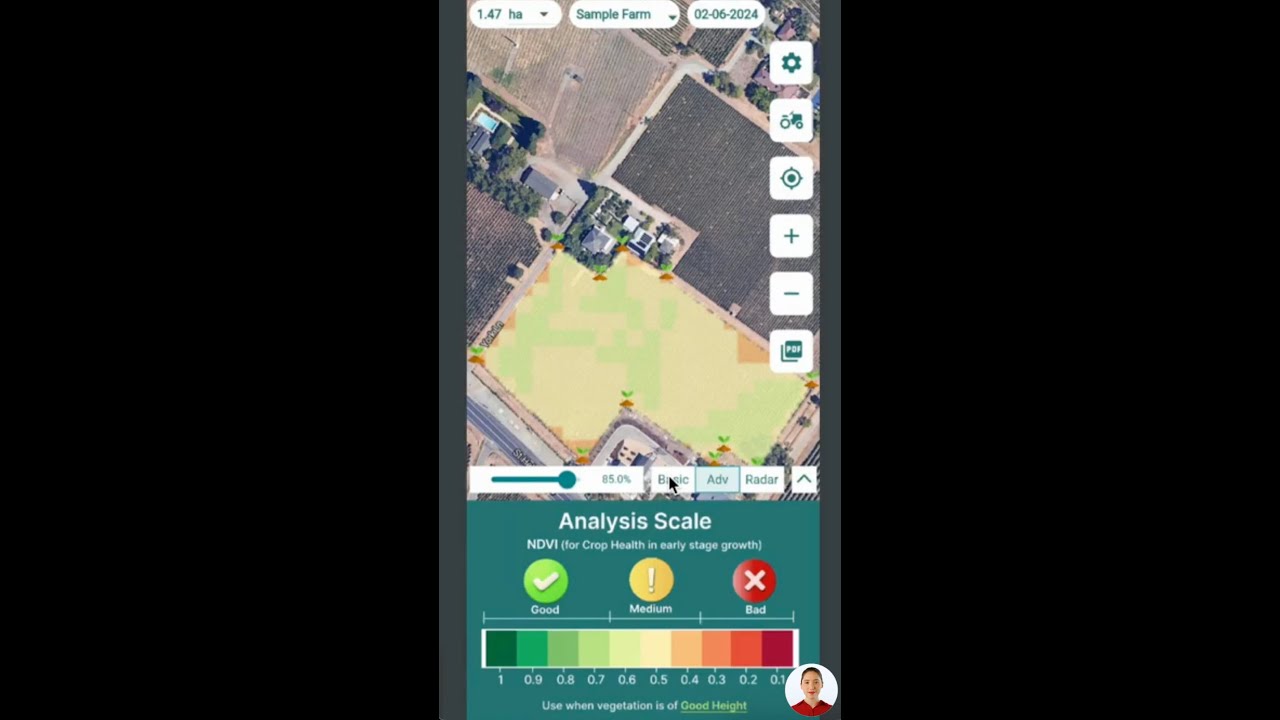
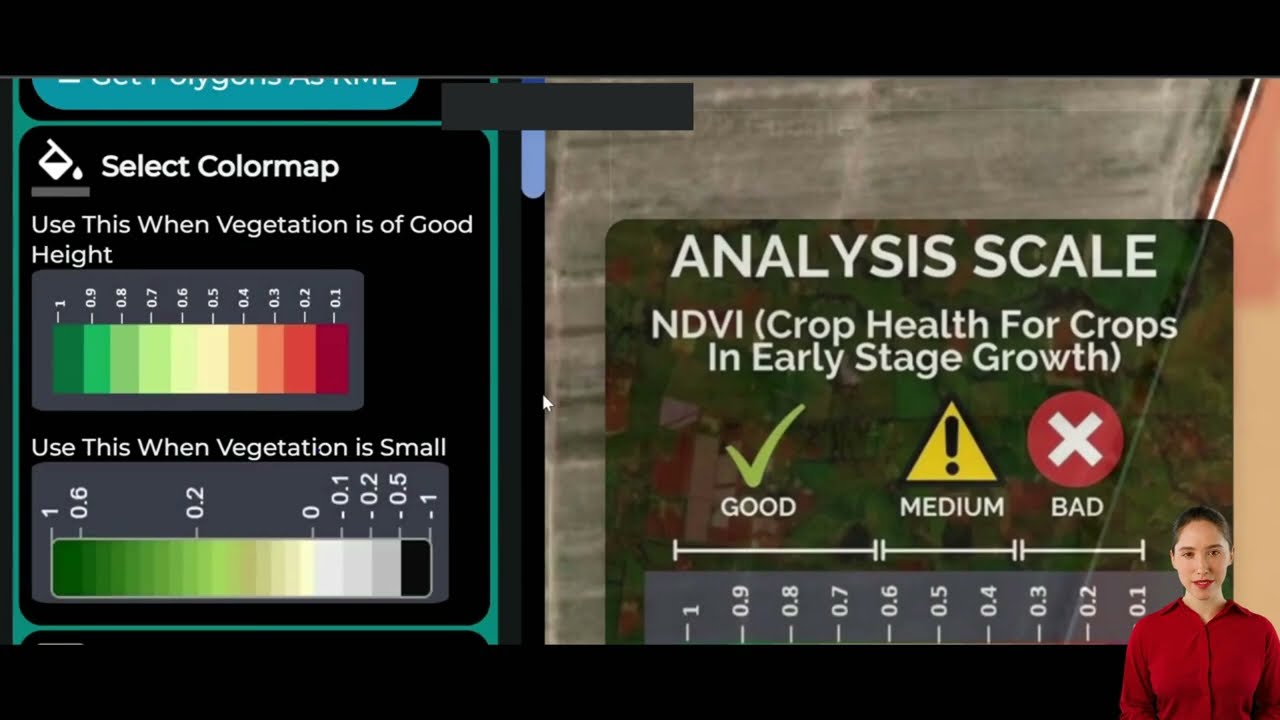
- NDWI > 0.2: High water content, healthy vegetation, or visible water bodies
- NDWI between -0.1 and 0.2: Moderate water content, may need closer monitoring
- NDWI < -0.1: Water stress, risk of drought, potential irrigation problems
By analyzing NDWI over time and at scale with satellite data, we can now monitor changes in crop water status, detect stress, and swiftly implement interventions to prevent yield loss and enhance productivity.
NDWI Interpretation: 7 Ways to Enhance Water Monitoring
NDWI is more than just a number; it is a powerful tool—guiding critical decisions in crop management, irrigation, drought mitigation, and forest assessment.
1. Crop Health Monitoring Using NDWI
The most prevalent application of NDWI is for detecting water stress in agriculture (sometimes referenced as “ndwi for crop monitoring”). By continuously monitoring NDWI values across fields, farmers can pinpoint areas experiencing stress due to drought, insufficient irrigation, or disease.
- Enables real-time interventions—such as targeted irrigation or pesticide application
- Prevents yield loss and optimizes productivity
- Supports sustainable water use and promotes ecosystem balance
This targeted approach is a cornerstone of precision agriculture, allowing for better resource conservation and healthier crops.


2. Precise Irrigation Management with NDWI
Integrating NDWI with other indices such as NDVI (Normalized Difference Vegetation Index) refines the satellite imagery for irrigation management. Combining these allows for:
- Mapping irrigation needs and scheduling water application more efficiently
- Reducing water waste and input costs (“applying water only where and when it’s needed”)
- Improving crop health, resource conservation, and farm sustainability
Platforms like Farmonaut integrate these indices to deliver actionable insights for field-level irrigation scheduling. See our Large Scale Farm Management Solutions, which assist administrators in interpreting satellite NDWI data for optimized irrigation and yield prediction.
3. Drought Monitoring with Remote Sensing
Timely drought assessment is critical for both farmers and policy makers. With consistent NDWI time series analysis in agriculture:
- Detect drought patterns by observing declining NDWI values
- Develop drought mitigation strategies (e.g., resource redistribution, crop switching)
- Ensure sustainable water use, limiting environmental and economic losses
NDWI, when combined with tools like Satellite-Based Crop Loan and Insurance Verification, empowers financial institutions to assess drought risks and validate farm conditions with higher accuracy.

4. Forest Health Assessment Using NDWI
Healthy forests are crucial for ecosystem balance, carbon sequestration, and biodiversity. NDWI is invaluable for early detection of water stress in forest areas; it helps in:
- Identifying early signs of drought stress and reducing wildfire risks
- Maintaining forest vitality at both the canopy and regional scale
- Enabling better resource allocation and restoration measures
Explore how our Crop Plantation & Forest Advisory Services combine NDWI, NDVI, and AI to monitor forest health and support conservation goals.

5. Soil Moisture Analysis from Satellite Data
Combining NDWI with other indices allows farmers and agronomists to track soil moisture conditions remotely:
- Facilitates seasonal planning by tracking moisture before and after planting
- Enables risk assessment for dryness or water-logging in different soil types
- Assists with site-specific fertilizer and irrigation management
6. Time Series Analysis in Agriculture: Tracking Changes Over Time
Performing time series NDWI analysis maximizes decision-making accuracy by:
- Revealing long-term trends in water content and vegetation health
- Highlighting seasonal variations and recurring drought cycles
- Enabling proactive interventions in farm management
Our platform employs NDWI-based time series analysis to empower farmers and advisors with actionable, data-driven insights season after season.
7. Integrating NDWI with Machine Learning for Advanced Insights
Recent trends involve machine learning algorithms to enhance NDWI’s predictive power:
- Improves interpretation accuracy by calibrating for local conditions, seasonal variations, and mixed pixel challenges
- Facilitates custom advisory systems (like our AI Jeevn Advisory) for field-specific recommendations
- Provides real-time alerts for rapid response to stress detection
To explore NDWI-powered APIs and digital integration, visit our Farmonaut Satellite Data API Page and API Developer Documentation.
Comparative Table: NDWI-based Water Monitoring Techniques
To assist you in making the right choice for your needs, we present a direct comparison of the seven core NDWI interpretation techniques, highlighting their use, detection accuracy, source data, water stress identification capability, and complexity.
| Technique Name | Primary Use | Detection Accuracy (Est. %) | Satellite Data Used | Water Stress Identification | Tech. Complexity |
|---|---|---|---|---|---|
| NDWI-based Crop Health Monitoring | Crop/Farming | ~90% | Multispectral (NIR/SWIR) | Yes | Medium |
| Precise Irrigation Mapping (NDWI + NDVI) | Irrigation | ~88% | Multispectral/NDVI combo | Yes | Medium |
| Drought Trend Analysis (NDWI Time Series) | Agricultural Policy | ~85% | Temporal NDWI Series | Yes | High |
| Forest Health Assessment | Forestry | ~87% | Multispectral/Time Series | Yes | Medium |
| Soil Moisture Detection | Agri/Forestry | ~83% | Multispectral/NDWI+additional indices | Yes | Medium |
| Time Series NDWI Analysis | Agri/Forestry | ~88% | Temporal NDWI, Satellite Serial Data | Yes | High |
| NDWI with Machine Learning | All Sectors | ~92% | Processed Multi-modal Satellite Data | Yes | High |
Applications in Agriculture and Forestry
A. Crop Health Monitoring and Water Stress Detection
The regular monitoring of NDWI forms the backbone of decision-making for farmers facing increasingly erratic water supply and unpredictable climate conditions. This is the essence of water stress detection in agriculture, which is crucial for preventing yield loss and promoting sustainable farming practices.
- NDWI pinpoints areas on the brink of water crisis, detecting even subtle stress before visible symptoms arise on the crop canopy.
- Supports timely interventions—irrigation, fertilizer adjustments, or emergency disease control.
B. Satellite Imagery for Irrigation Management
By integrating NDWI and NDVI from multispectral satellite imagery, precision irrigation scheduling becomes feasible for farms of all sizes. Farmonaut’s platform delivers these advanced insights at a fraction of the traditional hardware cost, with options for single fields or entire regions.
- Optimize irrigation allocation, conserve resources, and avoid water wastage
- Enhance productivity and cut unnecessary expenses
C. Drought Monitoring with Remote Sensing
Changing climate, seasonal weather, and groundwater depletion all drive the fear of drought. With remote sensing and NDWI time series, early warning signs can be flagged instantly—facilities that can literally save crops, communities, and economies.
- Reduce drought-related losses through proactive intervention
- Support policy development and disaster preparedness for governments
D. Forest Health Assessment Using NDWI
Forestry professionals utilize NDWI to monitor forest vitality, spot dry/wilted patches, and manage ecosystem balance—all using only data from satellite bands.
- Prevents forest degradation and helps manage controlled burns
- Protects biodiversity, carbon stores, and local livelihoods
Challenges in NDWI Interpretation
Despite its many strengths, implementing NDWI in real-world water monitoring initiatives involves addressing specific challenges related to accuracy, data quality, and landscape specificity.
1. Atmospheric Interference
Atmospheric conditions or clouds can distort satellite NDWI, leading to errors in analysis. Utilizing advanced atmospheric correction algorithms—as used in Farmonaut’s AI platform—is essential to ensure reliable results.
2. Mixed Pixels
Each satellite pixel may include a mix of land covers (e.g., soil, crops, water bodies). This can yield ambiguous NDWI values. High-resolution imagery plus machine learning-based pixel classification (like those we offer) minimizes this ambiguity.
3. Seasonal Variations
Natural seasonal cycles significantly affect NDWI readings. Implementing NDWI time series analysis and applying local seasonal adjustment techniques ensures that decision-making remains robust year-round.
4. Calibration for Water and Vegetation Types
Different types of water bodies (e.g., lakes versus rivers) or vegetation structure may respond differently to NDWI calculations. Calibrating indices for local geography is important for precise analysis.
Best Practices for Utilizing NDWI
- Regular Assessments: Conduct NDWI regularly to capture real-time changes.
- Combine Indices: Use NDWI along with NDVI and other indices for a comprehensive understanding of crop health and water status.
- Ground Truthing: Validate remote NDWI results with on-ground measurements to improve predictability and accuracy.
- Consider Local Factors: Always account for local climate, soil properties, and crop variety in the interpretation process.
- Time Series Analysis: Prefer NDWI trend analysis over single-date snapshots for more consistent results.
- Integrated Farm Management: Blend NDWI data with overall farm management strategies to boost efficiency.
Future Trends in NDWI Application
- Advanced Machine Learning Integration: Automated anomaly detection and smart advisory with increased detection accuracy and adaptability for unique fields or forest patches.
- Data Fusion: NDWI combined with real-time ground sensors, weather data, and additional indices creates a robust, all-in-one monitoring system.
- Higher Temporal Resolution: With more satellites in orbit, daily (or even sub-daily) NDWI updates are now accessible for more responsive farm management.
- Climate Change Studies: NDWI’s use in climate impact analysis supports adaptation strategies for sustainable farming and forest preservation.
These trends align with Farmonaut’s mission: to make precision agriculture data-driven, affordable, and accessible worldwide.
How Farmonaut Empowers NDWI-Based Precision Agriculture
We at Farmonaut combine satellite imagery, artificial intelligence, and blockchain to deliver transformative solutions for NDWI interpretation and water management globally.
-
Real-time Crop and Forest Health Monitoring:
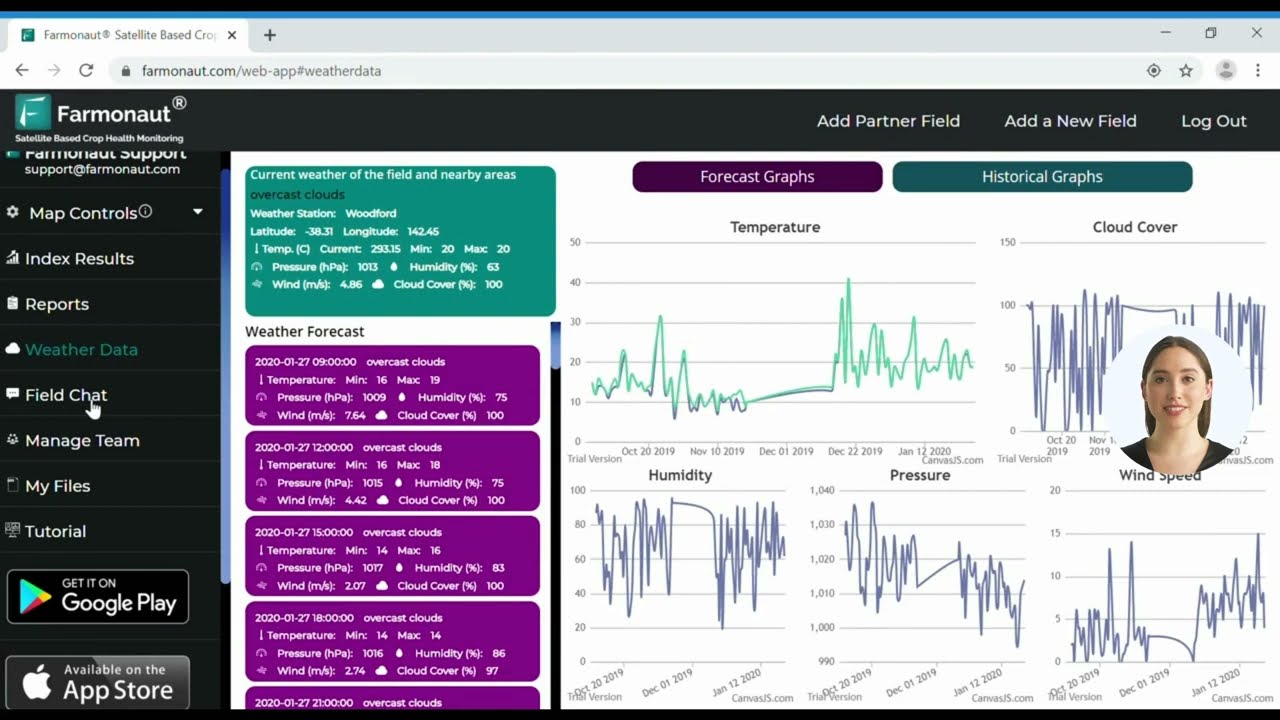
Our platform leverages NDWI, NDVI, and other vegetation indices for crop monitoring, irrigation scheduling, and forest health assessment—all via simple dashboards accessible on Android, iOS, and web. -
Affordable and Scalable Subscriptions:
We make advanced remote sensing accessible to everyone from smallholder farmers to government bodies—with modular pricing and an easy-to-use subscription system. -
AI-Based Advisory:
Our Jeevn AI system analyzes NDWI time series, weather data, and satellite imagery to generate personalized recommendations. -
Data-driven Carbon Footprinting:
We go beyond water monitoring. Our
Carbon Footprinting Solutions
help you track and reduce your environmental footprint for greater sustainability. -
Fleet and Resource Management:
Efficiently manage agricultural machinery with our
Fleet Management Tools,
integrated with crop and water monitoring data.
FAQ: NDWI and Water Monitoring
What is the difference between NDWI and NDVI?
NDWI focuses on water content in vegetation and soil using NIR and SWIR bands, while NDVI assesses vegetation greenness and health using NIR and red bands. Using both indices together enables comprehensive monitoring of both plant vitality and water status.
How is NDWI calculated from satellite data?
NDWI is calculated using the formula:
(NIR - SWIR) / (NIR + SWIR), where NIR and SWIR are near-infrared and short-wave infrared reflectance values, respectively.
What are the typical NDWI values for healthy crops?
Healthy crops usually present NDWI values between 0.2 and 0.5. Values below 0 suggest
water stress, dry soils, or inadequate irrigation.
Can NDWI be used for water body detection?
Yes, NDWI is traditionally used for surface water mapping as water bodies reflect strongly in the NIR and absorb SWIR, ensuring high positive NDWI values.
How frequently should NDWI monitoring be performed?
Regular monitoring—preferably weekly or bi-weekly during the growing season—enables timely interventions, proactive management, and accurate trend analysis.
How do I access NDWI monitoring for my farm?
Use Farmonaut’s satellite monitoring platform to obtain real-time NDWI, NDVI, and crop health reports. Explore our apps and subscription options for more information.
Conclusion: Towards Sustainable Water Management
The Normalized Difference Water Index (NDWI) is central to modern water monitoring and efficient agricultural and forestry management. When implemented strategically—using time series analysis, machine learning, and ground validation—NDWI empowers farmers, agronomists, and foresters to:
- Identify and preempt water stress, defending against drought and crop failures
- Ensure sustainable, data-driven irrigation scheduling and input use
- Protect forests and maximize the vitality of local and global ecosystems
- Adapt to changing climate conditions with scalable, affordable technology
By understanding the formula, applications, and best practices for NDWI interpretation, we collectively move toward a future of precision farming—where every drop of water is counted, every crop is cared for, and every ecosystem can thrive. For robust, field-ready NDWI data, explore Farmonaut’s range of digital tools and APIs today.


