

Land use · Classification guide
Agricultural Land: 5 Types of Use and Classification
Agricultural land is land used for crops or grazing. The US Census of Agriculture counted 880.1 million acres of it in 2022, 45% pasture and 43% cropland. Five land-use types, then the grading systems used in the USA, England, Canada, New Zealand and by the FAO.
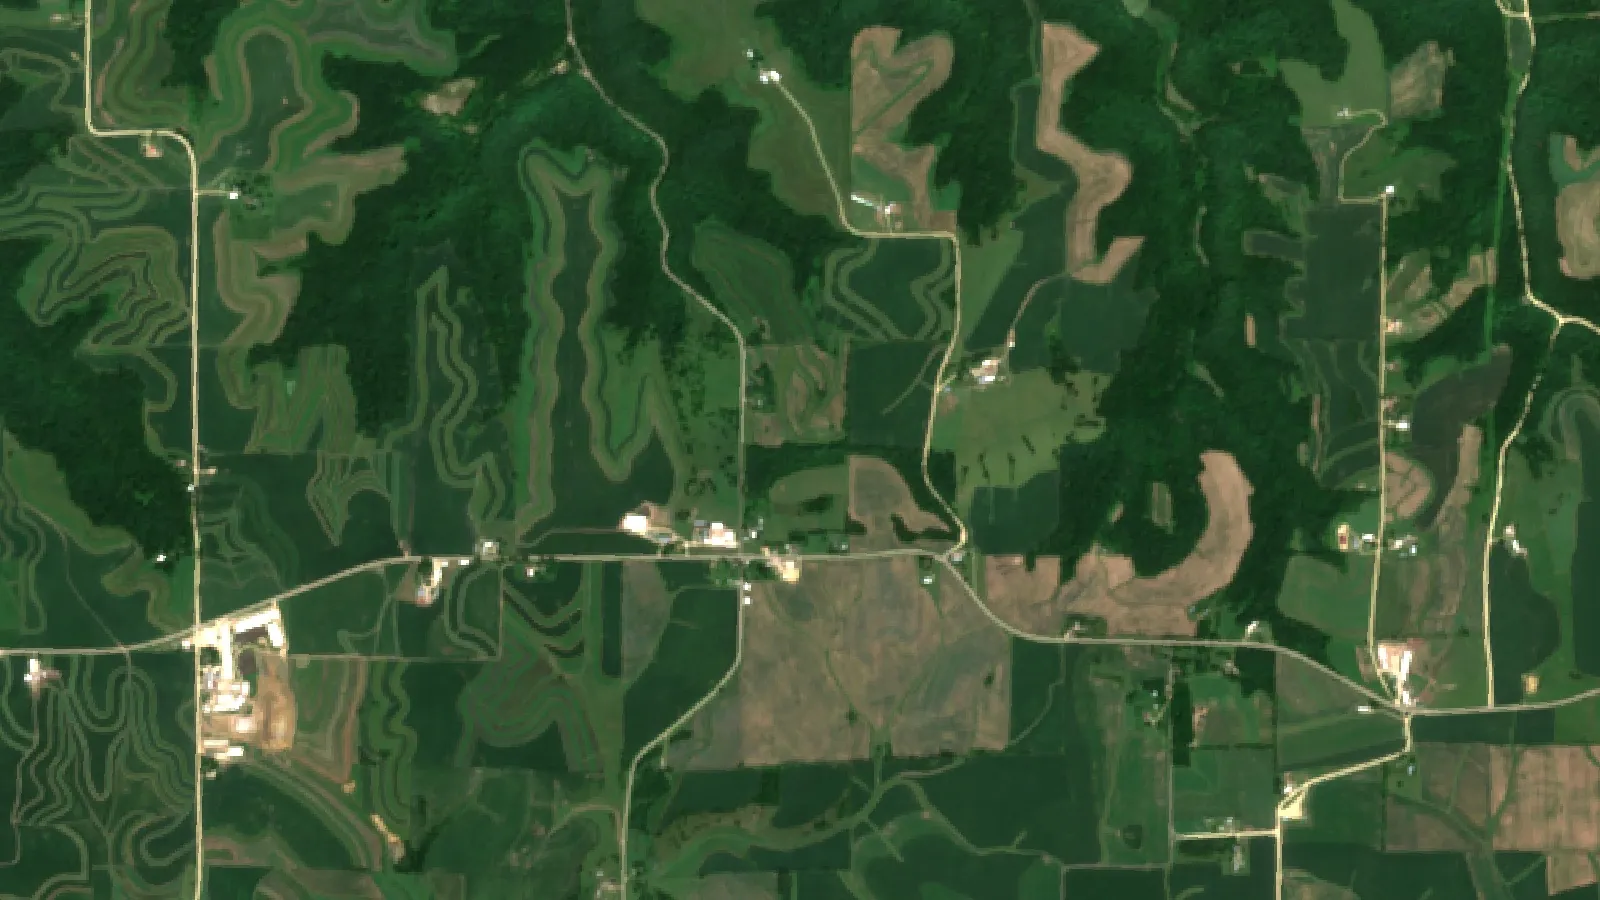
Key takeaways
- US land in farms was 880.1 million acres in 2022, 39% of all US land: permanent pasture 393 million acres, cropland 382 million, woodland 72 million and other 33 million (USDA NASS Census of Agriculture).
- Worldwide, agricultural land covered 4.74 billion hectares in 2020, about two-thirds of it permanent meadows and pastures (FAO Statistical Yearbook, 2022).
- Use and class are different questions: use says what the land does now, class grades its limits, such as USDA classes I to VIII, Canada 1 to 7, England grades 1 to 5 and NZ LUC 1 to 8.
- In England, grades 1, 2 and 3a count as best and most versatile land; grades 1 and 2 together were estimated at about 21% of English farmland (Natural England, 2012).
- Satellites map land cover and crop condition; the capability class itself comes from soil survey and field checks.
In this article
Agricultural land is land used to grow crops or to graze livestock. In the United States, the 2022 Census of Agriculture counted 880.1 million acres of land in farms, which is 39% of all U.S. land. Of that, 45% was permanent pasture, 43% was cropland, 8% was woodland and 4% was farmsteads and other uses. The five types of agricultural land use below follow that split. Classification is a second, separate question: it grades how good the land is, from the best soils to land that should stay in grass or trees.
This guide explains both. It covers the five land-use types, then the grading systems used in the USA, England, Canada, New Zealand and by the FAO, with the class rules in plain words. It ends with a calculator that turns the share of your land in each class into a rough yearly margin.
The five types of agricultural land use
There is no single official list of five. The USDA Census uses four groups, and the FAO uses three. The list below is a practical five-part view built from both data sets.
| Type | What it is | Examples |
|---|---|---|
| 1. Cropland | Land worked every year or most years for annual crops | Corn, wheat, soy, vegetables |
| 2. Permanent crops | Long-term crops that are not replanted each year | Orchards, vineyards, coffee |
| 3. Pasture and range | Land kept in forage for grazing or hay | Improved pasture, prairie, rangeland |
| 4. Farm woodland | Tree cover that belongs to the farm | Woodlots, shelterbelts |
| 5. Farmsteads, other | Buildings, yards, roads, ponds, waste land | Barns, feedlots, lanes |
1. Cropland
The Census counted 382 million acres of cropland in 2022, and 301 million acres of it were harvested that year. The other 81 million acres were not harvested that year. The FAO defines arable land as the total of temporary crops, temporary meadows and pastures, and temporary fallow, as set out in its Statistical Yearbook (2022). Land in cropland rotates between these uses, so a field can move between categories from one year to the next.
2. Permanent crops
The FAO counts land with long-term crops that do not have to be replanted for several years, such as cocoa and coffee, as permanent crops. Tree fruit, nuts and vines are the usual examples in North America and Europe. The FAO adds arable land and permanent crops together to get its total for cropland. The U.S. Census does not report permanent crops as a separate land-use line in the table used here, so they sit inside its cropland figure.
3. Pasture and rangeland
This is the largest single use in both data sets. The Census put permanent pasture at 393 million acres in 2022, 45% of U.S. farmland, and most of it is in the western states. The FAO counts land used for five years or more to grow forage, whether sown or wild, as permanent meadows and pastures. It reports 3.18 billion hectares of it worldwide in 2020, about two-thirds of all agricultural land.
4. Farm woodland
Woodland was 72 million acres of U.S. farmland in 2022, or 8%. Farm woodlots give timber, firewood, shade and shelter for animals. They stay part of the farm, though national accounts such as the ERS series below count grazed and ungrazed forest as a separate use.
5. Farmsteads and other land
The last 33 million acres, 4% of farmland, were farmsteads, buildings, livestock facilities and other uses. This land produces nothing directly, but it makes the other four types work.
Chart
How US farmland was used in 2022
Million acres of land in farms, by use
Agricultural land by the numbers
Three data sets answer the question of how much land farming uses. Each counts something slightly different, so do not mix their totals.
- Census of Agriculture (USDA NASS): land in farms, reported by farm operators, every five years.
- National Resources Inventory (USDA NRCS): a sample-based survey of all non-federal rural land, farm or not. The 2022 summary report counts nearly 1.4 billion acres of it, mostly 421.5 million acres of forest, 399.7 million acres of rangeland and 364.3 million acres of cropland.
- Major Land Uses (USDA ERS): a national accounting of all U.S. land in seven classes: total land, cropland, grassland pasture and range, forest-use land, special use land, urban land and miscellaneous land. The ERS series has run since 1948.
The NRI also shows how fluid the categories are. Between 2017 and 2022, about 73% of the land that became cropland had been pasture in 2017, and of the 2017 cropland that went to other uses, about 59% became pasture.
Chart
US land in farms, 2002 to 2022
Million acres, Census of Agriculture years
How the world uses its farmland
The FAO reports that the global agricultural land area was 4.74 billion hectares in 2020, down 3% from 2000. Pasture is the larger part. China held 12% of the world’s permanent meadows and pastures, Australia 10% and the United States 8%.
Chart
World agricultural land by use, 2020
Billion hectares
Land classification systems compared
Land use says what the land is doing now. Land classification says what the land can do. Each system grades land by its limits, such as slope, wetness, drought, stones and erosion risk. The grade does not depend on who farms it or what is planted today.
| System | Where used | Classes | Based on |
|---|---|---|---|
| USDA capability | United States | I to VIII | Soil limits for crops and pasture |
| Canada Land Inventory | Canada | 1 to 7 | Soil limits for mechanized crops |
| England ALC | England, Wales | Grades 1 to 5 | Climate, site and soil limits |
| NZ LUC | New Zealand | 1 to 8 | Limits and versatility of use |
| FAO suitability | Worldwide method | S1 to N2 | Fit for one stated use |
| Soil Taxonomy | United States, others | 12 orders | Soil properties, not use |
USDA land capability classes
The U.S. system groups soils by their ability to produce common cultivated crops and pasture plants without deteriorating over a long period, as described in an NRCS handbook chapter. The class definitions in the NRCS land capability guide run as follows.
- Class I: slight limitations that restrict use.
- Class II: moderate limitations that reduce the choice of plants or need moderate conservation practices.
- Class III: severe limitations that reduce the choice of plants or need special conservation practices.
- Class IV: very severe limitations that restrict the choice of plants or need very careful management.
- Class V: little or no erosion hazard but other limits that are impractical to remove, so use is mainly pasture, range, woodland or wildlife habitat.
- Class VI: severe limitations that make the land generally unsuited to cultivation.
- Class VII: very severe limitations, unsuited to cultivation, mainly range, forest or wildlife habitat.
- Class VIII: limits that rule out commercial plant production; recreation, wildlife, water supply or scenery.
Classes I to IV can be cultivated; classes V to VIII are not suited to regular tillage. A letter after the number gives the main limit: e for erosion, w for wetness, s for shallow, stony or droughty soil and c for climate. Class I has no subclass because its limits are few. This is where the question “what is class 1 farmland” comes from: it is the land with the fewest restrictions on crop choice and tillage.
Canada Land Inventory classes
Agriculture and Agri-Food Canada groups mineral soils into 7 classes and 13 subclasses by their potential for field crops. Class 1 has no significant limitations. Class 4 has severe limitations. Class 5 soils suit perennial forage with improvements, class 6 soils suit only perennial forage and class 7 soils have no capacity for arable culture or permanent pasture. The ratings assume good management and a largely mechanized system. Organic soils sit outside the classes and are shown as a separate unit.
England: Agricultural Land Classification grades
England and Wales use five grades, with grade 3 split into 3a and 3b. The grade rests on the long-term physical limits of the land: climate, site and soil, and how they interact. Current use does not change the grade. Under planning policy, grades 1, 2 and 3a count as the “best and most versatile” land, as Natural England technical note TIN049 (2012) explains. The note gave an estimate that grades 1 and 2 together make up about 21% of farmland in England, and subgrade 3a about another 21%.
The GOV.UK guide describes the grades this way: grade 1 is excellent quality land with no or very minor limits, grade 2 is very good with minor limits, grade 3 is good to moderate, grade 4 is poor with severe limits, and grade 5 is very poor, limited to permanent pasture or rough grazing. It advises using the post-1988 ALC map and detailed site survey reports for development questions, and a new survey by a soil specialist if no suitable data exists. The national predictive maps are for strategic use and not for single fields.
New Zealand: Land Use Capability
Manaaki Whenua Landcare Research explains that LUC has eight classes. Limits rise and versatility falls from class 1 to class 8. Classes 1 to 4 suit arable cropping, horticulture, grazing, tree crops or production forestry. Classes 5 to 7 are unsuitable for arable cropping but can carry grazing, tree crops or forestry. Class 8 is suited to erosion control, water management and conservation.
FAO land suitability
The FAO’s framework for land evaluation (1976) grades land for one stated use at a time. Class S1 is highly suitable, S2 moderately suitable and S3 marginally suitable. Class N1 is currently not suitable: its limits might be overcome in time, but not with current knowledge at an acceptable cost. Class N2 is permanently not suitable. The same field can be S1 for one crop and S3 for another, which is why suitability is used for crop planning. Capability systems such as the USDA’s rank land for general use instead.
Soil Taxonomy and agro-ecological zones
Soil Taxonomy was developed by the USDA soil survey staff. It places every soil in one of 12 orders, such as Alfisols, Mollisols and Entisols, as shown by the University of Idaho’s soil orders page. Mollisols, for example, are the soils of grassland ecosystems. It describes what a soil is, not what it should be used for, so it feeds capability and suitability ratings but does not replace them. Agro-ecological zoning goes one step wider: it combines climate, soil and terrain into zones that suit certain crops or farming systems, and is used for regional planning.

▶ A walk through land cover classification and the main farm land types. · 8:53
What classification changes on a farm
Classification is a planning tool. It does not guarantee a yield. It helps in four ways.
- Crop choice and rotation: class I and II soils keep the widest choice of crops. Lower classes narrow the choice to forage, perennial crops or trees.
- Conservation: the subclass letter shows the main hazard. Erosion-prone class III to IV land often needs cover crops or reduced tillage to protect soil health, and wet land needs drainage or a different crop.
- Inputs: nutrient plans start with the soil test. Our guide to soil fertility shows how inputs differ by soil. Fertilizer and pesticide rates must follow the product label and local rules, whatever the class.
- Land use planning and value: governments use grades to protect the best land from development. England protects grades 1, 2 and 3a through planning policy, and the Landcare Research portal shows New Zealand’s baseline extent of highly productive land as LUC classes 1 to 3.
Capability is not the same as current use. Class IV land can be cropped with very careful management, and class II land can sit in pasture for owner reasons. The class tells you the risk and the management needed, not what you must do.
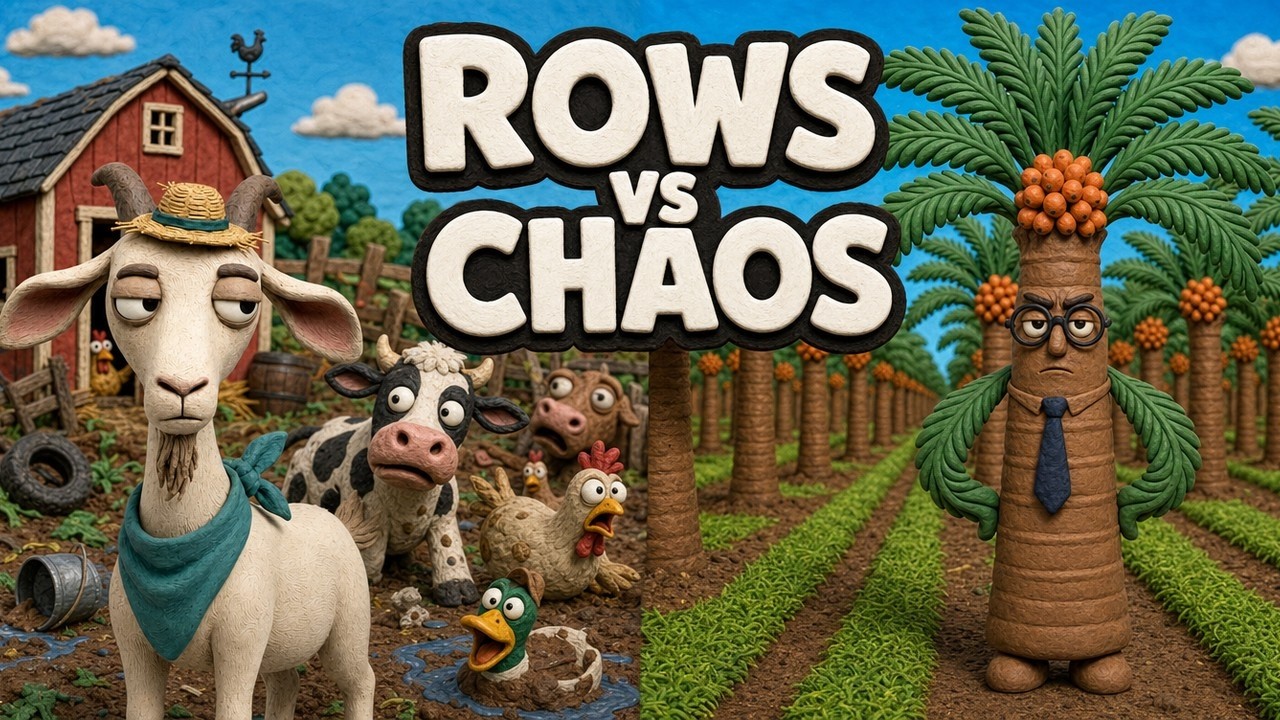
▶ Plantation versus farm: size, crops, monoculture risk and who does the work. · 4:29
Check your own land mix
Your own acres matter more than any national total. Here is how to find your classes in five steps.
- Mark the boundary. In the United States, open the NRCS Web Soil Survey, which provides soil data and information produced by the National Cooperative Soil Survey, and draw your area of interest. In England use the Magic map. In Canada use the provincial soil survey maps. In New Zealand use the Land Resource Portal.
- List the map units. Each colored patch on the soil map is a unit with its own acreage. Write down the acres of each.
- Read the class and subclass. Note the class number and the letter that gives the main limit, such as erosion or wetness.
- Group the acres. Add up the acres in classes I and II, in III and IV, and in V to VIII. Use the grade groups of your own country if you are outside the United States.
- Check on the ground. A map unit is an average of the soils inside it, so a single field can hold better and worse spots. Take a soil sample where yields or crop color differ, and ask a local adviser before you change the land use.
Then enter the acres below. The calculator turns the mix into a rough yearly margin so you can see how much of your farm sits in the classes that carry the crop budget.
Try the numbers for your own farm below.
Calculator
What could your land mix earn in a year?
Enter your acres by capability class and your own margin per acre.
- Total acres: 200 acres
- Share of land in classes I to IV: 80.0 %
- Margin before land cost, whole farm: $11,000
- Net margin per acre: $5
- Break-even land cost per acre: $55
Example values only, not benchmarks or forecasts: every margin and cost is your input, so replace the examples with your own budget numbers (US$). Group your acres by the capability class shown in your soil survey: classes I and II, classes III and IV, and classes V to VIII (USDA classes; use the grade groups of your own country). The calculator assumes one margin per acre for each group and one land cost per acre for all land.
Common mistakes when reading land data
- Mixing up use and class. A field in pasture can be class II, and a field in corn can be class IV. One tells you what is on the land now and the other tells you its limits.
- Comparing totals from different sources. The Census counts land in farms, the NRI counts all non-federal rural land and the ERS counts every acre in the country. Their cropland and pasture totals differ for that reason, not because one is wrong.
- Treating a class as a yield forecast. A class describes long-term limits. Yield also depends on weather, crop, variety and management.
- Using old maps for a single field. England’s first national ALC maps, made between 1967 and 1974, were not accurate enough for single fields, as the Natural England note says. Use a detailed survey for decisions about one site.
- Forgetting that grades are not forever. Drainage, irrigation, terracing and erosion can change what a field can do. Re-check the class if the land has been changed a lot.
How satellites help, and what they cannot show
Satellites map what is on the land, not its capability class. A satellite image shows whether a field is cropland, pasture, trees or bare soil, and how green the crop is through the season. The USDA’s Cropland Data Layer is an annual, crop-specific land cover map built from satellite images and ground reference data, at 30 m resolution from 2008 to 2023 and 10 m from 2024. Combined Landsat 8 and 9 and Sentinel-2 data gives global 10 to 30 m coverage with a shorter wait between passes, according to a 2020 study.
Capability still comes from soil survey and field checks. Clouds block optical images, so the gaps between clear views vary by place and season. Farmonaut Satellite + AI Farm Monitoring System shows vegetation maps of your own fields through the season in the Farmonaut app. They help you see where a field behaves differently from the rest, which is a reason to take a soil sample there. They do not give a capability class.
Developers can read the API documentation to bring satellite data into their own tools.
Related pages on our site: land classification, sustainable agriculture, modern farming, crop stress, agricultural applications, farm management software, agribusiness partnerships.
FAQ
What are the 5 types of agricultural land use?
A practical list is cropland, permanent crops, pasture and rangeland, farm woodland, and farmsteads and other land. The USDA Census of Agriculture uses four groups: permanent pasture, cropland, woodland and other (2022). The FAO uses arable land, permanent crops and permanent meadows and pastures.
What is agricultural land?
The FAO defines it as land used for cultivation of crops and animal husbandry, the total of cropland and permanent meadows and pastures. In 2020 it covered 4.74 billion hectares worldwide (FAO Statistical Yearbook, 2022).
What is class 1 farmland?
In the USDA system, class I soils have slight limitations that restrict their use. In Canada, class 1 soils have no significant limitations for crops. In England, grade 1 land has no or very minor limits. Each country’s top class means the widest crop choice with the fewest management needs.
How is farmland classified in England?
The Agricultural Land Classification has five grades, and grade 3 is split into 3a and 3b. Grades 1, 2 and 3a are the best and most versatile land under planning policy (Natural England, 2012). A detailed survey by a soil specialist is the way to grade a single site.
What is the difference between land capability and land suitability?
Capability ranks land for general use by its limits, as in the USDA classes I to VIII. Suitability ranks land for one stated use, such as a given crop, as in the FAO classes S1 to N2 (FAO, 1976).
How can I find my land’s classification?
In the United States, use Web Soil Survey from the NRCS. In England, check the post-1988 ALC map on Magic and ask a soil specialist for a field survey if you need an exact grade. For legal, tax or planning matters, get professional advice before you act.
Farmonaut crop monitoring
See how your own fields vary from space
Draw your fields once and Farmonaut shows satellite vegetation maps for them through the season, on web, Android or iOS.




Keep reading
Sources
- USDA NASS, 2022 Census of Agriculture Highlights: Farms and Farmland (2024): nass.usda.gov
- USDA NRCS, Summary Report: 2022 National Resources Inventory (2025): nrcs-prod.azureedge.us
- USDA ERS, Major Land Uses (updated August 2026): ers.usda.gov
- FAO, Statistical Yearbook World Food and Agriculture 2022: openknowledge.fao.org
- USDA NRCS, National Engineering Handbook, Part 652 Chapter 2 (South Carolina supplement): land capability classification: directives.nrcs.usda.gov
- USDA NRCS, Land Capability Classification guide (eFOTG): efotg.sc.egov.usda.gov
- Agriculture and Agri-Food Canada, CLI Agriculture classification: sis.agr.gc.ca
- Natural England, Technical Information Note TIN049 (2012): publications.naturalengland.org.uk
- GOV.UK, Guide to assessing development proposals on agricultural land: gov.uk
- Manaaki Whenua Landcare Research, An introduction to LUC: lrp.landcareresearch.co.nz
- FAO, A framework for land evaluation, Soils Bulletin 32 (1976): fao.org
- University of Idaho CALS, Twelve Soil Orders: uidaho.edu
- USDA NRCS, Web Soil Survey: websoilsurvey.nrcs.usda.gov
- USDA NASS, Cropland Data Layer FAQ: nass.usda.gov
- Li and Chen, Sensors (2020): Global revisit interval of Landsat-8/9 and Sentinel-2A/2B: ncbi.nlm.nih.gov
Discussion
Questions, corrections or field experience? Share them below. First-time comments are reviewed before they appear, and your email is never published.
No comments yet. Be the first to add a question or your experience.

 Abhishta Agri
 SP Farms
 Indosistim Teknologi
 Liquify Digital
 CU Foods
 BeyondTech Global
 Rouge VC
 AgroGreen Dynamics
 AgroRisk
 Oath Inc
 Reddane Farming
 Esri North East Africa
 Cresol
 MDCV UK
 Zerella Group
 Etech Consulting Madagascar
 Vestlandsforsking
 Delicio

 Exploration consultancy · South Africa · Gold
 Licence holder · Niger · Gold










