

Copper · Price data and drivers
Copper Price per Tonne: Chart and Drivers
LME copper set an official cash price of US$14,741 per tonne on 14 October 2026, against a US$9,808 quarterly average in July to September 2025. See the dated figures, the drivers, forecasts and an ore-value calculator.
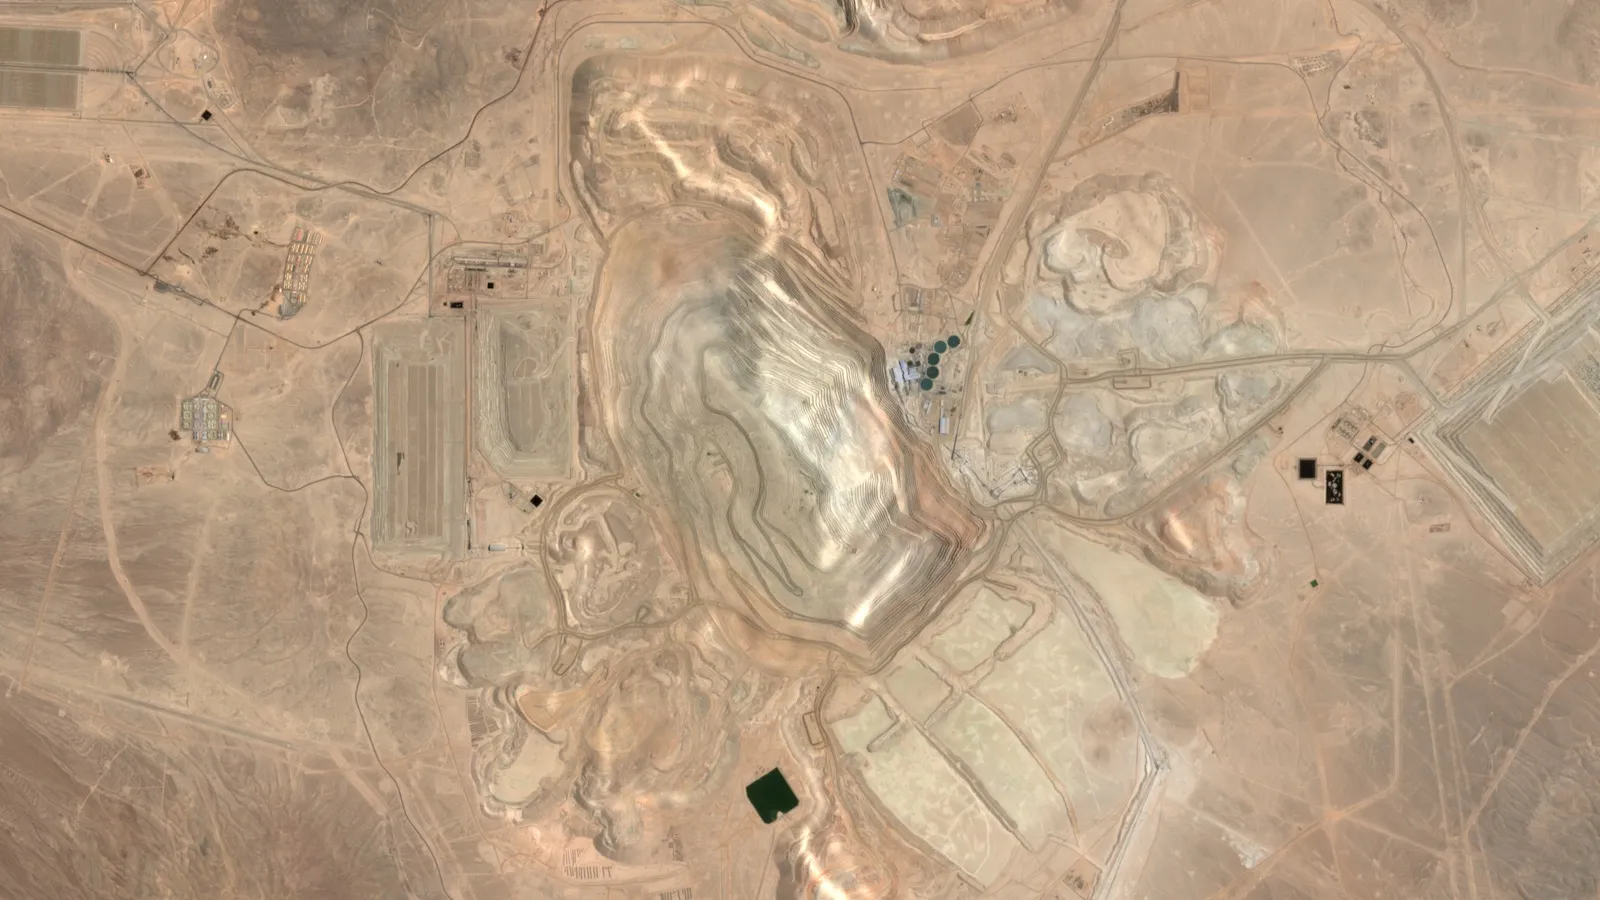
Key takeaways
- LME official cash price was US$14,741 per tonne on 14 October 2026; the three-month contract closed at US$14,436 (International Copper Association Australia).
- The quarterly average rose from US$9,808 (July to September 2025) to US$14,114 (July to September 2026), about 44% (World Bank Pink Sheet, October 2026).
- Multiply a price per pound by 2,204.62 to get a price per tonne; US$6.50 per pound is about US$14,330 per tonne.
- Chile supplied about 23% of 2025 world mine output of 23 million tonnes (USGS, 2026); China refined about half the world’s metal.
- Freeport-McMoRan’s realized price rose from US$4.54 to US$6.17 per pound year on year while its unit net cash cost rose from US$1.13 to US$1.97 (Q2 2026 release).
In this article
- Copper price per tonne: latest LME and COMEX figures
- How to convert dollars per pound to dollars per tonne
- Why COMEX and LME prices differ
- What moves the copper price
- Copper price outlook: what forecasters say
- Copper ore price per tonne: why there is no single quote
- What a copper price rise does to mine margins
- Copper price calculator: from price per pound to ore value
- How to follow the copper price yourself: 5 steps
- What investors and project owners should check
- Frequently asked questions
The London Metal Exchange (LME) set its official cash price for copper at US$14,741 per tonne at midday on 14 October 2026, and the three-month contract closed that day at US$14,436 per tonne, according to the International Copper Association Australia weekly brief of 15 October 2026. A year earlier the market was far lower: the World Bank Pink Sheet puts the July to September 2025 average at US$9,808 per tonne and the same quarter of 2026 at US$14,114, a rise of about 44%.
This page gives the dated numbers first, then shows how to turn a price quoted per pound into a price per tonne, why New York and London prices differ, what moves the market, what forecasters expect and what the price means for a mine. It ends with a calculator, five steps for tracking the price yourself, and answers to the questions people ask most. Prices change by the hour, so every figure carries its date and source; use them as a record, not as today’s quote.
Copper price per tonne: latest LME and COMEX figures
Two benchmarks matter most. The LME quotes grade A copper cathode in US dollars per tonne, and the COMEX contract in New York is quoted per pound and often converted to a tonne by traders. The World Bank’s price series uses the LME grade A cathode price, as its October 2026 Pink Sheet notes. The table below lists the latest readings confirmed in public sources, with the date and publisher on each row.
Chart
Quarterly average LME copper price
US$ per tonne, grade A cathode, July 2025 to September 2026
| Measure | US$ per tonne | Date and source |
|---|---|---|
| LME official cash price (midday London) | 14,741 | 14 October 2026, International Copper Association Australia |
| LME three-month close | 14,436 | 14 October 2026, International Copper Association Australia |
| COMEX (about US$14.57 per kg) | about 14,570 | 14 October 2026, International Copper Association Australia |
| LME intraday high (September record) | 14,875 | 10 September 2026, International Copper Association Australia |
| Monthly average, September | 14,474 | World Bank Pink Sheet, October 2026 |
| Quarterly average, July to September | 14,114 | World Bank Pink Sheet, October 2026 |
| Annual average, 2025 | 9,947 | World Bank Pink Sheet, October 2026 |
| Annual average, 2024 | 9,142 | World Bank Pink Sheet, October 2026 |
| Annual average, 2023 | 8,490 | World Bank Pink Sheet, October 2026 |
The step up is large. The annual average rose about 8% from 2023 to 2024 and another 9% in 2025 (both from the table above), then the quarterly averages climbed each quarter: US$11,112 in October to December 2025, US$12,831 in January to March 2026, US$13,349 in April to June and US$14,114 in July to September. The ICA Australia brief adds that COMEX was up about 34% on the year at 14 October and that both benchmarks sat within about 2 to 3% of the September records.
Read the chart below as a trend, not a forecast. It shows the World Bank’s quarterly averages, which smooth out the daily swings that make a single day’s quote misleading.
How to convert dollars per pound to dollars per tonne
Copper producers and US exchanges often quote per pound, while the LME and most trade statistics use the tonne. One tonne is 1,000 kilograms, or about 2,204.62 pounds. To convert, multiply the price per pound by 2,204.62. To go from price per kilogram to a tonne, multiply by 1,000. Freeport-McMoRan, for example, reports its realized copper price in dollars per pound: US$6.17 per pound in the second quarter of 2026, according to its second-quarter 2026 earnings release. That is about US$13,603 per tonne.
| Price per pound (US$) | Price per tonne (US$) | Note |
|---|---|---|
| 4.00 | 8,818 | Arithmetic only |
| 5.00 | 11,023 | Arithmetic only |
| 6.00 | 13,228 | Freeport’s own planning price for the second half of 2026 is US$6.00 per pound |
| 6.17 | 13,603 | Freeport realized price, second quarter of 2026 |
| 6.61 | 14,570 | COMEX level on 14 October 2026 (US$14.57 per kg) |
Two cautions. First, a producer’s realized price is an average of sales that may be priced against earlier or later market dates, so it will not match a single day’s exchange price. Second, always check the currency and the unit. Australian reports often quote LME copper in Australian dollars: the ICA Australia brief of 9 October 2026 put it near A$20,900 per tonne at a time when the US dollar price was US$14,526.
Why COMEX and LME prices differ
COMEX and the LME normally trade within a small gap, but in 2026 the gap has moved with US trade policy. The ICA Australia brief says refined cathode is still exempt from the tariff, but an April proclamation set a phased refined-copper tariff of 15% in 2027 and 30% in 2028, subject to a presidential decision after a Commerce Department update. The brief puts COMEX about US$135 per tonne above the LME on 14 October, close to parity, against a gap of about US$420 per tonne at the end of July.
The tariff threat has shaped where metal goes, and US data show the flows. The USGS Mineral Commodity Summaries 2026 shows US refined copper imports of 903 thousand tonnes in 2024 and an estimated 1,700 thousand tonnes in 2025, and year-end refined stocks held by US producers, consumers and exchanges of 123 thousand tonnes in 2024 against an estimated 450 thousand tonnes for 2025. The ICA Australia brief reports COMEX warehouses holding a record 711,609 tonnes in mid-October, while LME warehouses held 233,025 tonnes. For a buyer outside the United States, that is why a New York quote can mislead: it reflects a market that is partly cut off from the rest of the world.
What moves the copper price
Five forces show up repeatedly in the data and in industry reports. None of them works alone, and the weight of each changes from month to month.
Chart
Eight largest copper mining countries
Mine production, thousand tonnes of contained copper, 2025 estimate; the eight largest of the countries USGS lists
Mine supply is concentrated
The USGS estimates world mine production of copper at 23 million tonnes of contained metal for 2025, and Chile alone supplied about 5.3 million tonnes of that, roughly 23%. The Democratic Republic of the Congo (3.2 million tonnes) and Peru (2.7 million tonnes) follow. When one large mine stops, the market notices. The ICA Australia brief says Morgan Stanley expects flat or lower mine output in 2026, which would be the first annual fall since 2017, and that Chile mined 3.2 million tonnes in January to August, down 8%. It also lists three events in mid-October: a strike at Antofagasta’s Centinela mine that began on 7 October, a landslide at Codelco’s El Teniente that killed two workers and halted part of the operation, and the approval on 14 October of a new 36-month contract at Escondida, which removed the near-term strike risk at the world’s largest copper mine.
The chart below ranks the eight largest producers by the USGS estimate for 2025. For deposit types and where new mines are likely to come from, see our guide to copper deposits, top countries and where to explore.
Smelting is concentrated in China
The same USGS table gives world refinery production of 29 million tonnes for 2025, with China at 14 million tonnes, close to half. Refiners buy concentrate (the crushed, enriched ore that mines sell) and charge treatment and refining charges (TC/RC) for turning it into metal. The ICA Australia brief says the 2026 benchmark TC/RC settled at US$0 per tonne and 0 cents per pound, and describes concentrate terms as at record lows. In plain terms, smelters are competing for scarce concentrate, which squeezes their margins and limits how much refined metal they can make.
Demand follows construction, grids and transport
The USGS, citing the Copper Development Association, gives the US split of copper use as building construction 42%, electrical and electronic products 23%, transportation equipment 18%, consumer and general products 10% and industrial machinery 7%. Natural Resources Canada notes that copper is generally seen as a barometer of the economy because its uses are in construction, manufacturing and clean technologies, and that demand tends to rise in growth periods and fall in slowdowns (Natural Resources Canada, copper facts). On China, the ICA Australia brief reports that the International Copper Study Group sees Chinese apparent usage up 2.5% in 2026, with demand elsewhere broadly flat.
The dollar and interest rates
Copper is priced in US dollars, so a stronger dollar makes it more expensive for buyers using other currencies. The brief of 15 October 2026 links the afternoon sell-off (the three-month contract closed down 0.8% on the day, after the midday official cash price of US$14,741) to a hotter US inflation reading, a dollar index at 102.9 (its highest since April 2025) and higher odds of a Federal Reserve rate rise at the 27 to 28 October meeting. Higher rates also raise the cost of holding stockpiles and weigh on speculative buying.
Trade policy and stocks
As the previous section showed, tariff talk redirects metal. The brief notes that China’s cathode imports fell 20% year on year in August as Chilean and Congolese metal went to the United States, and that Chinese buyers paid a Yangshan premium of US$135 per tonne, a four-year high. Our companion piece on the World Bank copper price forecast against actual prices compares one agency’s projections with what happened, and gold and copper price trends puts the two metals side by side.
▶ Explains why electric cars need more copper and how most of that copper comes from one country. · 6:03
Copper price outlook: what forecasters say
People who search for a copper price target or outlook usually want one number. The sources do not agree on one, and they are updated often. The ICA Australia brief of 15 October 2026 collects the latest published views; the table repeats them with the date each was made as reported by that brief. They are other people’s forecasts, not ours.
| Forecaster (date, as reported by ICA Australia) | View on the refined market | Price view (LME, US$ per tonne) |
|---|---|---|
| International Copper Study Group (October 2026) | Refined surplus of 104 thousand tonnes in 2026, 368 thousand in 2027 | No price forecast |
| Wood Mackenzie (August 2026) | Slight surplus in 2026 | Supported by US tariff inflows |
| Goldman Sachs (June 2026) | Deficit of 640 thousand tonnes outside the US in 2026, 170 thousand in 2027 | 13,735 at end-2026; 13,800 average in 2027 |
| Morgan Stanley (July to September 2026) | Mine supply flat to lower | 14,250 in the fourth quarter |
| J.P. Morgan (August 2026) | Global refined market well supplied | 14,800 in the fourth quarter; 13,800 average in 2027 |
Two points stand out. The institutions that model physical balances (the ICSG and Wood Mackenzie) lean toward a small surplus, while Goldman Sachs counts a deficit outside the United States because US stockpiling takes metal away from everyone else. And the bank price views for 2027 are lower than today’s spot, which means they expect some easing even where they are bullish on 2026. The price views span more than US$1,000 per tonne. The ICSG published a new market forecast on 14 October 2026, listed on its press releases page.
Copper ore price per tonne: why there is no single quote
Searches for a copper ore price per ton or tonne are common, but no exchange quotes one. Miners rarely sell raw ore. They crush it, concentrate it, and sell the concentrate to a smelter, which pays for a share of the contained metal at the LME price and deducts treatment and refining charges. So the value of a tonne of ore depends on four things: the copper grade (percent copper by weight), the recovery (the share of that copper the plant actually captures), the payable share the buyer pays for, and the price per tonne of metal.
Grade makes the arithmetic easy to see. Ore at 0.5% copper holds 5 kilograms of copper in every tonne. At the 14 October LME official cash price of US$14,741 per tonne (about US$14.74 per kilogram), that is about US$74 of contained metal in a tonne of ore before any recovery loss, smelter terms, freight or mining cost. At 85% recovery it is closer to US$63. The calculator further down lets you replace each of these with your own numbers.
Because the 2026 benchmark TC/RC is US$0 per tonne, the usual deduction for smelting is much smaller than in earlier years, according to the ICA Australia brief, but individual contracts vary and miners also pay for transport and, in some deals, penalties for impurities. Any quoted figure for “ore price” on a website should be treated with caution unless it says the grade, the recovery and the date. Our post on copper project capital intensity looks at the other side of the equation: what it costs to build capacity per tonne.
What a copper price rise does to mine margins
A higher price does not lift profit by the same amount as revenue, because cost per pound moves too. Freeport-McMoRan gives a clean example. Its second-quarter 2026 release shows a consolidated average realized copper price of US$6.17 per pound, up from US$4.54 a year earlier, while its average unit net cash cost (the cash cost of producing a pound after by-product credits, before depreciation) rose from US$1.13 to US$1.97 per pound. Site production and delivery costs rose from US$2.71 to US$3.28 per pound. The company guides to a unit net cash cost of about US$1.90 per pound for 2026 and says that, for the second half of 2026, each US$0.10 per pound change in the copper price would move operating cash flow by about US$150 million.
Chart
Freeport-McMoRan copper: price and cost per pound
US$ per pound, consolidated, second quarter
The chart below sets the two quarters side by side. Note that net cash cost depends heavily on by-product credits such as gold and molybdenum, and Freeport’s gold price rose from US$3,291 to US$4,520 per ounce over the same period, so the figures describe one company and are not an industry average.
Southern Copper explains why the same caution applies to any single cost number. Its annual report for 2025 defines operating cash cost per pound of copper as a non-GAAP measure, one without a standard definition, that may not be comparable with similar figures at other firms. Compare cost figures only when the definitions match.
For a project owner, the lesson is to test a plan at several prices. A mine plan that works at US$14,000 per tonne may not work at US$9,000, which was close to the 2024 and 2025 annual averages in the table above.
Copper price calculator: from price per pound to ore value
Enter a price per pound, the tonnes of ore, the copper grade, the plant recovery and the share of metal the buyer pays for. The result is gross revenue before mining, processing, transport, royalty, tax and capital costs, so it is a sizing tool and not a profit estimate.
Calculator
What is a tonne of copper ore worth at your price?
Enter your own price, grade and recovery. The result is gross revenue before any cost.
- Copper sold: 408
- Revenue per tonne of ore: $58
- Total gross revenue: $5,846,652
Example values only, not a forecast or a benchmark. The price is an input: example, use today’s price. The conversion uses 1 tonne = 2,204.62 pounds. Recovery and payable share depend on the plant and the sales contract.
How to follow the copper price yourself: 5 steps
- Pick the benchmark that matches your contract. A buyer in London, Asia or Australia usually works from the LME; a US fabricator or a US-priced royalty often works from COMEX. Say which one you are quoting.
- Record the date and the type of price. The LME official cash price is set at midday London time, while the three-month close comes at the end of trading. Those two numbers differed by US$305 per tonne on 14 October 2026, partly because of the time of day and partly because cash and three-month contracts can trade apart (cash was US$97 per tonne over three-month on 8 October). Over recent weeks the LME close was US$14,253.50 on 1 October and the official cash price US$14,526 on 8 October, which are different price types, so treat the gap as a rough guide only; the 15 October brief puts the 14 October close about 1.3% above the 1 October low of US$14,253.50.
- Use averages for planning. The World Bank Pink Sheet publishes monthly, quarterly and annual averages on its commodity markets page; they are better inputs for a budget than any single day’s price.
- Convert units and currency. Multiply a price per pound by 2,204.62 to get a tonne, and check whether the figure is in US dollars, Australian dollars or another currency.
- Test a low case. Run your numbers at the 2024 and 2025 annual averages (US$9,142 and US$9,947) as well as at today’s level, and write down which assumption breaks first.
What investors and project owners should check
For readers who own a mining licence, advise a licence holder or follow copper projects as an investor, a price chart is only the start. These checks come from the numbers above.
- Cost position. A mine that produces at US$1.97 per pound net of by-products, as Freeport did in the second quarter of 2026, has more room than one whose site production and delivery cost is US$3.28 per pound before by-product credits. The two figures measure different things, so compare like with like. Ask which measure a company is quoting.
- Grade and recovery. Revenue per tonne of ore scales directly with both; a small drop in grade is a loss of revenue on every tonne processed.
- Price assumptions. A project built on a price near the top of the range has less margin for error than one built on a multi-year average. Check what price the company’s study uses and whether it tests lower ones.
- Concentrate sales terms. Treatment charges, payable percentages and penalties change what the mine actually receives; they are set in contracts, not on an exchange.
- Jurisdiction and supply risk. The mid-October strike and landslide in Chile show how one country’s events reach the global price.
- Where the next tonne of copper comes from. New supply starts with exploration. Satellite-based mineral detection can screen a licence area for copper-bearing alteration and rank targets before drilling, ahead of a resource estimate; see the satellite mineral detection service page.
The world’s reserves put the scale in context: the USGS lists identified copper reserves of 980 million tonnes and estimates identified resources of 1.5 billion tonnes of unextracted copper as of its 2015 assessment. Reserves are the part of a resource that can be mined profitably at stated prices and costs, so a higher price can move tonnes from resource to reserve.

▶ Shows how satellite data helps choose where to drill before a hole is paid for. · 4:26
We cover a connected topic in Graphite Electrode Uses: Steel Furnaces, kg per Tonne.
For a closer look at a related question, see our guide: Samarium Oxide Price per kg: Chart and Drivers.
Frequently asked questions
What is the copper price per tonne today?
On 14 October 2026 the LME official cash price was US$14,741 per tonne and the three-month contract closed at US$14,436 (International Copper Association Australia). Prices move every trading day, so check the LME or a market data provider for a live quote.
How do I convert the copper price from dollars per pound to dollars per tonne?
Multiply the price per pound by 2,204.62. A price of US$6.50 per pound equals about US$14,330 per tonne. Multiply a price per kilogram by 1,000 instead.
Why is the COMEX copper price different from the LME price?
COMEX is the New York contract and the LME is the London contract. US tariff plans pulled metal into the United States, and COMEX stocks reached a record 711,609 tonnes in mid-October 2026. The COMEX premium over the LME was about US$135 per tonne on 14 October, against about US$420 at the end of July (International Copper Association Australia).
What was the average copper price?
The World Bank Pink Sheet gives US$9,947 per tonne for 2025, up from US$9,142 in 2024 and US$8,490 in 2023.
What is the copper ore price per ton?
There is no exchange price for ore. Value depends on grade, recovery, the share a smelter pays for and the metal price. Ore at 0.5% copper holds 5 kilograms of copper per tonne, worth about US$74 at the 14 October LME cash price before any losses or costs. Use the calculator on this page with your own grade and recovery.
Which countries produce the most copper?
The USGS estimates 2025 mine production at 5.3 million tonnes for Chile, 3.2 million for the Democratic Republic of the Congo, 2.7 million for Peru, 1.8 million for China and 1.3 million for Russia, from a world total of 23 million tonnes. The United States produced an estimated 1.0 million tonnes, with Arizona about 70% of that.
What is the copper price forecast?
Views differ. As of the ICA Australia brief of 15 October 2026, Goldman Sachs (June 2026) saw US$13,735 per tonne at end-2026, Morgan Stanley saw US$14,250 in the fourth quarter and J.P. Morgan saw US$14,800 in the fourth quarter. The ICSG, which does not forecast price, expects a refined surplus of 104 thousand tonnes in 2026. These are other firms’ opinions, not advice.
What is copper used for?
The USGS, citing the Copper Development Association, lists US use as building construction 42%, electrical and electronic products 23%, transportation equipment 18%, consumer and general products 10% and industrial machinery 7%.
What does a treatment charge (TC/RC) mean for the copper price?
Treatment and refining charges are fees a smelter takes for turning concentrate into metal. They do not set the copper price, but they decide how much of the metal’s value a mine keeps. The 2026 benchmark settled at US$0 per tonne, according to the ICA Australia brief.
Does a higher copper price always mean higher mining profit?
No. Costs also rise. Freeport-McMoRan’s realized price rose from US$4.54 to US$6.17 per pound between the second quarters of 2025 and 2026, while its unit net cash cost rose from US$1.13 to US$1.97 per pound.
Where can I find historical copper prices?
The World Bank publishes monthly and annual copper averages in its Pink Sheet, and the USGS lists annual averages in its Mineral Commodity Summaries. Both state the grade and the exchange behind each series.
What happens to the copper price if China slows?
China is the largest user and the largest refiner. The ICSG sees Chinese usage up 2.5% in 2026 (via the ICA Australia brief), so a slowdown would remove the main source of growth. Natural Resources Canada notes that copper demand tends to fall in economic slowdowns.
This page is for information only. It is not investment advice. Prices change daily; check the exchange or your broker for a live quote.
Farmonaut mining
See a copper target from space before drilling
Investors can see how satellite data screens a licence area for copper-bearing alteration as an exploration target, ahead of a resource estimate.

Mining Pro sample view, synthetic data
Keep reading



Sources
- USGS, Mineral Commodity Summaries 2026: Copper: pubs.usgs.gov
- World Bank, Commodity Price Data (The Pink Sheet), October 2026: thedocs.worldbank.org
- World Bank, Commodity Markets: worldbank.org
- International Copper Association Australia, Copper Weekly Brief, 15 October 2026: copper.com.au
- International Copper Association Australia, Copper Weekly Brief, week ending 9 October 2026: copper.com.au
- Freeport-McMoRan, Second-Quarter 2026 earnings release: s22.q4cdn.com
- Southern Copper, Annual Report on Form 10-K for 2025: southerncoppercorp.com
- Natural Resources Canada, Copper facts: natural-resources.canada.ca
- International Copper Study Group, Press releases: icsg.org
- International Copper Association Australia, Copper Weekly Brief, week ending 2 October 2026: copper.com.au
Discussion
Questions, corrections or field experience? Share them below. First-time comments are reviewed before they appear, and your email is never published.
No comments yet. Be the first to add a question or your experience.

 Ramani Investments Ltd
 Congo Mining Solutions
 Mining SARL
 SenGold Invest SAS
 Sania Corporation
 Sean Mining Limited
 NTS Group (Pty) Ltd
 Mine4Africa
 Lithspo Minerals Limited
 Tintina Mining Group
 Dalgety Minerals Pty Ltd
 Vortex Minerals Pty Ltd
 Faith At Work (Pty) Ltd
 Geotech Mining Solutions plc
 Vulcan International Limited
 Kidepo Associates
 GKY Mining
 Alkimy SARL
 Double A Trading
 GemSprout Metals Limited











