

Uranium · BHP output and costs
BHP Uranium Production: Tonnes and Cost Guidance
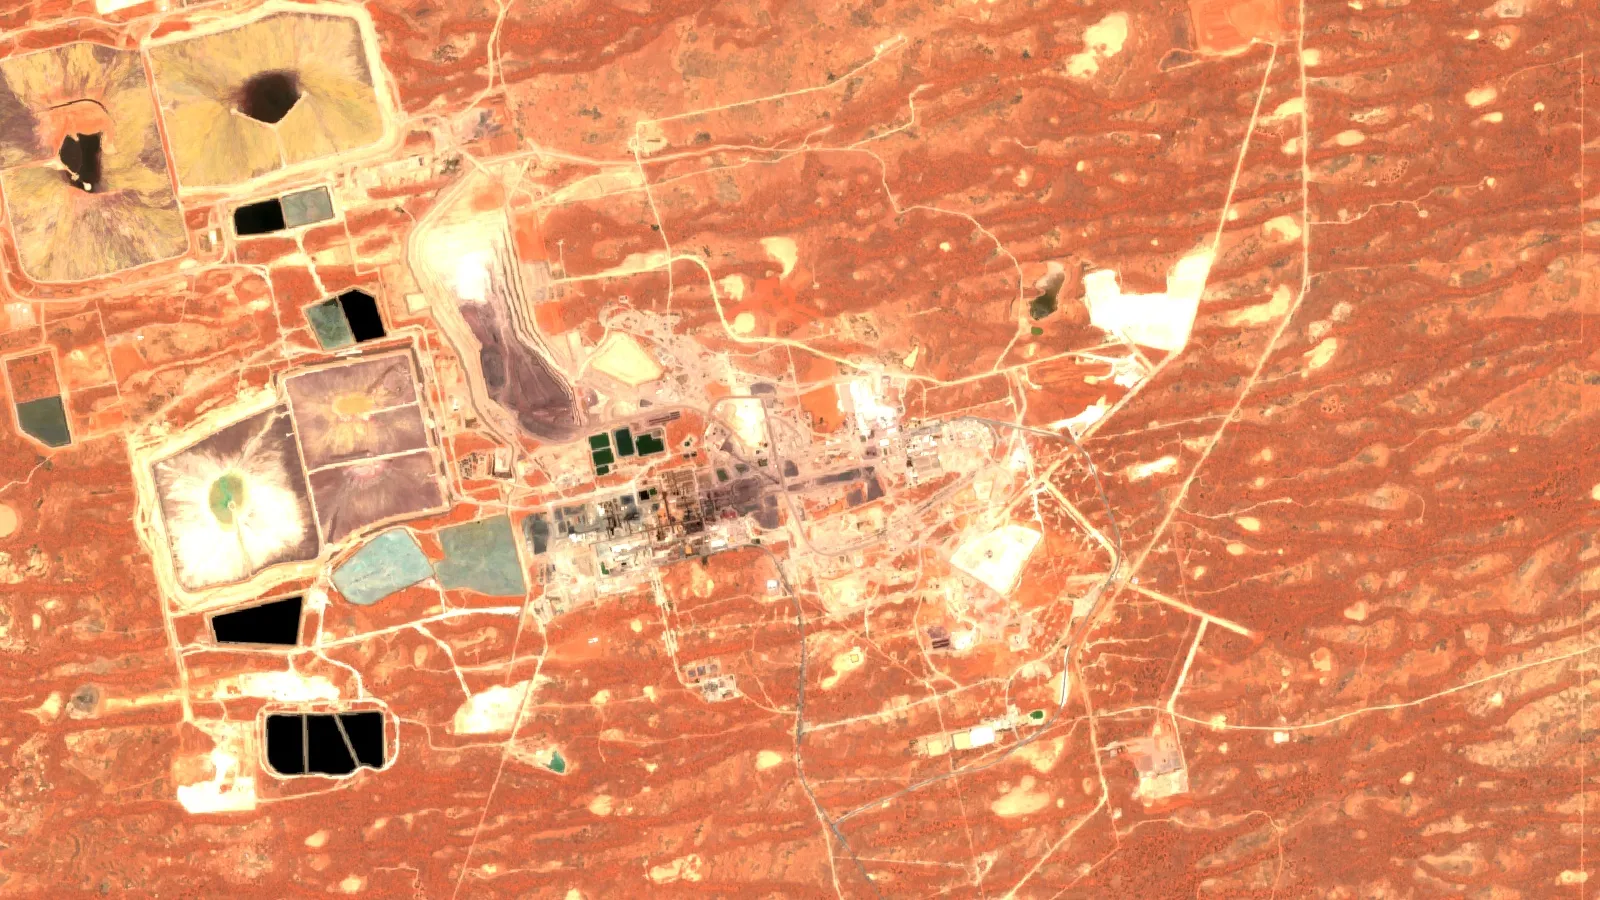
BHP made 3,647 tonnes of payable uranium at Olympic Dam in the year to June 2026, up 16%. It is a by-product of copper, about 5% of world supply, and BHP gives no uranium cost per pound.
Key takeaways
- BHP’s payable uranium was 3,647 t in FY26, after 3,154 t in FY25 and 3,603 t in FY24 (BHP operational reviews, 2025-2026).
- All of it comes from Olympic Dam, South Australia, where copper is the main product (221.3 kt of cathode in FY26).
- BHP made 2,693 tU in 2024, 5% of the 60,213 tU world total and ninth among companies (WNA).
- BHP reports no uranium cost per pound; its FY27 copper cost guidance of US$0.30-0.80 per lb assumes uranium at US$80 per lb.
- Cameco’s month-end spot price was US$89.63 per lb U3O8 on 30 September 2026.
In this article
- How much uranium does BHP produce each year?
- BHP uranium output by year
- What Olympic Dam produced in FY26
- How Olympic Dam makes uranium as a by-product
- Where BHP sits among world uranium producers
- Uranium production by country
- Mine supply against reactor demand
- Other uranium mines in Australia
- What does uranium cost to produce?
- How to read a uranium production number
- How to track BHP's uranium output yourself
- Uranium price and what a year of output is worth
- What could change BHP's uranium output
- Where satellite data fits in uranium exploration
How much uranium does BHP produce each year?
BHP produced 3,647 tonnes of payable uranium in the year to 30 June 2026 (called FY26), up 16% from 3,154 tonnes in FY25, according to its operational review lodged with the ASX on 16 July 2026. All of it came from one mine, Olympic Dam in South Australia. Uranium is a by-product there: the mine is run for copper, with gold, silver and uranium recovered alongside.
“Payable” means the metal in concentrate that a buyer pays for, after the smelter or refiner takes its share. BHP reports the figure in tonnes. In this article the tonnes are treated as tonnes of uranium oxide (U3O8, the form sold as “yellowcake”), which is the unit the World Nuclear Association (WNA) uses for Olympic Dam in its Australia profile. To convert to tonnes of uranium metal (tU), multiply by 0.848. To convert to pounds, multiply by 2,204.62.
On that basis, FY26 output is about 8.0 million pounds of U3O8, or about 3,090 tU. That is roughly 5% of the world’s mine supply, using the WNA world total for 2024 as the yardstick (the two periods differ, so treat the share as a rough guide). The rest of this page puts the number in context: output by year, how Olympic Dam works, where BHP sits among world producers, what uranium costs to produce, and what a year of output is worth at a price you choose.
BHP uranium output by year
BHP’s reviews give three recent years on the same basis. FY24 was 3,603 tonnes, FY25 fell 12% to 3,154 tonnes, and FY26 recovered to 3,647 tonnes, the highest of the three. The strongest quarter in FY25 and FY26 was the June 2026 quarter, at 1,147 tonnes. Quarterly numbers swing widely: in FY26 they ran from 778 tonnes in the March quarter to 1,147 tonnes in June.
Chart
BHP payable uranium by financial year
Tonnes, years ending 30 June
The FY25 review shows the lower year, and the FY26 review notes that copper output rose partly because a weather-related power outage had cut the prior year. Uranium rose 16% in the same year. Because uranium rides on the same ore, mill and smelter circuit as copper, uranium volumes move with copper throughput, not with the uranium price.
What Olympic Dam produced in FY26
Olympic Dam is an underground mine and processing complex at Roxby Downs, about 560 km north of Adelaide. The WNA describes it as the largest known uranium orebody in the world, and it started operating in 1988. The table below lists the main FY26 operating numbers from BHP’s review. Grade is the amount of metal in each tonne of ore, and “ore milled” is the rock crushed and ground for processing.
| Olympic Dam measure | FY26 | FY25 |
|---|---|---|
| Ore milled | 10,900 kt | 10,345 kt |
| Average copper grade | 2.00% | 2.03% |
| Average uranium grade | 0.58 kg per tonne | 0.58 kg per tonne |
| Copper cathode | 221.3 kt | 214.0 kt |
| Refined gold | 231,025 oz | 188,658 oz |
| Refined silver | 1,100 koz | 1,017 koz |
| Payable uranium | 3,647 t | 3,154 t |
Source: BHP operational review, year ended 30 June 2026. The uranium grade is small: 0.58 kg per tonne is 0.058%.
The same mine also set a 20-year copper production record, and refined gold output hit a record, which BHP says benefited from strong prices. In BHP’s reporting, uranium is listed only under Copper South Australia, the group of Olympic Dam, Prominent Hill and Carrapateena, and only Olympic Dam ore carries it.
How Olympic Dam makes uranium as a by-product
Most uranium mines are built for uranium. About 55% of world production in 2024 came from in situ leach (ISL, also called in situ recovery), where a solution is pumped through the orebody underground and the uranium is pulled out at the surface, according to the WNA production review. Another 40% came from conventional underground and open-pit mines, and 5% as by-product. Olympic Dam is the large by-product case, which the WNA counts separately.
The by-product model changes the economics. Copper pays most of the bills, and uranium, gold and silver reduce the net cost of each pound of copper. Our guide to extracting uranium and gold from ore explains the leaching and recovery steps in more detail. The practical point for this page is that BHP can not simply “turn up” uranium: more uranium needs more ore milled, and the copper plan sets that.
The export rule has a history. Under the 1982 Australian Labor Party policy, uranium could be exported only from mines that already existed, and the so-called Roxby Downs amendment let uranium mined incidentally to other minerals be considered case by case. The WNA describes how that allowed the development of Olympic Dam. Australian exports of uranium oxide in 2025 were 6,433 tonnes, worth A$1,543 million, based on Geoscience Australia’s preliminary 2026 tables.
Where BHP sits among world uranium producers
The WNA ranks producers by tonnes of uranium metal. In 2024, BHP produced 2,693 tU, 5% of the 60,213 tU world total, which put it ninth among companies. Kazatomprom of Kazakhstan led with 12,463 tU, or 21%, ahead of Cameco at 10,193 tU. The chart shows eight of the ten companies in the WNA table; Rosatom (2,738 tU) and General Atomics/Quasar (1,808 tU) are left out for space.
Chart
Uranium production by company, 2024 (selected)
Tonnes of uranium metal (tU); eight of the ten largest companies
By mine, Olympic Dam was the seventh largest in 2024. The table shows the ten largest, with the main owner as the WNA lists it. Note that the WNA table still prints BHP’s former name, BHP Billiton, for the owner of Olympic Dam; the company is now BHP Group.
| Rank | Mine | Country | Main owner | 2024 output (tU) |
|---|---|---|---|---|
| 1 | McArthur River/Key Lake | Canada | Cameco | 7,808 |
| 2 | Cigar Lake | Canada | Cameco/Orano | 6,501 |
| 3 | Husab | Namibia | Swakop Uranium (CGN) | 4,437 |
| 4 | Karatau (Budenovskoye 2) | Kazakhstan | Uranium One/Kazatomprom | 3,299 |
| 5 | Inkai, sites 1-3 | Kazakhstan | Kazatomprom/Cameco | 2,992 |
| 6 | Akdala and South Inkai 4 | Kazakhstan | Uranium One/Kazatomprom | 2,803 |
| 7 | Olympic Dam | Australia | BHP | 2,693 |
| 8 | Moinkum and Tortkuduk | Kazakhstan | Orano/Kazatomprom | 2,388 |
| 9 | Rossing | Namibia | CNNC | 2,205 |
| 10 | Khorassan 1 | Kazakhstan | Kazatomprom/Uranium One | 2,030 |
Source: WNA, World Uranium Mining Production. The top ten mines made 37,156 tU, 62% of world output. For a wider ranking of companies, see our guide to the largest uranium producers in the world.
Uranium production by country
Three countries supply about three-quarters of the world’s mined uranium. Kazakhstan produced 39% of the 2024 total, Canada 24% and Namibia 12%. Australia came fourth. The table gives the WNA figures for the last two years it lists.
| Country | 2023 (tU) | 2024 (tU) |
|---|---|---|
| Kazakhstan | 21,109 | 23,270 |
| Canada | 11,001 | 14,309 |
| Namibia | 6,986 | 7,333 |
| Australia | 4,693 | 4,598 |
| Uzbekistan (estimate) | 4,000 | 4,000 |
| Russia | 2,710 | 2,738 |
| Niger | 1,130 | 962 |
| United States | 19 | 260 |
| World total | 54,433 | 60,213 |
Source: WNA, World Uranium Mining Production. Later data for single countries exist: the WNA says Kazakhstan produced about 25,839 tU in 2025, about 40% of the world total, per its Kazakhstan profile. For the United States, where output is still small, see our note on uranium mines in the US.
Namibia’s output rose from 6,986 tU to 7,333 tU between 2023 and 2024, led by two mines in the WNA top ten: Husab (4,437 tU, Swakop Uranium, owned by CGN) and Rossing (2,205 tU, CNNC). Uranium in Africa extends beyond Namibia and Niger.
For Australia, Geoscience Australia’s preliminary tables show 5.337 kt U produced in 2025, up 15% from 4.656 kt in 2024, from three operating mines, based on company reports from BHP, Heathgate Resources and Boss Energy. The WNA’s 2024 figure for Australia (4,598 tU) is close to GA’s, though the two bodies report on their own bases. Olympic Dam’s FY26 output of about 3,090 tU is more than half of the 2025 national total, though FY26 and calendar 2025 are not the same period.

▶ African uranium context: a clay explainer on uranium in Africa, including the Kanyemba deposit in Zimbabwe. · 4:27
Mine supply against reactor demand
The WNA table also shows how much of reactor demand mined uranium met. Mines supplied 90% of world demand in 2024, up from 83% in 2023 and 74% in 2020, when world output fell to 47,731 tU. The rest of demand was met from other sources. With a gap like that, one mine matters: a 1,000-tonne change at a single site is under 2% of 2024 world output. Read it with the WNA production data, which says over half of output now comes from ISL.
Other uranium mines in Australia
Olympic Dam is not Australia’s only source. Heathgate Resources, an affiliate of General Atomics, runs the Four Mile in situ recovery operation in South Australia, with the ore solution piped to the Beverley processing plant; the WNA puts steady output at about 2,000 t U3O8 a year. Honeymoon, an in situ leach mine closed in 2013, is owned by Boss Energy; the WNA records Boss’s final investment decision to restart it in June 2022 and a feasibility base case of 907 t U3O8 a year. Geoscience Australia’s 2026 tables name Boss Energy among the three companies whose reports give Australia’s 2025 uranium output, so the mine is back in production. Check Geoscience Australia and each company’s filings for current rates.
Ranger in the Northern Territory stopped production in January 2021, according to the WNA Australia profile. The same page lists Olympic Dam output between 1,922 t U3O8 (2021) and 3,967 t (2019) over 2015 to 2022, so the FY26 result sits inside the range of recent years.
What does uranium cost to produce?
BHP does not publish a cost per pound of uranium. Olympic Dam’s costs are shared across copper, gold, silver and uranium, so the company reports one number: the unit cash cost of copper for Copper South Australia, net of by-product credits. A by-product credit is the value of the other metals, subtracted from the cost of the copper. For FY27, BHP’s guidance for Copper South Australia is US$0.30 to US$0.80 per pound of copper, based on an exchange rate of AUD/USD 0.70 and by-product prices of US$4,300 per ounce for gold and US$80 per pound for uranium, per the FY26 results presentation of 18 August 2026. The FY26 guidance range was US$1.00 to US$1.50 per pound, based on gold at US$2,900 and uranium at US$70 per pound.
Chart
Kazatomprom uranium cost per pound, first half
US$ per lb U3O8, attributable basis
That gives a sense of how much the by-products matter, though the two ranges also differ in exchange rates and volumes. As an illustration only: 3,647 tonnes is about 8.04 million pounds of U3O8. At the US$80 per pound BHP used for planning, that is about US$643 million before any discount, royalty or conversion cost. Spread over Copper South Australia’s 321 kt of copper (about 708 million pounds), that is roughly US$0.91 per pound of copper. This is Farmonaut arithmetic, not a figure BHP reports; BHP’s realised uranium price is set by long-term contracts and is not given in these documents.
For a producer that reports uranium costs, Kazatomprom is the best public comparison. Its cost figures are on an attributable basis, which means its ownership share in each joint venture. C1 cash cost is the direct cost of mining and processing, and the all-in sustaining cost (AISC) adds capital spending to keep the mines running. In the first half of 2026, Kazatomprom reported a C1 cash cost of US$24.48 per pound and an AISC of US$38.45, up 37% and 25% on the first half of 2025. The company said the main driver was a higher mineral extraction tax (up from 9% to 12.4%), with higher sulphuric acid costs and a stronger tenge also adding to the rise.
Treat any table that lists a single cost per pound for Olympic Dam with caution. Cost definitions differ (C1 versus AISC, attributable versus 100%, with or without royalties and tax), and for a by-product mine the answer depends on the credits assumed. Compare like with like, and read the definition in the footnote.
How to read a uranium production number
Four checks stop most mistakes when comparing companies:
- Unit. Is it tonnes of uranium (tU) or tonnes of U3O8? The second is about 18% larger. Pounds of U3O8 are what the price is quoted in.
- Basis. Is it 100% of the mine or the company’s share (attributable)? Kazatomprom reports both.
- Payable or produced. Payable metal is what the buyer pays for; produced is what left the plant.
- Period. BHP’s year ends 30 June; the WNA and most national agencies use the calendar year.
The WNA’s 2024 company table gives BHP 2,693 tU, while BHP’s own FY24 figure converts to about 3,055 tU (3,603 t U3O8 times 0.848). The gap is partly the different 12 months, partly basis. Always state which one you use.
How to track BHP’s uranium output yourself
- Open BHP’s investor centre page for financial results and operational reviews.
- Download the quarterly operational review, which BHP lodges with the ASX each quarter.
- Find the metals production table and read the row “Uranium, payable metal in concentrate”.
- Read the Copper South Australia commentary for the reason behind any change, such as outages or smelter work.
- Check the unit cost guidance note for the uranium price BHP assumes.
- Convert tonnes to pounds (times 2,204.62) and multiply by the price you choose.
Uranium price and what a year of output is worth
Uranium has two main prices. The spot price is for delivery soon; the long-term price is the contract price for deliveries over several years. Cameco publishes month-end industry averages built from UxC and TradeTech quotes. At 30 September 2026 its spot price was US$89.63 per pound of U3O8 and the long-term price was US$96.50. Our own uranium price explainer and the note on the global uranium market cover the drivers.
Chart
Uranium price, month-end April to September 2026
US$ per lb U3O8, industry average
The calculator below turns tonnes and a price into pounds and dollars. The defaults are round examples, not BHP’s contract terms; use today’s price and your own realised percentage. Use it to see how a US$10 move in the price changes the value of a year’s output.
Calculator
What is a year of uranium output worth?
Enter payable tonnes of U3O8 and a price per pound.
- Gross value (US$ million): 635 US$m
- Uranium metal (tonnes U): 3,053 tU
- Value change per US$10/lb move (US$ million): 79 US$m
Example values only, not BHP’s contract terms or a forecast. Price is an input: example, use today’s price (US$ per lb U3O8). Fixed constants: 2,204.62 lb per tonne; 0.848 tonne of uranium metal per tonne of U3O8. Gross value before royalties, discounts and conversion costs.
What could change BHP’s uranium output
Uranium follows copper at Olympic Dam, so BHP’s copper plans matter more than the uranium price. For FY27, the review guides Copper South Australia to 290-320 kt of copper, below FY26’s 321 kt. BHP gives two reasons: an unplanned conveyor belt failure at Carrapateena in July 2026 (up to eight weeks of mine production impact), and a planned build-up of anode inventory ahead of a six-yearly smelter maintenance campaign in the first half of FY28. The FY27 guidance table in the review gives copper volumes, not uranium.
Longer term, the FY26 results presentation describes a Phase 1 aim of about 500 kt of copper a year by 2035 for Copper South Australia as a whole and says BHP is assessing options to accelerate Olympic Dam mine growth, with a larger Phase 2 aspiration that includes Oak Dam and Olympic Dam Deeps. The WNA notes that a planned expansion was scrapped in October 2022 and, earlier, that bigger copper output at Olympic Dam would bring a matching rise in uranium. These are plans, not commitments, and the review does not set a uranium target.
If you want to follow the company in real time, the useful documents are the quarterly operational reviews (with the uranium line under Copper South Australia) and the half-year and full-year results. Copper at Olympic Dam is also covered in our guide to copper deposits.
Where satellite data fits in uranium exploration
Production figures describe mines that already exist. Finding the next deposit starts with a licence area and a question about where to look. Satellite imagery can show surface alteration, structure and drainage that guide early field work, and Farmonaut’s platform covers uranium among 20+ minerals as an exploration-stage screen. Results are exploration targets that sit ahead of a resource estimate, not resource or reserve figures.
▶ A two-minute explainer of how remote sensing measures the ground from a distance. · 2:01
If this topic matters to you, read Gold Mining AISC: World Gold Council Definition & Current Data next.
Related reading on this site: US Uranium Production vs Canada: Output and Mines.
Frequently asked questions
How much uranium does BHP produce a year?
BHP produced 3,647 tonnes of payable uranium in FY26 (year to 30 June 2026), after 3,154 tonnes in FY25 and 3,603 tonnes in FY24, per its operational reviews filed with the ASX.
Which BHP mine produces uranium?
Olympic Dam in South Australia. BHP’s operational review reports uranium only under Copper South Australia, and only Olympic Dam has uranium in its production table.
Is uranium BHP’s main product?
No. Olympic Dam is mainly a copper mine: it produced 221.3 kt of copper cathode in FY26, with gold, silver and uranium as by-products.
What share of world uranium does BHP supply?
About 5%. The WNA lists BHP at 2,693 tU in 2024, 5% of the 60,213 tU world total, ninth among companies.
Which company produces the most uranium?
Kazatomprom of Kazakhstan, with 12,463 tU in 2024 (21% of the world), ahead of Cameco at 10,193 tU, according to the WNA.
How much does BHP’s uranium cost to produce?
BHP does not report a uranium cost. It reports a net copper cost for Copper South Australia, with uranium treated as a credit. Its FY27 guidance of US$0.30-0.80 per pound of copper assumes uranium at US$80 per pound.
What is the uranium price?
At 30 September 2026, Cameco’s month-end figures were US$89.63 per pound for spot and US$96.50 for long-term. Check UxC, TradeTech or Cameco for today’s value.
How do I convert tonnes of U3O8 to pounds or to tonnes of uranium?
One tonne of U3O8 is 2,204.62 pounds. One tonne of U3O8 contains about 0.848 tonnes of uranium metal. So 3,647 t U3O8 is about 8.04 million pounds, or 3,090 tU.
Is Olympic Dam the largest uranium deposit in the world?
The WNA calls it the largest known uranium orebody in the world, and World Nuclear News cites the IAEA and OECD Red Book for well over one million tonnes of uranium resources there. In annual production it ranked seventh among mines in 2024, behind mines in Canada, Namibia and Kazakhstan.
Will BHP produce more uranium in future?
Possibly, if copper throughput grows. BHP’s plans centre on copper, and the FY27 guidance table gives copper only, with Copper South Australia at 290-320 kt, below FY26.
How much uranium does Australia produce?
Geoscience Australia’s preliminary tables show 5.337 kt U in 2025 from three operating mines, up 15% on 2024.
This page is for information only. It is not investment advice and it gives no price forecast or target.
Farmonaut mining
Get a quote to map your project area from space
Send your licence boundary and target mineral to request a quote for satellite exploration targets, ahead of any resource estimate.

Mining Pro sample view, synthetic data
Keep reading

Sources
- BHP, Operational review for the year ended 30 June 2026 (ASX, 16 July 2026): announcements.asx.com.au
- BHP, FY2026 Results Presentation (ASX, 18 August 2026): announcements.asx.com.au
- BHP, Operational review for the year ended 30 June 2025 (ASX, 18 July 2025): announcements.asx.com.au
- World Nuclear Association, World Uranium Mining Production: world-nuclear.org
- World Nuclear Association, Australia’s Uranium: world-nuclear.org
- World Nuclear Association, Uranium and Nuclear Power in Kazakhstan: world-nuclear.org
- Geoscience Australia, Australia’s Identified Mineral Resources 2026 Preliminary Tables: ga.gov.au
- Cameco, Uranium price (month-end spot and long-term): cameco.com
- Kazatomprom, 1H2026 Financial Results: kazatomprom.kz
- World Nuclear News, Australian miners provide updates on past and future operations (28 February 2024): wnn.world-nuclear.org
Discussion
Questions, corrections or field experience? Share them below. First-time comments are reviewed before they appear, and your email is never published.
No comments yet. Be the first to add a question or your experience.

 SRK Consulting
 Berks Gold Limited
 Mwerezi Minerals Company Limited
 Mining SARL
 SenGold Invest SAS
 Sania Corporation
 Sean Mining Limited
 NTS Group (Pty) Ltd
 Mine4Africa
 Lithspo Minerals Limited
 Tintina Mining Group
 Dalgety Minerals Pty Ltd
 Vortex Minerals Pty Ltd
 Faith At Work (Pty) Ltd
 Geotech Mining Solutions plc
 Vulcan International Limited
