

Gold producers · Mine ranking
Gold Fields Limited: 8 Mines Ranked by Gold Output
Gold Fields Limited (JSE and NYSE: GFI), not “Gold Field NV”, made 1.267 Moz of gold-equivalent in the first half of 2026, 1.247 Moz of it from eight mines. This guide ranks them by output and cost and checks reserves, lease risk and sustainability numbers.
Key takeaways
- Gold Fields Limited produced 1.267 Moz attributable gold-equivalent in the first half of 2026 (1.247 Moz from its eight current mines, the rest from Damang); Salares Norte supplied 336.9 koz, about 27% (Gold Fields interim results, 25 August 2026).
- Group AISC was US$1,893 per ounce in the half-year, with full-year guidance of US$1,800 to US$2,000; Granny Smith was the lowest-cost gold mine at US$1,787 and Gruyere the highest at US$3,081.
- Reserves were 48.3 Moz at 31 December 2025 at a US$2,000 gold price; Tarkwa holds 6.6 Moz on leases that expire in April 2027, with no formal government reply by August 2026.
- Gruyere moved to 100% ownership on 26 September 2025 and Damang left the group on 18 April 2026, so year-on-year comparisons need adjusting.
- Renewables supplied 17.4% of group electricity in the first half of 2026 (Agnew 43%), while Scope 1 and 2 emissions rose to 1,780 kt CO2 in 2025 (Gold Fields Integrated Annual Report 2025).
In this article
- Gold Fields Limited or Gold Field NV: which name is right?
- How we ranked the Gold Fields mines
- Gold Fields mines ranked by gold output
- Gold Fields mines at a glance
- What changed in the first half
- Gold Fields mines compared by all-in sustaining cost
- Margin per ounce calculator for a gold mine
- How a Gold Fields mine turns ore into gold
- How much gold is left: reserves and tenure
- Sustainability at Gold Fields: seven measures with numbers
- What to check before using a Gold Fields figure
- Where satellite data fits in a gold company review
- Frequently asked questions
Gold Fields Limited is a gold producer incorporated in South Africa and listed on the Johannesburg and New York stock exchanges under the code GFI (Gold Fields results for the six months to 30 June 2026). It is not an “NV” company. In that half-year it produced 1.267 million ounces (Moz) of attributable gold-equivalent. Of that, 1.247 Moz came from eight operating mines in Australia, Chile, Ghana, Peru and South Africa and 19.9 thousand ounces from Damang, which left the group in April. Its all-in sustaining cost (AISC, the cost of producing and selling one ounce, including the capital needed to keep the mine running) was US$1,893 per ounce. The biggest producer by far was Salares Norte in Chile.
This page ranks the mines by output, compares their costs, sets out the sustainability measures that Gold Fields reports with numbers, and lists the risks an analyst or consultant should check. It also adds a margin calculator and a reserves chart. Every figure comes from the company’s own reports or a named outside source, and each carries its date.
Gold Fields Limited or Gold Field NV: which name is right?
The correct name is Gold Fields Limited, registration number 1968/004880/06, incorporated in the Republic of South Africa. Its shares trade on the JSE and the New York Stock Exchange, and it reports from Johannesburg (Gold Fields, interim results, 25 August 2026). People often search for “Gold Field NV” when they want this company, but the legal name in its reports is Gold Fields Limited, and the listed parent is the South African company.
Its 2025 attributable gold-equivalent output was 2,438 thousand ounces (koz), up 18% from 2,071 koz in 2024 (Gold Fields Integrated Annual Report 2025). That is about 76 tonnes. The US Geological Survey estimates world gold mine production at 3,300 tonnes for 2025, so the company supplied roughly 2.3% of the world total, a rough comparison because its figure is gold-equivalent and attributable (USGS Mineral Commodity Summaries 2026, gold).
How we ranked the Gold Fields mines
The ranking metric is attributable gold-equivalent production for the six months to 30 June 2026, taken from the segment tables in the company’s interim results. “Attributable” means Gold Fields’ ownership share, so Tarkwa (90% owned) counts at 90% and South Deep (93.10%) at 93.10%. “Gold-equivalent” converts by-product silver and copper into ounces of gold; the company says copper-gold equivalents are about 2% of group production (Gold Fields interim results).
We included every mine that produced in the half-year and was still in the portfolio on 30 June 2026. The development project at Windfall in Québec is covered in the reserves section because it has no production yet. Damang in Ghana is covered there too, because it left the group on 18 April 2026. One half-year is a short window: ranks can change with grade, weather and ore supply, so treat the order as a snapshot.
Gold Fields mines ranked by gold output
1. Salares Norte, Chile
Facts: wholly owned; 336.9 koz gold-equivalent attributable (H1 2026); yield 10.1 g/t gold-equivalent (yield is the grams of metal recovered per tonne of ore milled); AISC US$269 per gold ounce after silver credits, or US$837 per gold-equivalent ounce. Best for: seeing how a new high-grade mine can change a company’s cost profile.
Chart
Attributable gold-equivalent output by mine, first half of 2026
Thousand ounces (koz), Gold Fields’ ownership share
Salares Norte is a high-altitude open pit, at around 4,500 metres above sea level according to the company’s resource supplement (Mineral Resources and Mineral Reserves Supplement 2025). It reached commercial production on 31 August 2025 and steady state in the fourth quarter. Output rose 173% in the half-year, and gold recovery in the plant was 92%. Strengths: the highest yield and the lowest cost in the group, and silver adds a second revenue stream. Watch points: the company named high altitude and severe winter weather as challenges during construction, and a silver credit lowers the headline AISC in a way that does not apply to the pure gold mines.
2. Tarkwa, Ghana
Facts: 90% owned (the Government of Ghana holds the rest); 172.7 koz attributable, 191.9 koz at 100%; yield 0.8 g/t; AISC US$2,671 per ounce. Best for: understanding lease-renewal risk in a large open-pit operation.
Tarkwa is a bulk-tonnage open-pit mine in south-west Ghana that mills about 7 million tonnes in a half-year at a low yield. Output was 18% lower than in the first half of 2025, from lower mill feed grades, reconciliation problems in one pit section and adverse weather. Strengths: 6.6 Moz of reserves, the third largest by country in the group. Watch points: the mining leases expire in April 2027, and in the interim results the company says it is still awaiting a formal government response to the commercial proposal it submitted in July 2026 (Gold Fields interim results). The company also warns that Tarkwa may not recover the first-half shortfall against full-year guidance.
3. St Ives, Western Australia
Facts: wholly owned; 169.8 koz (H1 2026) against 184.5 koz a year earlier; yield 2.4 g/t; AISC US$2,283 per ounce. Best for: following a mixed open-pit and underground mine that is building its own power supply.
St Ives sits near Kambalda, about 635 km east of Perth (Mineral Resources and Mineral Reserves Supplement 2025). Production was held back by a roughly seven-month restriction on the primary ventilation system at the Invincible underground mine, caused by salt build-up in a vent raise, and the company brought a mill reline forward into the second quarter. Open pits and the Hamlet underground mine performed well. Strengths: drilling results at Santa Ana, Achilles and the Invincible complex, and a 77 MW wind and solar project under construction. Watch points: ore supply from underground. Our St Ives mine and explosives guide covers the blasting side of the site.
4. Granny Smith, Western Australia
Facts: wholly owned; 147.4 koz, up 10%; yield 6.0 g/t; AISC US$1,787 per ounce. Best for: the lowest AISC among the six pure gold mines, and a working example of autonomous haulage.
Granny Smith lies in the Laverton district, about 400 km north-east of Kalgoorlie. The company credits record haulage-fleet availability and record autonomous truck performance for the rise, together with mining restarting in the Z135 East area after ground-support upgrades. An 11 MW solar plant there ran at full capacity from the third quarter of 2025. Strengths: high yield and the lowest unit cost of the gold-only mines. Watch points: the mine plan now depends on the Z135 West areas delivering as scheduled.
5. South Deep, South Africa
Facts: 93.10% owned; 140.6 koz attributable, 151.0 koz at 100%; yield 3.2 g/t; AISC US$2,169 per ounce. Best for: the long-life underground asset that holds most of the group’s reserves.
South Deep is in Gauteng province, in the Witwatersrand Basin. Output was down 1% on the 100% basis, with stronger destress mining and better development rates in the second quarter, and a five-year wage agreement was signed after the period ended. The 27.6 Moz of South African reserves all sit here. First production from the South of Wrench area is scheduled for 2031 (Gold Fields Integrated Annual Report 2025). Strengths: mine life. Watch points: the mine was running a recovery plan in the first half, and the 2031 date for South of Wrench is still years away. For the geology, see our guide to gold mining areas in South Africa.
6. Gruyere, Western Australia
Facts: wholly owned since 26 September 2025; 119.7 koz (H1 2026), against about 144 koz a year earlier at 100%; yield 0.8 g/t; AISC US$3,081 per ounce (A$4,385). Best for: a large-scale low-grade open pit now under full Gold Fields control.
Gold Fields completed the Gold Road Resources acquisition on 26 September 2025, so the 2026 figures count the whole mine, while the 2025 half-year counted 50% (Integrated Annual Report 2025). That change makes simple year-on-year comparisons misleading. On a like-for-like 100% basis, output fell 17% because of lower mining productivity and an awkward interface between pit stages 4 and 5. The recovery plan includes upgraded pit dewatering and two new 600-tonne excavators. Strengths: a large surrounding land package. Watch points: the company says the mine remains at risk of not recovering the first-half shortfall.
7. Agnew, Western Australia
Facts: wholly owned; 102.8 koz, down 15%; yield 5.1 g/t; AISC US$2,231 per ounce. Best for: the group’s leading renewable-power site.
Agnew is an underground mine west of Leinster, about 375 km north of Kalgoorlie (Mineral Resources and Mineral Reserves Supplement 2025). Renewable electricity supplied 43% of its power in the half-year. Production fell after seismic rehabilitation in the first quarter at Waroonga, then recovered by 12 koz in the second quarter as paste-fill reliability improved. Strengths: high yield and the highest renewable share in the group. Watch points: seismic activity underground.
8. Cerro Corona, Peru
Facts: 99.5% owned; 56.6 koz gold-equivalent attributable, 31.9 koz gold plus 8,930 tonnes of copper; AISC US$1,284 per gold ounce, or US$2,846 per gold-equivalent ounce. Best for: the one copper-gold mine in the portfolio.
Output fell 42% because the mine is processing low-grade stockpiles, as planned in the mine schedule for 2026 onwards. Gold recovery was 68.1% and copper recovery 84.1%. Capital spending went on in-pit tailings construction, and a mud-farming trial aims to consolidate the upper tailings layers and increase storage density. Strengths: by-product copper and a trial aimed at adding capacity within the existing tailings facility. Watch points: falling yield and rising unit cost.
Gold Fields mines at a glance
| Rank | Mine | Country | Gold Fields share | Attributable output (koz, H1 2026) | Yield (g/t) | AISC (US$/oz) |
|---|---|---|---|---|---|---|
| 1 | Salares Norte | Chile | 100% | 336.9 | 10.1 (gold-eq.) | 269 gold; 837 per gold-eq. oz |
| 2 | Tarkwa | Ghana | 90% | 172.7 | 0.8 | 2,671 |
| 3 | St Ives | Australia | 100% | 169.8 | 2.4 | 2,283 |
| 4 | Granny Smith | Australia | 100% | 147.4 | 6.0 | 1,787 |
| 5 | South Deep | South Africa | 93.10% | 140.6 | 3.2 | 2,169 |
| 6 | Gruyere | Australia | 100% | 119.7 | 0.8 | 3,081 |
| 7 | Agnew | Australia | 100% | 102.8 | 5.1 | 2,231 |
| 8 | Cerro Corona | Peru | 99.5% | 56.6 | 0.56 (gold-eq.) | 1,284 gold; 2,846 per gold-eq. oz |
The four Australian mines together produced 539.7 koz, about 43% of the group’s 1,266.5 koz including Damang. The three largest producers, Salares Norte, Tarkwa and St Ives, made just over half. Source for the table: Gold Fields interim results, segmental tables. For wider context on the Australian gold belts, see our Australia gold deposits by state and the list of copper and gold mining companies in Australia.
What changed in the first half
Group attributable production rose 12% to 1.267 Moz, from 1.136 Moz in the first half of 2025. Salares Norte supplied most of the increase, and Granny Smith added to it. Gruyere, Agnew, Tarkwa and St Ives fell, and Cerro Corona fell by 42% on lower grade. The chart compares each mine on its own 100% basis, which is how the company describes the year-on-year moves, so Gruyere and Tarkwa are shown in full.
Chart
Mine output, first half of 2025 against first half of 2026
Thousand ounces gold-equivalent, 100% of each mine (Gruyere 2025 restated to 100%)
Two portfolio events also changed the picture. The Damang mine was formally transferred to the Government of Ghana on 18 April 2026, after the 12-month lease granted in April 2025 expired, and the company now reports it as a discontinued operation (Gold Fields interim results). The government had earlier refused the 30-year extension that Gold Fields requested (Mining Technology). A local company, Engineers and Planners, took over the site at a ceremony on 18 April 2026 (Citi Newsroom). Damang produced 19.9 koz attributable in the half-year before it left.
Gold Fields mines compared by all-in sustaining cost
AISC is a non-GAAP measure, meaning it is not defined by accounting standards. The World Gold Council’s guidance note sets out how gold miners should build it: operating cost, royalties, by-product credits, sustaining capital and related items, reconciled back to reported accounts (World Gold Council, Non-GAAP metrics guide). Companies draw the line between sustaining and growth spending in slightly different places, so compare AISC across companies with care.
Chart
All-in sustaining cost by mine, first half of 2026
US$ per ounce; Salares Norte and Cerro Corona per gold-equivalent ounce, others per gold ounce
Group AISC for the half-year was US$1,893 per ounce, up 13% on the first half of 2025, and all-in cost (AIC, which also includes growth spending) was US$2,125. The company attributes the rise to gold-price-linked royalties, stronger producer-country currencies and higher input costs, partly offset by Salares Norte. For full-year 2026 it expects AISC of US$1,800 to US$2,000 per ounce. The average realised price in the half-year was US$4,678 per ounce, so the margin after sustaining cost was about US$2,785 per ounce before tax and growth capital. As a recent market reference, Fortune reported spot gold at US$4,147 an ounce at 9:10 a.m. Eastern Time on 15 October 2026 (Fortune). Our guide to optimizing gold mining operations explains the levers behind unit cost.
Within the group, Granny Smith (US$1,787) is the lowest-cost pure gold mine and Gruyere (US$3,081) the highest. Salares Norte and Cerro Corona are shown on a per gold-equivalent ounce basis in the chart because their gold-only AISC is net of large by-product credits.
Margin per ounce calculator for a gold mine
Use the calculator to test how much an ounce leaves after sustaining cost. It works for any gold mine, not only Gold Fields: replace the example numbers with the price you track and the AISC from a company report. It shows the margin per ounce, the margin as a share of price, and the annual total for the production you enter.
Calculator
What margin does an ounce leave after sustaining cost?
Enter your own price, AISC and production.
- Margin as a share of price: 50.0%
- Annual revenue: $400,000,000
- Annual margin after AISC: $200,000,000
Example values only, not Gold Fields figures or a forecast. Prices are inputs: example, use today’s price (US$ per ounce). For reference, Gold Fields reported an average realised price of US$4,678 and AISC of US$1,893 per ounce for the first half of 2026. The result is before income tax, growth capital and financing, so it is not profit.
How a Gold Fields mine turns ore into gold
The company describes the steps as physical and chemical processing of ore into semi-pure gold doré and copper-gold concentrate. The doré is then refined by an outside refinery into bullion (Integrated Annual Report 2025). Recovery, the share of the gold in the ore that ends up in the product, is the figure to read first. At Salares Norte, gold recovery was 92% and silver recovery 81% in the half-year. At Cerro Corona, gold recovery was 68.1% because the plant is treating aged, low-grade material, and copper recovery was 84.1%.
Yield and throughput set the scale. Tarkwa milled about 7.0 million tonnes at 0.8 g/t, Salares Norte milled 1.0 million tonnes at 10.1 g/t, and South Deep milled 1.5 million tonnes at 3.2 g/t. A low-yield mine needs high tonnage and low unit cost, while a high-yield mine can stand a higher cost per tonne. This is why the ranking by output and the ranking by cost differ.

▶ A plain-language claymation following gold from rock to ring: drilling, crushing, leaching, carbon, melting and refining. · 5:27
How much gold is left: reserves and tenure
At 31 December 2025, Gold Fields’ attributable gold Mineral Reserves (the part of a resource shown to be economic to mine) stood at 48.3 Moz, up 4.0 Moz or 9% from 44.3 Moz a year earlier. Mineral Resources, which exclude reserves, were another 34.2 Moz of gold (Mineral Resources and Mineral Reserves Supplement 2025). The company reports reserves at a gold price of US$2,000 per ounce, and the increase came partly from the gold price assumptions and the Gold Road acquisition, which raised Gold Fields’ share of Gruyere to 100% and so its attributable reserves there.
Chart
Attributable gold Mineral Reserves by country, 31 December 2025
Million ounces (Moz), total 48.3 Moz at a gold price of US$2,000 per ounce
By country, South Africa holds 27.6 Moz, Australia 10.6 Moz, Ghana 6.6 Moz and Chile and Peru together 3.5 Moz (Mineral Resources and Mineral Reserves Supplement 2025). Tarkwa’s reserves rose from 3.8 Moz to 6.6 Moz after an out-of-cycle update. That is roughly 14% of group reserves tied to leases that expire in April 2027, which is why the renewal matters. The company says an adverse outcome would have a material and adverse effect on Gold Fields.
The growth project is Windfall in Québec, which Gold Fields took to full ownership through the Osisko Mining acquisition completed on 25 October 2024. It is not yet a mine: approval of the environmental impact assessment is expected in the second half of 2026, after which a final investment decision (FID) follows. Capital is expected at the upper end of US$1.7 to US$1.9 billion, and an impact benefit agreement was signed with the Cree First Nation (Gold Fields interim results).
Sustainability at Gold Fields: seven measures with numbers
The reports give figures for seven areas. Where Gold Fields has not published a number, we do not give one.
1. Renewable power
Renewable energy supplied 18% of group electricity in 2025 and 17.4% (181 gigawatt-hours) in the first half of 2026. The largest project is at St Ives: a 42 MW wind farm and a 35 MW solar farm costing about A$296 million, expected to power more than 70% of the mine and cut its emissions by 50% by 2030 from a 2016 baseline (International Mining, July 2025). All seven wind turbines are built, but commissioning has slipped to the second half of 2026 while grid-connection and turbine verification work finishes. Granny Smith commissioned an 11 MW solar plant in the second quarter of 2025, which ran at full capacity in the third quarter, and South Deep plans to expand its Khanyisa solar plant.
2. Water recycling
The company recycled or reused 74% of the water it withdrew in 2025, against a target of 75%. Total withdrawal was 17.8 gigalitres (2024: 18.0), or 385 litres per tonne processed, and freshwater withdrawal fell 33% against a 2018 baseline. It received an A score in the CDP water disclosure.
3. Tailings management
Tailings are the waste slurry left after processing. Gold Fields reports conformance work against the Global Industry Standard on Tailings Management, which sets 77 auditable requirements in 15 principles (ICMM). Its 2030 target is to cut active upstream tailings dams from five to three. In 2026 it ran a mud-farming trial at Cerro Corona, is testing a tailings and waste-rock commingling approach at Tarkwa, and is designing a filtration plant for Windfall. The company recorded no significant tailings incidents in the second quarter, and nine level 2 environmental incidents.
4. Autonomous equipment
Granny Smith reached record autonomous truck performance in the first half of 2026. At St Ives the company plans autonomous haulage and materials handling at Invincible to lift output from 2.0 to 3.4 million tonnes a year by 2030.
5. Safety
There were no work-related fatalities in 2025 and six serious injuries, with a total recordable injury frequency rate of 2.31. The first half of 2026 had no fatalities or serious injuries.
6. Community value
The company reports US$5.8 billion of total value created in 2025, of which 30% (US$1.4 billion) stayed with host communities. About 44% of its workforce comes from host communities, and 37% of procurement went to host-community suppliers (Integrated Annual Report 2025).
7. Emissions
Scope 1 and 2 emissions, the direct and purchased-energy emissions, were 1,780 kt CO2 in 2025 against 1,632 kt in 2024, as production grew 18%. Gold Fields targets net zero by 2050 and a 30% net cut in Scope 1 and 2 emissions by 2030 from a 2016 baseline.
All of the figures in this section come from the Integrated Annual Report 2025 and the 2026 interim results, unless a link shows another source.

▶ A short claymation on the seven environmental impacts of mining. · 2:31
What to check before using a Gold Fields figure
- Basis: managed (100% of the mine), attributable (Gold Fields’ share) and equity-weighted figures differ. Tarkwa is 192 koz at 100% but 173 koz attributable.
- Gold-equivalent: silver and copper are converted to gold ounces, so Salares Norte and Cerro Corona are not pure gold figures.
- Ownership changes: Gruyere moved from 50% to 100% on 26 September 2025, and Damang left on 18 April 2026. Year-on-year comparisons must adjust for both.
- AISC basis: check whether by-product credits are deducted and whether the figure is per gold ounce or per gold-equivalent ounce.
- Dates and prices: reserves use a US$2,000 per ounce price, while the realised price in the half-year was US$4,678.
- Tenure: lease expiry dates, especially at Tarkwa, can matter more than grade.
Where satellite data fits in a gold company review
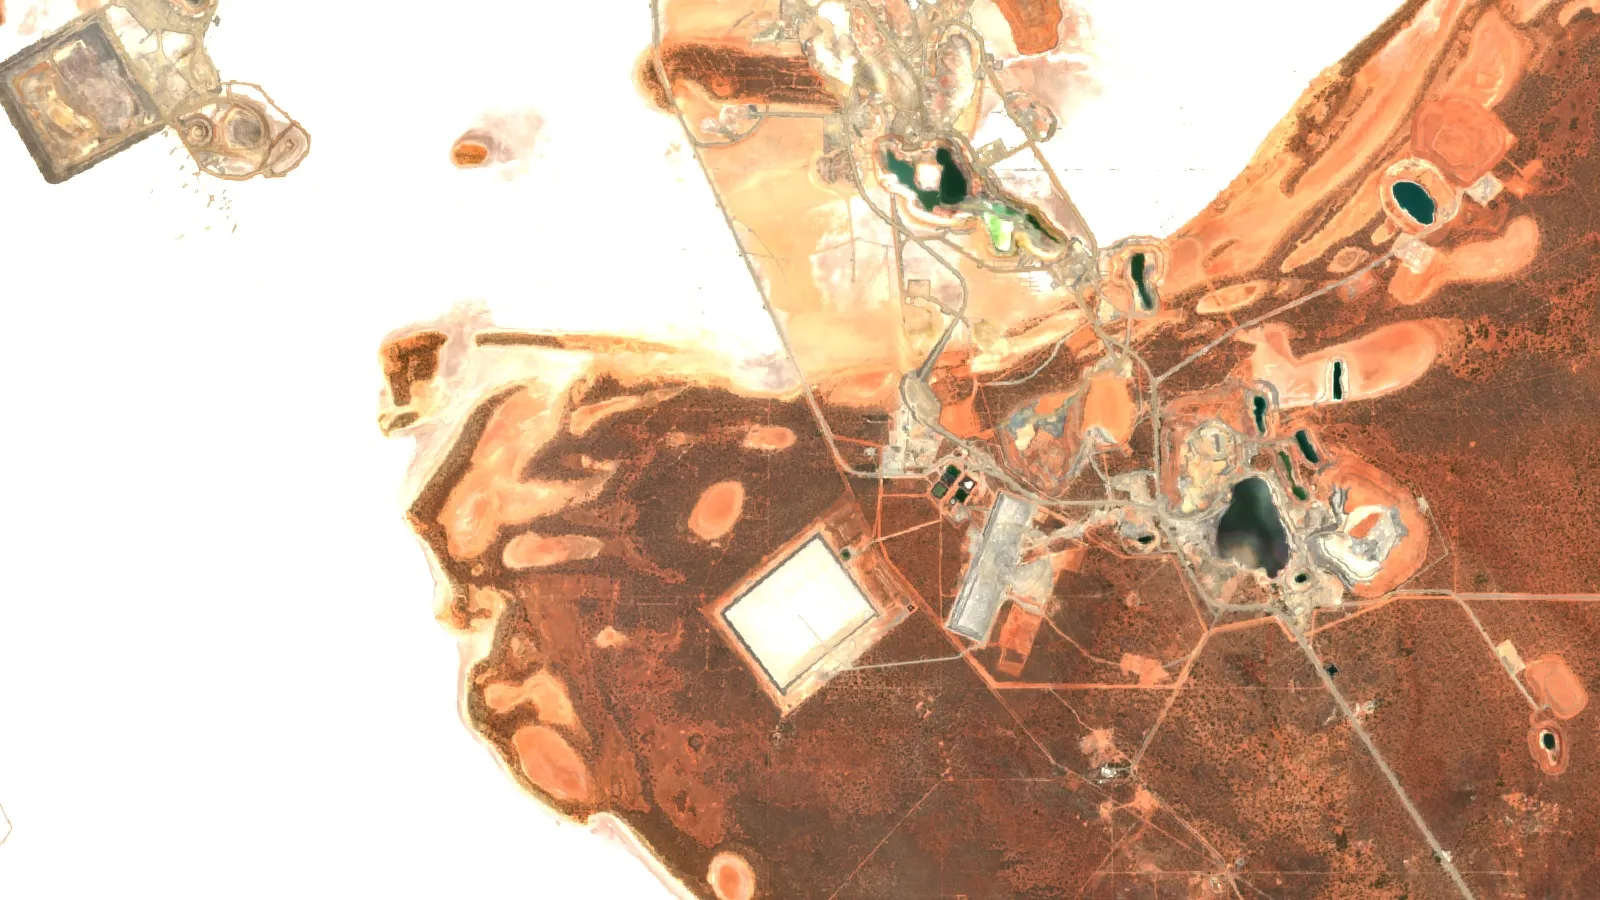
Gold Fields’ reports are the right starting point for company facts. A consultant or licence owner who needs the ground-side view can add satellite screening of an area: land cover change around pits, tailings and roads, and mineral-alteration maps that show where rust, clay or silica patterns are strong. Satellites do not see gold itself, only the rock around it, and the output is an exploration target, not a resource estimate. Farmonaut offers this kind of screening for mining licences; the gold prospecting guide explains the signs and methods.

▶ Explains how satellites map the rock around gold, such as rust stains, clay and faults, rather than the gold itself. · 4:25
If this topic matters to you, read Agnico Eagle Mines Ranked by Gold Output and Cost next.
Related reading on this site: Top 10 AngloGold Ashanti Mines Ranked by Output.
Frequently asked questions
Is Gold Fields the same as Gold Field NV?
People use “Gold Field NV” as a search term for this company. The legal name in its filings is Gold Fields Limited, incorporated in South Africa.
Where is Gold Fields based and where does it trade?
It reports from Johannesburg, South Africa, and its shares trade on the JSE and the NYSE under GFI (interim results, 25 August 2026).
How many mines does Gold Fields operate?
Eight operating mines at 30 June 2026: Salares Norte (Chile), Tarkwa (Ghana), St Ives, Granny Smith, Gruyere and Agnew (Western Australia), South Deep (South Africa) and Cerro Corona (Peru). Windfall in Québec is a development project.
Which Gold Fields mine produces the most gold?
Salares Norte, with 336.9 koz gold-equivalent in the first half of 2026, about 27% of group attributable output.
What is the all-in sustaining cost at Gold Fields?
US$1,893 per ounce in the first half of 2026, with full-year guidance of US$1,800 to US$2,000.
What happened to the Damang mine?
Ghana did not renew the lease. Gold Fields held a 12-month extension to April 2026, and the mine was transferred to the Government of Ghana on 18 April 2026.
Is the Tarkwa lease at risk?
The leases expire in April 2027. Gold Fields applied for renewal in November 2025 and had no formal reply by August 2026. The company warns that an adverse outcome would be material.
How much of Gold Fields’ electricity is renewable?
18% in 2025 and 17.4% in the first half of 2026. Agnew is the leader at 43%.
What is the Global Industry Standard on Tailings Management?
A standard published in August 2020 with 15 principles and 77 auditable requirements, aimed at preventing catastrophic tailings failures (ICMM).
How much gold do Gold Fields’ reserves contain?
48.3 Moz attributable at 31 December 2025, calculated at a gold price of US$2,000 per ounce.
What is the Windfall project?
A high-grade development project in Québec, Canada, awaiting environmental impact assessment approval before a final investment decision. Capital is expected at the upper end of US$1.7 to US$1.9 billion.
How can I compare Gold Fields with other gold miners?
Use the same basis for each company: attributable ounces, AISC defined under the World Gold Council guidance, and the same period. Check by-product credits, which lower headline AISC at silver- and copper-rich mines.
This page is for information only. It is not investment advice. It gives no share price or target, and company figures come from Gold Fields’ own reports on the dates shown.
Farmonaut mining
Map a mining site from space
Consultants can screen a licence area with satellite data for mineral-alteration patterns, as an exploration target ahead of a resource estimate.

Mining Pro sample view, synthetic data
Keep reading
Sources
- Gold Fields, unaudited interim results for the six months ended 30 June 2026 (25 August 2026): goldfields.com
- Gold Fields, Integrated Annual Report 2025: goldfields.com
- Gold Fields, Mineral Resources and Mineral Reserves Supplement 2025: goldfields.com
- USGS, Mineral Commodity Summaries 2026: Gold: pubs.usgs.gov
- World Gold Council, Non-GAAP metrics guide (AISC and AIC): gold.org
- ICMM, Global Industry Standard on Tailings Management: icmm.com
- Mining Technology, Gold Fields to close Damang mine in Ghana: mining-technology.com
- Citi Newsroom, Engineers and Planners officially takes over Damang Mine (18 April 2026): citinewsroom.com
- International Mining, Wind turbine foundations laid at Gold Fields St Ives Renewable Energy project (16 July 2025): im-mining.com
- Fortune, Current price of gold (15 October 2026): fortune.com
Discussion
Questions, corrections or field experience? Share them below. First-time comments are reviewed before they appear, and your email is never published.
No comments yet. Be the first to add a question or your experience.

 Process Metrology LLC
 Dalgety Minerals Pty Ltd
 Vortex Minerals Pty Ltd
 Faith At Work (Pty) Ltd
 Geotech Mining Solutions plc
 Vulcan International Limited
 Kidepo Associates
 GKY Mining
 Alkimy SARL
 Double A Trading
 GemSprout Metals Limited
 Qader Group
 Ileys General Trading
 SG Gold Mining LLC
 VRV Global Pte Ltd
 Omsri International FZE
 G.I.T.T.
 Jaunita Erss Ltd
 Almosi SARL
 SRK Consulting
 Berks Gold Limited
 Mwerezi Minerals Company Limited

 Exploration consultancy · South Africa · Gold










