

Agnico Eagle · Mine-by-mine ranking
Agnico Eagle Mines Ranked by Gold Output and Cost
Agnico Eagle produced 3,447,367 ounces of payable gold at ten mines in 2025, led by Detour Lake at 692,675 ounces (company results, February 2026). Ranked below by output, cost, reserves and outlook.
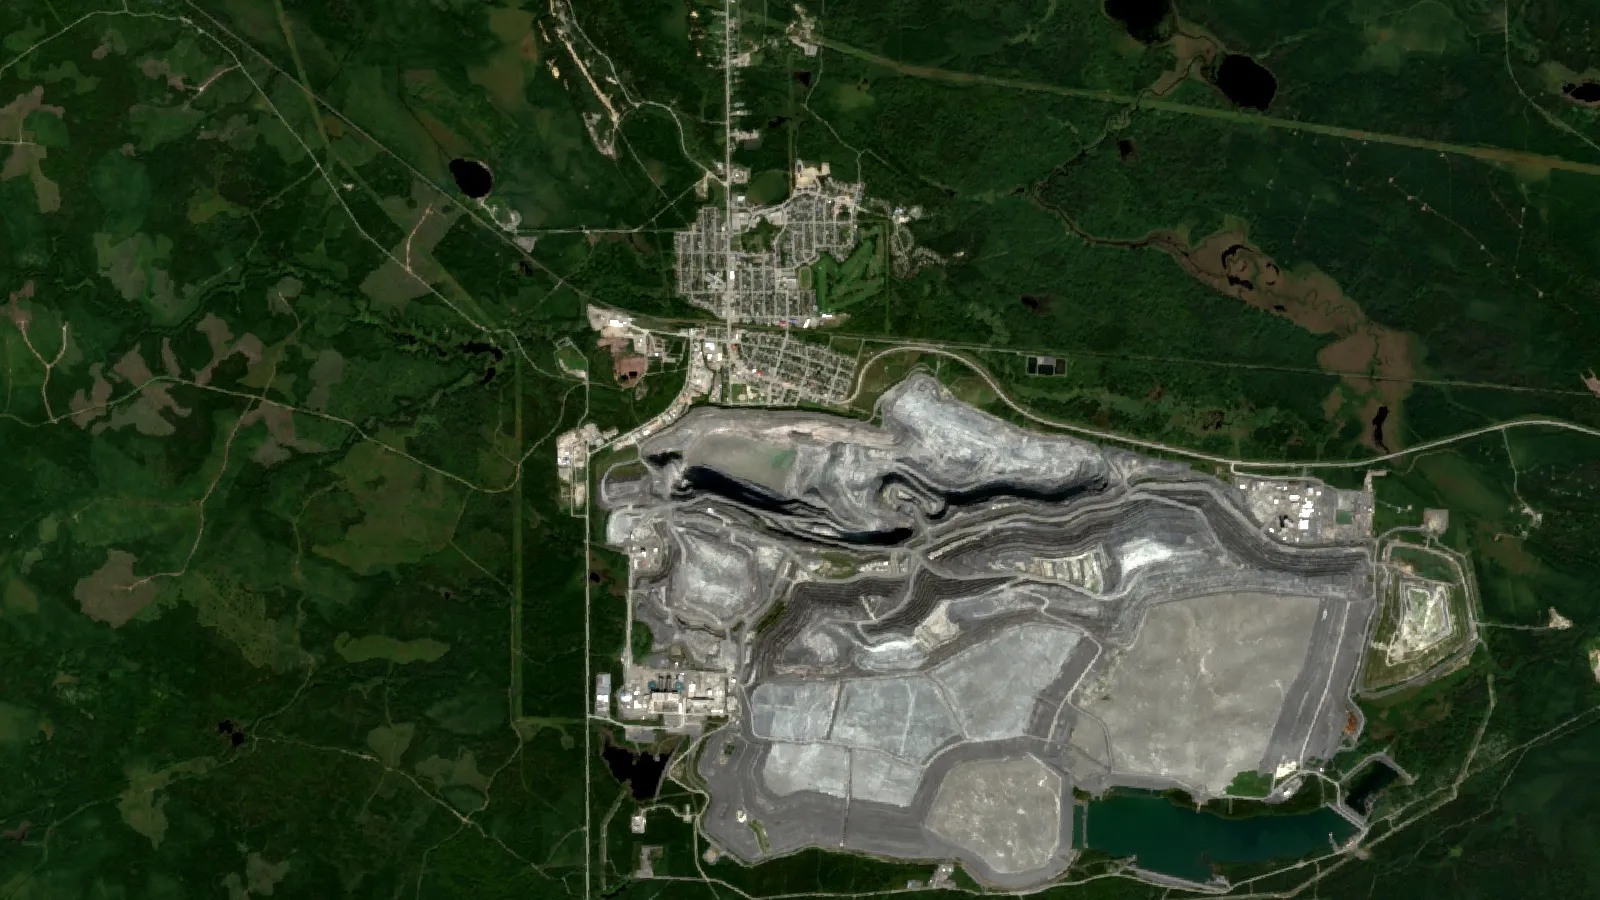
Key takeaways
- Detour Lake (692,675 oz) and Canadian Malartic (642,612 oz) made 39% of the company’s 3,447,367 oz in 2025 (Agnico Eagle Q4 results, 12 February 2026; our arithmetic).
- Seven of the ten mines are in Canada and made 87% of 2025 output; Fosterville, Kittila and Pinos Altos made the other 459,635 oz.
- Second-quarter 2026 AISC was $1,459 per ounce at a realized price of $4,483 per ounce; 2026 AISC guidance is $1,400 to $1,550 (Agnico Eagle, 29 July 2026).
- Proven and probable reserves reached a record 55.4 million oz at the end of 2025, and Detour Lake holds 18.6 million of them.
- A pit-wall movement at Barnat (Canadian Malartic) on 1 July 2026 puts 2026 output near the low end of the 3.3 to 3.5 million oz guidance.
In this article
- How we ranked the mines and where the numbers come from
- Agnico Eagle mines ranked by gold output
- Quebec mines: LaRonde, Canadian Malartic and Goldex
- Ontario mines: Detour Lake and Macassa
- Nunavut mines: Meliadine, Meadowbank and Hope Bay
- Mines outside Canada: Fosterville, Kittila and Pinos Altos
- Cost per ounce by mine
- Reserves and mine life
- Where output is heading at each mine
- What an ounce earns: a margin calculator
- From ore to gold bar: how these mines process their rock
- Agnico Eagle sustainability numbers
- How exploration finds the next mine
- Frequently asked questions
Agnico Eagle runs ten gold mines in four countries: three in Quebec, two in Ontario and two in Nunavut in Canada, plus one each in Australia, Finland and Mexico. Together they produced 3,447,367 ounces of payable gold in 2025, and the biggest, Detour Lake in Ontario, made 692,675 ounces (Agnico Eagle, Q4 2025 results, 12 February 2026). “Payable” gold is the metal in products that have been or will be sold. This page ranks every mine by output, then shows cost per ounce, reserves, the 2026 to 2028 outlook, the sustainability numbers and a margin calculator. It is not investment advice.
How we ranked the mines and where the numbers come from
We ranked the ten operating mines by payable gold production in 2025, the last full year reported. Every production, cost and reserve figure comes from Agnico Eagle’s own filings: the Q4 2025 results release, the 2025 annual report, the second-quarter 2026 report and the 2025 sustainability report. We took the filings’ numbers as published and added our own arithmetic only where we say so.
Two terms matter for the tables. All-in sustaining cost (AISC) is the cost of producing one ounce, including the capital spent to keep the mine running, but not income tax, interest or growth projects. Total cash cost per ounce is a narrower measure that leaves out sustaining capital. Both are non-GAAP measures, which means they are defined by the company and the industry rather than by accounting standards, so compare them only between companies that define them the same way (the World Gold Council uses its own AISC definition for industry averages).
Agnico Eagle describes itself as Canada’s largest mining company and the second largest gold producer in the world, and says it was founded in 1957 and has paid a cash dividend every year since 1983 (Agnico Eagle, 2025 annual report). Those are the company’s own statements. Its Canadian Malartic mine came under 100% ownership on 31 March 2023, when the company closed the Yamana transaction and acquired the 50% it did not already hold, after it acquired Kirkland Lake Gold in February 2022 (same report).
Agnico Eagle mines ranked by gold output
The table lists all ten operating mines, largest first. Detour Lake and Canadian Malartic together made 1,335,287 ounces in 2025, which is 39% of the company total (our arithmetic from the filing). The 2026 range is the guidance the company issued in February 2026. The last column shows what each mine actually produced in the first six months of 2026 (Agnico Eagle, Q2 2026 report).
Chart
Payable gold production by mine, 2025
Thousand ounces, eight largest of ten operating mines
| Rank | Mine | Region | 2025 output (oz) | 2026 guidance (oz) | First six months of 2026 (oz) |
|---|---|---|---|---|---|
| 1 | Detour Lake | Ontario, Canada | 692,675 | 700,000-730,000 | 384,298 |
| 2 | Canadian Malartic | Quebec, Canada | 642,612 | 575,000-605,000 | 301,459 |
| 3 | Meadowbank | Nunavut, Canada | 493,314 | 475,000-495,000 | 214,027 |
| 4 | Meliadine | Nunavut, Canada | 376,346 | 380,000-400,000 | 191,347 |
| 5 | LaRonde | Quebec, Canada | 344,555 | 330,000-350,000 | 162,857 |
| 6 | Macassa | Ontario, Canada | 312,729 | 305,000-325,000 | 135,736 |
| 7 | Kittila | Lapland, Finland | 217,379 | 210,000-230,000 | 110,496 |
| 8 | Fosterville | Victoria, Australia | 160,522 | 140,000-160,000 | 83,455 |
| 9 | Goldex | Quebec, Canada | 125,501 | 115,000-125,000 | 58,649 |
| 10 | Pinos Altos | Chihuahua, Mexico | 81,734 | 70,000-80,000 | 38,601 |
Seven of the ten mines are in Canada, and they made 2,987,732 ounces, or 87% of the 2025 total. The three mines abroad made 459,635 ounces. Sources: Q4 2025 results (2025 output and guidance) and the Q2 2026 report (first six months).
For scale, the US Geological Survey estimates world gold mine output at 3,300 tonnes in 2025 and Canada’s at 200 tonnes. Official Canadian figures are published by Natural Resources Canada and Statistics Canada. Agnico Eagle’s 3.447 million ounces equals about 107 tonnes (at 31.1035 grams per troy ounce), so roughly 3% of world output, and its Canadian ounces equal about 93 tonnes, roughly 46% of the USGS estimate for Canada. Treat the second figure as approximate because the USGS number is an estimate and the company reports payable rather than mined ounces.
Quebec mines: LaRonde, Canadian Malartic and Goldex
All three Quebec mines sit in the Abitibi region, a greenstone belt (a belt of ancient volcanic rock where many Canadian gold camps lie). For the geology, see our guide to the Abitibi greenstone belt.
LaRonde is an underground complex that includes the LaRonde Zone 5 mine. Its reserves were about 2.8 million ounces at 31 December 2025, and the mine plans run to 2034 (LaRonde) and 2036 (Zone 5). The company notes that seismic risk rises as it mines deeper there (2025 annual report).
Canadian Malartic is the second-largest producer. The original Canadian Malartic pit was depleted in 2023, open pit mining continues at the Barnat pit, and the underground Odyssey mine is being built around a shaft planned to reach 1,800 metres. Reserves were about 9.1 million ounces, including 5.7 million ounces at the East Gouldie deposit, and the plan runs to 2042 (same report). On 1 July 2026 a rock mass movement hit the north wall of the Barnat pit. The company reported no injuries, equipment damage or environmental impact, suspended mining there, and expected to resume in the fourth quarter of 2026 (Q2 2026 report). Our guide to Quebec’s Malartic gold mine covers the ownership history and the land around the pit.
Goldex is an underground mine at Val-d’Or with about 0.9 million ounces of reserves and a plan to 2032; it also feeds ore from the Akasaba West open pit to its mill.
Ontario mines: Detour Lake and Macassa
Detour Lake, in northeastern Ontario about 300 kilometres northeast of Timmins, is described in the company’s results as Canada’s largest gold mine. It holds about 18.6 million ounces of reserves, more than a third of the company’s 55.4 million, and the current plan runs to 2052. The company is studying an underground mine under the open pit and has set aside $300 million in total for that work, with a decision possible in 2027 (annual report).
Macassa is an underground mine in the historic Kirkland Lake camp, where production under earlier owners began in 1933. Reserves were about 2.2 million ounces and the mine plan runs to 2032. The company has also begun developing Upper Beaver, a gold-copper project in the same camp. For the regional picture, see our guide to gold deposits in Ontario.
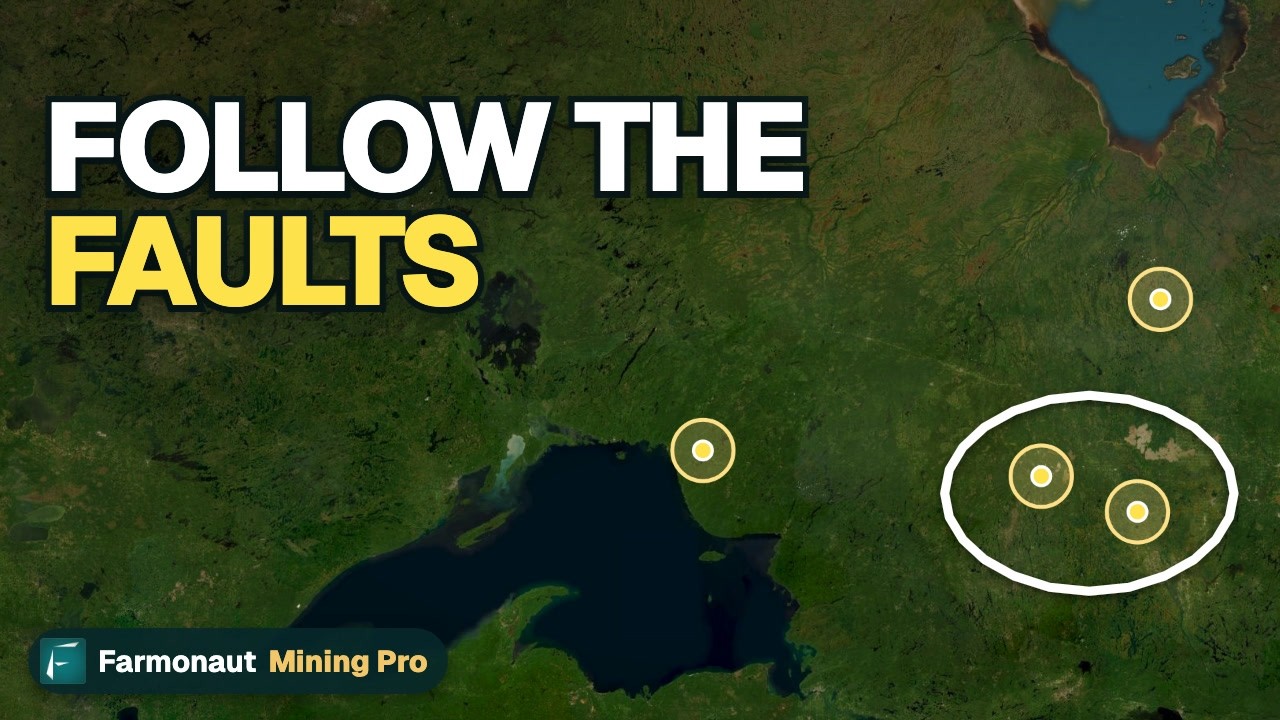
▶ Shows where Ontario’s gold belts are and the big camps from Timmins to Kirkland Lake. · 2:53
Nunavut mines: Meliadine, Meadowbank and Hope Bay
Meliadine is 25 kilometres north of Rankin Inlet on the west shore of Hudson Bay, with about 3.6 million ounces of reserves and a plan to 2036. Meadowbank now mines the Amaruq open pit and underground deposits, 50 kilometres northwest of the old Meadowbank pit, and processes the ore at the Meadowbank mill. Its reserves are about 1.5 million ounces and its plan runs to 2030 (annual report).
Hope Bay is the project that will replace some of that output. Mining was suspended there in February 2022, following the company’s acquisition of the property. On 19 May 2026 the company announced a positive investment decision, based on a study of 400,000 to 435,000 ounces a year over an initial 11-year mine life, and its 2026 capital spending guidance (excluding capitalized exploration) rose to $2.6 to $2.8 billion as a result. Reserves were about 3.4 million ounces at the end of 2025 (Q2 2026 results release).
Mines outside Canada: Fosterville, Kittila and Pinos Altos
Fosterville is an underground mine about 20 kilometres northeast of Bendigo in Victoria, Australia. Output fell from 225,203 ounces in 2024 to 160,522 in 2025, and the company expects lower grades there in 2026 (Q4 2025 results). Reserves are about 1.7 million ounces with a plan to 2037.
Kittila in Finnish Lapland, 150 kilometres north of the Arctic Circle, has been in production since 2009. It has about 3.3 million ounces of reserves and a plan to 2037.
Pinos Altos in Chihuahua, northern Mexico, is the smallest mine. Its reserves are about 0.3 million ounces and the plan runs to 2028. Separately, the company is earning a 50% interest in the San Nicolas copper-zinc project in Zacatecas, jointly with Teck Resources.
Cost per ounce by mine
Cost differences between the mines are large. In 2025 the cheapest producer by total cash cost was Macassa at $793 an ounce and the dearest was Pinos Altos at $2,006 (the company’s revised measure). For 2026 the company guides to a consolidated total cash cost of $1,070 an ounce at the midpoint, about 12% above 2025, and an AISC of $1,400 to $1,550 for the year. It names four reasons: higher royalties tied to the gold price (about $36 an ounce), cost inflation (about $33), a weaker US dollar against the Canadian dollar (about $31) and lower grades at Macassa, Fosterville, Meadowbank and Canadian Malartic (about $17).
Chart
Total cash cost per ounce: 2025 actual and 2026 guidance
US$ per ounce, eight mines; 2026 uses the midpoint of production guidance
Actual results have stayed inside that range so far. In the second quarter of 2026 the company reported an AISC of $1,459 an ounce on 855,816 ounces, and $1,471 for the first six months (Q2 2026 report). The World Gold Council puts the global producer average at US$1,785 an ounce for the first quarter of 2026, and calls that quarter the 28th consecutive year-on-year increase in AISC. The two measures use different definitions and periods, so read them as a rough guide to where Agnico Eagle sits, not an exact league table.
Reserves and mine life
Proven and probable reserves are the part of a deposit that a company has shown can be mined at a profit under stated assumptions. At the end of 2025 Agnico Eagle reported a record 55.4 million ounces, up 2.1%. It replaced the 3.0 million ounces it mined that year and added the Marban project. Most operating mines were valued at a gold price of $1,600 an ounce, far below the prices of 2025 and 2026 (Q4 2025 results). Detour Lake alone holds 18.6 million ounces, and Canadian Malartic 9.1 million.
Chart
Proven and probable gold reserves, end of 2025
Million ounces, seven operating mines plus Hope Bay (a development project)
Mine life tells you how long the current plan lasts, not how long a mine could last. The plans run to 2052 (Detour Lake), 2042 (Canadian Malartic), 2037 (Kittila and Fosterville), 2036 (Meliadine), 2034 (LaRonde), 2032 (Macassa and Goldex), 2030 (Meadowbank) and 2028 (Pinos Altos). Companies extend mine lives when drilling adds reserves, which is why the company spends heavily on exploration: its 2026 guidance includes $185 to $205 million of exploration and $290 to $330 million of capitalized exploration.
Where output is heading at each mine
The company guides to 3.3 to 3.5 million ounces a year for 2026, 2027 and 2028, but the mix changes. Detour Lake is expected to fall from about 715,000 ounces in 2026 to about 605,000 in 2028 as grades drop, and Meadowbank from about 485,000 to 275,000 as it switches from open pit to underground. Canadian Malartic rises from about 590,000 to 735,000 as East Gouldie ramps up (midpoints of the February 2026 guidance, our calculation). In July 2026 the company said 2026 output should land near the low end of the range because of the Barnat redesign, which management said on the results call puts 370,000 ounces of gold beyond reach (earnings call highlights).
Chart
Guided output at three mines, 2025 to 2028
Thousand ounces; 2026 to 2028 are midpoints of the February 2026 guidance
The company says its pipeline could lift annual output by 20% to 30% over the next decade, to more than four million ounces in the early 2030s. That is a company target, not a forecast. It rests on the Canadian Malartic and Detour Lake expansions plus new mines at Upper Beaver, Hope Bay and San Nicolas.
What an ounce earns: a margin calculator
An ounce of gold sold for much more than it cost to mine is where the money is made, and the company’s own numbers show how wide that gap has become. Its realized gold price was $4,163 an ounce in the fourth quarter of 2025 and $4,483 in the second quarter of 2026, against an AISC of $1,459 in the second quarter. Use the calculator below to test your own mix of ounces, price, cost and tax rate. The tax default reflects the company’s guided effective rate of 34% to 36% for 2026. The calculator ignores growth capital, depreciation and royalties beyond what AISC already includes, so it overstates what reaches shareholders.
Calculator
What margin does a gold mine make per year?
Enter your own ounces, price, cost and tax rate.
- Margin before tax per year: $250,000,000
- Margin per ounce: $2,500
- AISC as a share of the price (%): 37.5
Example values only, not a forecast. Gold price and AISC are inputs: use today’s price and your own cost. Agnico Eagle guides to an AISC of $1,400 to $1,550 an ounce and an effective tax rate of 34% to 36% for 2026 (Agnico Eagle, Q4 2025 results). AISC leaves out income tax, interest and growth capital, so the result overstates what reaches owners.
From ore to gold bar: how these mines process their rock
In a typical gold mine, rock is drilled and blasted, hauled to a crusher and ground into a slurry in a mill, and the gold is dissolved with cyanide and caught on carbon. It is then stripped off the carbon, collected by electrowinning, melted into doré bars (rough bars that are mostly gold and silver) and sent to a refinery. The video below follows one nugget through the steps.

▶ Follows a gold nugget from rock to ring through drilling, crushing, leaching and refining. · 5:27
Agnico Eagle sustainability numbers
The company reports against the Mining Association of Canada’s Towards Sustainable Mining protocols, which are mandatory for that association’s members at their Canadian sites. The 2025 sustainability report gives these figures:
- Greenhouse gas emissions were 1.36 million tonnes of CO2e in 2025, or 0.39 tonnes per ounce of gold, against 1.34 million tonnes and 0.38 in 2023. The company targets a 30% cut in scope 1 and 2 emissions by 2030 and has a net-zero ambition for 2050.
- 74% of water used was reused or recycled, against 68% in 2024.
- The total recordable injury rate was 4.83 per million hours worked, down from 5.14 in 2024. One fatality occurred in 2025; there were none in 2023 or 2024.
- There were no significant environmental incidents, and about 13,000 hectares of land were physically disturbed by mining.
- Operations paid $2.02 billion to local suppliers, 73% of employment was local, and the company counted 683 Indigenous employees.
Source for the list: Agnico Eagle, 2025 Sustainability Report. A signed power purchase agreement for a wind farm at Hope Bay is one of the steps the report lists toward the 2030 target.
How exploration finds the next mine
New ounces come from drilling near existing mines and from early screening of fresh ground. At Odyssey, the company ran 10 surface rigs and seven underground rigs in the second quarter of 2026 and drilled 42,743 metres, with intersections such as 13.7 grams per tonne of gold over 14.6 metres in the new Artemis zone. A gram per tonne (g/t) is the standard grade unit, and 1 g/t is one gram of gold in each tonne of rock.
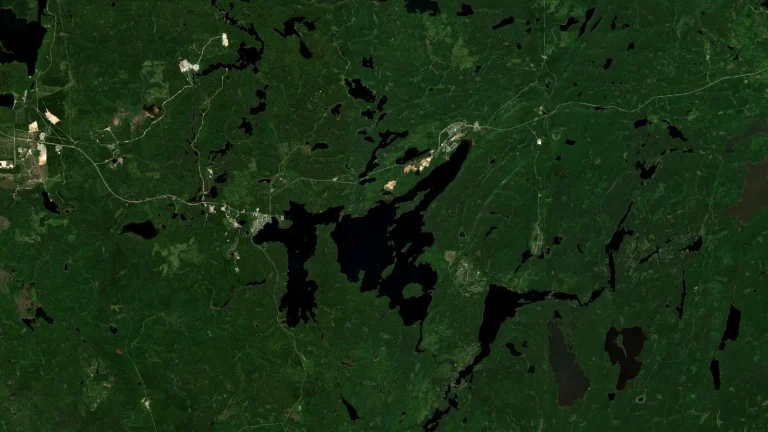
Before drills turn, satellites can screen a large licence area for the alteration minerals, iron staining and fault patterns that often sit around gold systems. A satellite does not see gold itself, so a screen produces exploration targets to be checked on the ground and ahead of any resource estimate. The video below explains what satellites can and cannot show. Farmonaut offers this kind of satellite-based mineral detection for licence holders, and you can request a quote or contact us with an area.

▶ Explains what satellites can and cannot show when screening ground for gold. · 4:25
For a closer look at a related question, see our guide: Top 10 AngloGold Ashanti Mines Ranked by Output.
Frequently asked questions
How many mines does Agnico Eagle operate?
Ten operating gold mines, in Canada, Australia, Finland and Mexico (2025 annual report): LaRonde, Canadian Malartic and Goldex in Quebec; Detour Lake and Macassa in Ontario; Meliadine and Meadowbank in Nunavut; Fosterville in Australia; Kittila in Finland; and Pinos Altos in Mexico.
Which is Agnico Eagle’s biggest mine?
Detour Lake in northeastern Ontario, with 692,675 ounces of payable gold in 2025 and 18.6 million ounces of reserves.
How much gold does Agnico Eagle produce?
It produced 3,447,367 ounces in 2025 and guides to 3.3 to 3.5 million ounces a year for 2026 to 2028. After the Barnat pit event, it expects 2026 near the low end of that range.
Where are Agnico Eagle’s mines located?
Seven are in Canada (Quebec, Ontario and Nunavut). The others are Fosterville in Victoria, Australia, Kittila in Finnish Lapland and Pinos Altos in Chihuahua, Mexico. Development projects are at Hope Bay (Nunavut), Upper Beaver (Ontario) and San Nicolas (Zacatecas, Mexico).
What is Agnico Eagle’s all-in sustaining cost?
It was $1,339 an ounce for 2025 on the company’s earlier basis, and $1,459 in the second quarter of 2026. Full-year 2026 guidance is $1,400 to $1,550 an ounce.
Is Agnico Eagle a sustainable miner?
The company publishes detailed figures, listed above: 0.39 tonnes of CO2e per ounce, 74% of water reused or recycled and no significant environmental incidents in 2025, alongside one fatality. Judge it by the trend in those figures and by its progress toward the 30% emissions target for 2030.
What happened at Canadian Malartic?
A rock mass movement on 1 July 2026 on the north wall of the Barnat open pit led the company to suspend mining there while it redesigned the pit. No injuries or environmental impact were reported, and it expected to resume in the fourth quarter of 2026.
Where is Agnico Eagle listed?
Its shares trade on the New York Stock Exchange and the Toronto Stock Exchange under the symbol AEM. This page covers the mines, not the share price.
What is the Hope Bay project?
A gold project in Nunavut that the company given a positive investment decision on 19 May 2026, based on a study of planned output of 400,000 to 435,000 ounces a year over an initial 11 years.
Who owns Canadian Malartic?
Agnico Eagle has owned 100% since 31 March 2023, when it acquired the 50% it did not hold in the Yamana transaction.
This page is for information only. It is not investment advice. It gives no price targets and does not consider your goals or risk tolerance. Company results and guidance change, so check Agnico Eagle’s latest filings before you rely on any figure.
Farmonaut mining
Map your mining site from space
Consultants can screen a licence area by satellite for exploration targets, ahead of a resource estimate.

Mining Pro sample view, synthetic data
Keep reading
Sources
- Agnico Eagle, Fourth quarter and full year 2025 results (12 February 2026): s205.q4cdn.com
- Agnico Eagle, Second quarter 2026 report (MD&A): s205.q4cdn.com
- Agnico Eagle, Second quarter 2026 results release (29 July 2026): finance.yahoo.com
- Agnico Eagle, Q2 2026 earnings call highlights: finance.yahoo.com
- Agnico Eagle, 2025 annual report: s205.q4cdn.com
- Agnico Eagle, 2025 Sustainability Report: s205.q4cdn.com
- USGS, Mineral Commodity Summaries 2026: Gold: pubs.usgs.gov
- World Gold Council, Record gold prices outpace rising mining costs in Q1’26: gold.org
- Mining Association of Canada, Towards Sustainable Mining: mining.ca
- Natural Resources Canada, Minerals and metals statistics: production: mmsd.nrcan-rncan.gc.ca
Discussion
Questions, corrections or field experience? Share them below. First-time comments are reviewed before they appear, and your email is never published.
No comments yet. Be the first to add a question or your experience.

 VRV Global Pte Ltd
 Omsri International FZE
 G.I.T.T.
 Jaunita Erss Ltd
 Almosi SARL
 SRK Consulting
 Berks Gold Limited
 Mwerezi Minerals Company Limited
 Mining SARL
 SenGold Invest SAS
 Sean Mining Limited
 NTS Group (Pty) Ltd
 Mine4Africa
 Lithspo Minerals Limited
 Tintina Mining Group

 Licence holder · Nigeria · Gold + lithium










