

Gold miners · Mine-by-mine ranking
Top 10 AngloGold Ashanti Mines Ranked by Output
AngloGold Ashanti produced 3.09 million ounces from 10 operations in 8 countries in 2025 (annual report). Sukari in Egypt led with 500,000 ounces, then Geita with 492,000. This page ranks all ten, with costs, Obuasi, Nevada projects and a margin calculator.
Key takeaways
- The group poured 3.091 million ounces in 2025, up 16% from 2.661 million, mostly because Sukari joined in November 2024 (AngloGold Ashanti 2025 Annual Report).
- Sukari (500,000 oz, US$783 per oz) and Geita (492,000 oz, US$1,038) were the two largest mines; Siguiri had the highest total cash cost at US$1,783 per oz (2025 Annual Report).
- The Ashanti gold mine is Obuasi in Ghana: an underground mine opened in 1897 that produced 266,000 oz in 2025, up from 221,000 (Annual Report; Wikipedia).
- First-half 2026 group all-in sustaining cost was US$1,998 per oz against an average price received of US$4,650 (31 July 2026 results release).
- Nevada is the growth centre: 6.4 Moz of reserve, with North Bullfrog first and the Arthur Gold Project (4.9 Moz reserve) behind it (2025 Annual Report).
In this article
- Top 10 AngloGold Ashanti mines ranked by gold output
- How we ranked the mines
- Africa: Sukari, Geita, Kibali, Siguiri, Obuasi and Iduapriem
- Where is the Ashanti gold mine? Obuasi in Ghana
- Australia: Sunrise Dam and Tropicana
- Americas: Cuiabá and Cerro Vanguardia
- AngloGold Ashanti costs: what an ounce costs and earns
- Projects: Nevada, the Geita expansion and brownfield growth
- Mines bought, sold and paused
- Latest quarterly output and guidance
- Water, power and communities at the mines
- How satellites help check a mine area from space
- Frequently asked questions
AngloGold Ashanti (AGA) ran or part-owned 10 gold operations in 8 countries at the end of 2025, and together they poured 3.09 million ounces (Moz) of gold in 2025, according to the company’s 2025 annual report. The largest single mine by output was Sukari in Egypt (500,000 ounces), followed by Geita in Tanzania (492,000 ounces). The mine many people mean by the “Ashanti gold mine” is Obuasi in Ghana, which made 266,000 ounces. This page ranks all ten operations by 2025 output, shows what each one costs to run, explains what changed in 2026, and ends with a margin calculator you can fill in with your own numbers.
AGA was formed in 2004 when AngloGold and Ashanti Goldfields merged. Today the parent is AngloGold Ashanti plc, incorporated in England and Wales, with shares listed in New York (AU), Johannesburg (ANG) and Accra (AGA), per its 31 July 2026 results release. This page gives facts only. It is not investment advice.
Top 10 AngloGold Ashanti mines ranked by gold output
The ranking below uses gold produced in calendar 2025, as reported in the annual report. Ounces are the figure AGA reports: whole-mine ounces for the operations it manages and consolidates, and AGA’s share only for Tropicana (70%) and Kibali (45%). “Total cash cost” is the company’s measure of what it costs to mine, process and sell an ounce, including royalties, but not the sustaining capital spend that is added in the all-in figure.
Chart
Gold produced in 2025 by operation
Thousand ounces; eight largest of ten operations (Tropicana 70% and Kibali 45% shares)
| Rank | Mine | Country | 2025 gold (thousand oz) | Total cash cost (US$ per oz) |
|---|---|---|---|---|
| 1 | Sukari | Egypt | 500 | 783 |
| 2 | Geita | Tanzania | 492 | 1,038 |
| 3 | Tropicana (70% share) | Australia | 305 | 1,330 |
| 4 | Kibali (45% share) | DR Congo | 303 | 1,148 |
| 5 | Siguiri | Guinea | 289 | 1,783 |
| 6 | AGA Mineração (Cuiabá complex) | Brazil | 273 | 976 |
| 7 | Obuasi | Ghana | 266 | 1,325 |
| 8 | Sunrise Dam | Australia | 232 | 1,634 |
| 9 | Iduapriem | Ghana | 199 | 1,482 |
| 10 | Cerro Vanguardia | Argentina | 179 | 1,227 |
Source for every row: AngloGold Ashanti plc, 2025 Annual Report, cost tables (rounded). Serra Grande in Brazil also produced 53,000 ounces in 2025 before it was sold, so it is left out of the ranking. Rankings can swap places from year to year because the gaps are small: Tropicana and Kibali are only 2,000 ounces apart.
How we ranked the mines
We used one metric, gold produced in 2025, taken from one source, the company’s own annual report, so every number sits on the same reporting basis. We included every operation that was producing at the end of 2025, which is ten. Joint-venture mines are shown on the basis the company uses, which means Kibali is operated by Barrick and AGA reports its 45% share.
Ounces are not the same as profit. A smaller mine with low costs can earn more per ounce than a larger one with high costs, which is why the cost column matters. We did not rank by reserves, because the annual report gives reserves by region and project rather than a clean figure for every mine. At group level, AGA reported a gold Mineral Reserve of 36.5 Moz and a Measured and Indicated Mineral Resource of 68.0 Moz at 31 December 2025. A Mineral Reserve is the part of a deposit that can be mined at a profit under stated assumptions. A Mineral Resource is a larger estimate that has not yet cleared that test.
To put the size in context, 3.09 Moz is about 96 tonnes of gold. The World Gold Council puts annual mine production grew fractionally y/y to a new record high of 3,672t in 2025, so AGA’s reported output is roughly 2.6% of the world total. That is a rough guide only, because AGA counts some partly owned mines on a whole-mine basis.
Africa: Sukari, Geita, Kibali, Siguiri, Obuasi and Iduapriem
Africa produced 2.05 Moz in 2025, or 66% of the group, and holds 22.6 Moz of the 36.5 Moz reserve (62%), according to the annual report. Six of the ten operations are here.
Sukari, Egypt
Sukari came into the group with the takeover of Centamin plc on 22 November 2024, so 2025 was its first full year. It produced 500,000 ounces at a total cash cost of US$783 per ounce, the lowest in the portfolio. The plant treated 12.18 million tonnes at an average grade of 1.37 grams per tonne (g/t) with 89% recovery. AGA’s subsidiary owns 50% of the operating company and the other 50% is held by MRMIA (formerly EMRA), an Egyptian state body, but AGA consolidates the mine, so the full 500,000 ounces appear in the group total. Sukari mines both an open pit and an underground mine.
Geita, Tanzania
Geita made 492,000 ounces in 2025, up 2%, because the average grade rose 8% to 3.26 g/t as more ore came from the Nyamulilima open cut. Total cash cost rose 5% to US$1,038 per ounce. The Citizen reported in 2022 that Geita had been producing for more than 20 years and had added three new underground mines at Nyankanga, Star and Comet, and Geita Hill. The current reserve gives about seven years of mine life. AGA added US$15 million a year for three years to exploration at Geita to lift that to more than 10 years, and a conceptual study suggests a plant expansion could lift output to about 600,000 ounces a year for at least a decade. A feasibility study is due in 2027. Miningmx reported a US$100 million Geita expansion plan in November 2025. For a regional overview of Tanzanian licences, see our guide to gold exploration in Tanzania.
Kibali, Democratic Republic of the Congo
Kibali is run by Barrick, and AGA holds 45% through a joint venture. AGA’s share of output was 303,000 ounces in 2025, down 2% from 309,000, because the average head grade slipped from 2.82 to 2.79 g/t and tonnes treated fell 2%. Total cash cost rose 23% to US$1,148 per ounce, mainly from higher consumable and mining costs and higher royalties linked to the gold price. In Q2 2026, Kibali contributed 76,000 ounces to the group.
Siguiri, Guinea
Siguiri produced 289,000 ounces in 2025, up 6%, after plant recovery improved from 85% to 91%. Ecofin reported it was Guinea’s largest gold mine and about 9% of AGA’s output. It is the highest-cost operation in the group at US$1,783 per ounce. A 43-day plant stoppage in the second half dealt with seepage on a section of the tailings storage facility wall after heavy rain. The annual report says approval for the Block 3 mining area is in place and a feasibility study for a new tailings dam is planned for 2026. AGA owns 85%.
Obuasi, Ghana
Obuasi is covered in detail in the next section, because it is what most searches for the Ashanti gold mine are looking for.
Iduapriem, Ghana
Iduapriem was the weak spot in 2025. Output fell 16% to 199,000 ounces, and cost rose 33% to US$1,482 per ounce. The causes were a 17-day plant shutdown in the first quarter to repair a tear in the lining of the Beposo tailings facility, lower recovered grades after two higher-grade pits were mined out, and power supply interruptions. Higher-grade ore from the Block 7/8 Cut 1 pit came on in the second half. In May 2025 AGA also paused talks with Gold Fields about combining Iduapriem with the neighbouring Tarkwa mine.
Where is the Ashanti gold mine? Obuasi in Ghana
The Ashanti gold mine is Obuasi, an underground mine near the town of Obuasi in Ghana’s Ashanti Region. It opened in 1897 and was once among the ten largest gold mines in the world. Ghana’s Ashanti Region lies in the south-central part of the country, and the mine sits at about 6.15 degrees north, 1.69 degrees west. The company name comes from the same region: Ashanti Goldfields Corporation owned Obuasi before the 2004 merger.
After a restart and rebuild, Obuasi is still ramping up. It produced 266,000 ounces in 2025, up from 221,000 in 2024, helped by a 13% higher mill head grade, a 3% recovery gain to 89% and 4% more tonnes treated. Total cash cost was US$1,325 per ounce, up 9%. The mine uses a hybrid approach that combines underhand drift-and-fill mining, used in higher-grade areas, with conventional sub-level open stoping. Commissioning of material-handling equipment for the Kwesi Mensa Shaft refurbishment was due in the second half of 2026.
In 2026, a contractor died at Obuasi on 24 April, and AGA says this lowered Q2 production. The investigation is complete and corrective actions are under way. AGA’s reserve report lists a 0.6 Moz reserve addition at Obuasi in 2025, linked to a higher gold price and geological reinterpretation, after depletion and cost.
Ghana matters beyond one mine. The USGS estimated Ghana’s gold mine production at 150 tonnes in 2025 (estimate). Reuters reported, via the Ghana Chamber of Mines, a record 6 million ounces in 2025, of which large-scale mines made 2.9 million. Obuasi and Iduapriem together made 465,000 ounces, so AGA’s two Ghanaian mines were about 16% of large-scale output (our calculation from the two sources). EITI reports that mining and quarrying are now the largest source of direct domestic tax revenue in Ghana.
Ghana now charges gold royalties on a sliding scale (L.I. 2517) in force since 10 March 2026: 5% at gold up to US$1,900/oz, rising to 12% above US$4,500/oz; small-scale miners pay a flat 2%. The Ghana Chamber of Mines paper reported by Reuters in February 2026 estimated that a rise from 5% to 7% at US$2,044 per ounce would cut Obuasi’s net present value by 8%. Use the rate in the regulations in force when you model any Ghanaian mine.
Australia: Sunrise Dam and Tropicana
Both Australian mines are in Western Australia. Together they made 537,000 ounces in 2025, down from 572,000.
Tropicana
AGA manages Tropicana and owns 70%. Its share of output was 305,000 ounces at US$1,330 per ounce, against 313,000 ounces at US$1,132 in 2024. Output fell 3% as more low-grade stockpile ore was processed. A 62 MW renewable power plant was commissioned in February 2025 next to the existing 54 MW gas-fired system. The company says the combined system cuts emissions by 65,000 tonnes of CO2-equivalent a year. The Havana underground mine is on track to deliver first ore in the first quarter of 2027 and is planned to produce 185,000 ounces over three years.
Sunrise Dam
Sunrise Dam produced 232,000 ounces, down 10%, because the underground mine moved less ore (2.4 million tonnes) at lower grades. Cost rose to US$1,634 per ounce from US$1,343. Recovery improved by 3% to 89% after better carbon and cyanide management. The ore came largely from the Vogue zone, with the Astro zone starting to contribute late in the year.
Americas: Cuiabá and Cerro Vanguardia
AGA’s producing operations in the Americas are in Brazil and Argentina. They made 505,000 ounces in 2025, down from 526,000, with the fall coming from the sale of Serra Grande.
AGA Mineração, Brazil
The Cuiabá complex produced 273,000 ounces at US$976 per ounce, the second-lowest cost after Sukari. Since the Queiroz plant restarted in September 2024, gold is counted when it is poured at Queiroz rather than when concentrate is shipped. The 2026 plan is to lift Cuiabá plant capacity from 1.4 to 2.0 million tonnes a year. Serra Grande, the third Brazilian mine, was sold in December 2025.
Cerro Vanguardia, Argentina
Cerro Vanguardia made 179,000 ounces at US$1,227 per ounce, helped by 34,000 ounces from heap leach, which was 10% higher after material on the pad slopes was releached. It also produced 3.3 Moz of silver, and silver sales are about 80% of the group’s by-product revenue. AGA owns 92.5%. The 2025 annual report records a decision in October 2025 to cease greenfield exploration and target generation in Argentina, but exploration near the mine, including the Michelle property, continues to look for more years of mine life.
AngloGold Ashanti costs: what an ounce costs and earns
Costs decide how much of a high gold price reaches the bottom line. Two cost measures appear in AGA’s reports. Total cash cost covers mining, processing, site overheads and royalties. All-in sustaining cost (AISC) adds the capital needed to keep the mines running, so it is the better guide to margin. For the group, AISC was US$1,709 per ounce in 2025 (annual report) and US$1,998 in the first half of 2026, per the 31 July 2026 results. The average gold price received was US$3,468 per ounce in 2025, up 45% from US$2,394, and US$4,650 in the first half of 2026.
Chart
Bigger mines were not always cheaper
Eight of ten operations, 2025
The 2026 cost increase has three causes that AGA names: higher royalties that rise with the gold price, wage and contractor inflation, and fuel and exchange rates. The company says its own efficiency programme cut controllable cost by US$20 per ounce in the first half of 2026 compared with a year earlier. Our guide to cost-effective gold extraction strategies covers the mine and plant levers behind those numbers, and the short video below shows the main steps from rock to refined bar.
The scatter chart in this section plots output against cost for eight of the ten mines (the table above has all ten). Large and cheap sits at the lower right: Sukari is far to the right and the lowest on the cost axis. Small and costly sits at the upper left: Iduapriem (US$1,482) and Sunrise Dam (US$1,634) both made under 250,000 ounces.
Calculator
What is a gold mine’s margin per ounce?
Enter your own ounces, price, cost and tax rate. Results update as you type.
- Margin per ounce before tax: $2,000
- Margin before tax: $200,000,000
- Break-even price (equals your AISC): $2,000
Example values only, not benchmarks or AngloGold Ashanti figures. The gold price is an input: use today’s price. All-in sustaining cost (AISC) is the mine’s cost per ounce including sustaining capital; for reference the company reported US$1,998 per ounce for the group in the first half of 2026. Growth capital and interest are not included, and the tax rate is a simple percentage you set.

▶ Follows one gold nugget from rock to refined bar: drilling, crushing, dissolving, carbon capture, melting and refining. · 5:27
Projects: Nevada, the Geita expansion and brownfield growth
AGA’s biggest new project is in southern Nevada near Beatty. The Nevada projects together hold 6.4 Moz of reserve. North Bullfrog is expected to be the first to produce, at an average 105,000 ounces a year for the first five years and 76,000 ounces a year over an 11-year life at an AISC of US$934 per ounce. Capital cost is estimated at US$480 million. The annual report says a final investment decision is expected in the second half of 2026, and construction is scheduled to start in 2027, subject to permits.
The Arthur Gold Project (formerly Expanded Silicon) is larger. A first reserve of 4.9 Moz (88 million tonnes at 1.75 g/t) was declared at Merlin, supporting a nine-year pre-feasibility case at about 500,000 ounces a year, with capital of US$3.6 billion and AISC of US$954 per ounce. Reuters called it the second-largest reserve in the company’s portfolio. These are pre-feasibility figures that can change.
The USGS notes that Nevada accounts for about 64% of US gold mine production. In its 31 July 2026 results AGA said it was working on brownfield options at Obuasi, Geita, Sukari, Siguiri and Cuiabá with the potential to raise output from 2029. Brownfield means expanding an existing mine rather than building a new one.
Mines bought, sold and paused
The portfolio changed a lot between 2024 and 2026, which is why older lists of AGA mines are out of date.
Chart
Gold produced by region, 2024 and 2025
Thousand ounces; Africa managed includes Sukari (40,000 oz in 2024 after the 22 November takeover)
- Sukari (Egypt) joined with the takeover of Centamin plc on 22 November 2024.
- Augusta Gold (Nevada) was acquired by AGA and completed in October 2025. The announced price was C$1.70 per share, and it added the Reward and Bullfrog assets.
- Serra Grande (Brazil) was sold, with the sale completed in December 2025.
- The Doropo and ABC projects were sold in 2025 (the annual report describes two projects in Côte d’Ivoire sold from April 2025).
- Iduapriem and Tarkwa joint-venture talks with Gold Fields were paused in May 2025.
The result shows up in the output numbers. Group production was 3.091 Moz in 2025 against 2.661 Moz in 2024, up 16%. Excluding Sukari, output was 2.59 Moz, slightly below 2.62 Moz the year before. So the 2025 jump came mainly from the takeover, with Obuasi, Siguiri and Geita adding smaller gains.
Latest quarterly output and guidance
Group production was 744,000 ounces in the second quarter of 2026 against 804,000 a year earlier, and 1.468 Moz in the first half against 1.524 Moz. AGA attributed the dip to the Serra Grande sale, lower Obuasi output after the April fatality, and planned sequencing and maintenance. Full-year guidance of 2.80 to 3.17 Moz, issued in February 2026, was left unchanged and the company expects the second half to be higher. Guidance for the group’s AISC is US$1,780 to US$1,990 per ounce. Guidance can change, and the company’s quarterly releases are the place to check.
Chart
Cost and price per ounce, group
US$ per ounce; 2024, 2025 and first half of 2026
Water, power and communities at the mines
The points below come from the 2025 annual report and the 2026 results release.
- Power: Geita moved to Tanzania’s national grid, which is about 45% supplied from renewable sources, and grid availability reached 90% by the end of 2025. Tropicana added 62 MW of renewable capacity in February 2025.
- Tailings: Both Iduapriem and Siguiri paused plants in 2025 to repair or buttress tailings storage facilities, and a feasibility study for a new tailings dam is planned at Siguiri. Tailings are the fine waste left after ore is processed.
- Communities: at Geita the company reports literacy training, a ring road, a malaria programme, mobile healthcare and scholarships. Group-wide, AGA reports it invested US$21.9 million in communities across Africa in 2025.
- Safety: the group’s recordable injury frequency was 0.79 per million hours worked at managed operations in Q2 2026, and the Obuasi fatality that quarter is under corrective action.
Open-pit mines such as Geita’s Nyamulilima change land use and need rehabilitation plans. For how this works, read our overview of surface mining and its ecological impact, and the video below explains the seven main environmental impacts in plain words.

▶ Explains the seven environmental impacts of mining in plain words. · 2:31
How satellites help check a mine area from space
If you hold a licence near one of these mines, or advise someone who does, public Sentinel-2 imagery can show clay and iron-oxide alteration, vegetation change and disturbed ground. This is how explorers screen large areas before sending crews. It does not replace drilling and does not show gold itself. Farmonaut turns a boundary file into a satellite screening report for exploration targets; see our page on satellite-based mineral detection, or send your boundary through the mining quote form. Results are exploration targets and are not a resource estimate. For project finance questions, our guide to how mining projects are funded explains what lenders ask for.
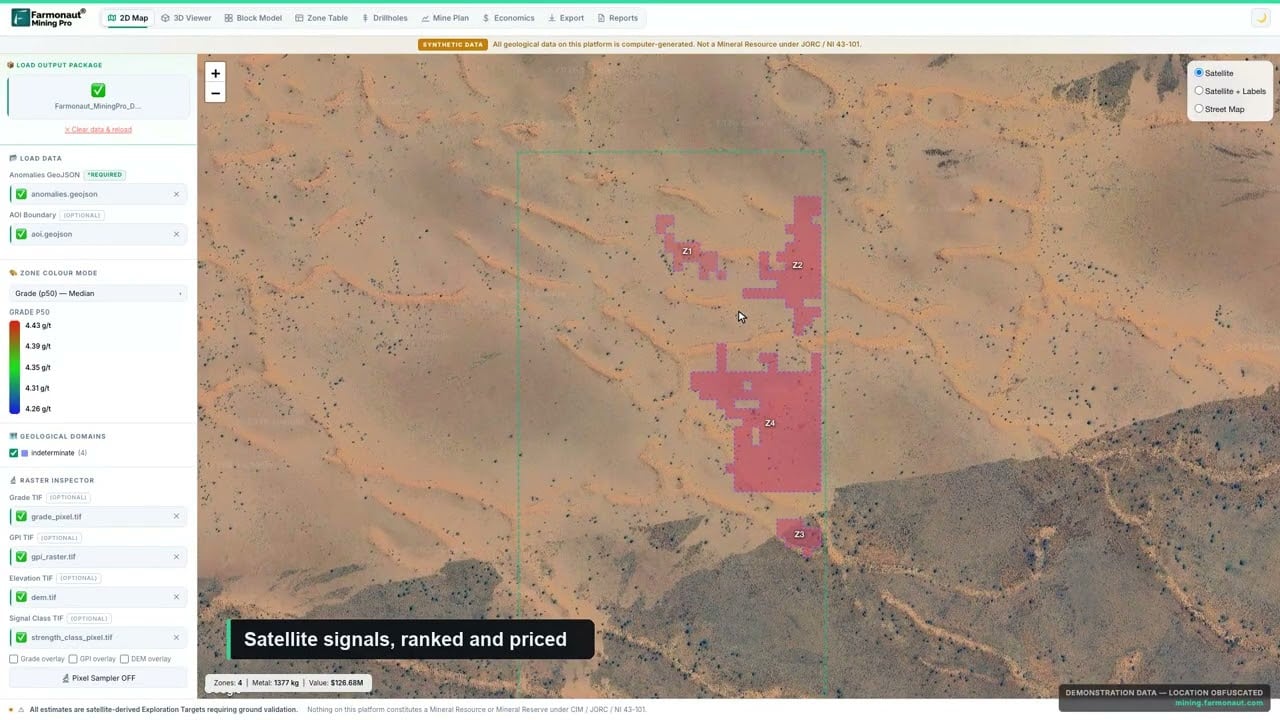
▶ A short look at Farmonaut Mining Pro, which turns a licence boundary into a geological and economic picture. · 4:56
We cover a connected topic in Best Gold Mines: Top 10 Ranked by Ounces Produced.
For a closer look at a related question, see our guide: US Gold Miners Ranked: 10 Largest Mines by Output.
Frequently asked questions
How many mines does AngloGold Ashanti operate?
The 2025 annual report lists 10 operations in Argentina, Australia, Brazil, the DR Congo, Egypt, Ghana, Guinea and Tanzania. It also has greenfield projects in Colombia and the United States.
Where is the Ashanti gold mine?
It is the Obuasi mine in the Ashanti Region of Ghana, an underground operation that opened in 1897 and is now owned by AngloGold Ashanti.
Which is AngloGold Ashanti’s biggest mine?
By 2025 output, Sukari in Egypt, at 500,000 ounces, narrowly ahead of Geita in Tanzania at 492,000 ounces.
Which AngloGold Ashanti mine has the lowest cost?
Sukari had the lowest total cash cost in 2025 at US$783 per ounce. AGA Mineração in Brazil followed at US$976. Siguiri was highest at US$1,783.
How much gold does AngloGold Ashanti produce?
The company produced 3.091 million ounces in 2025, up 16%. Its 2026 guidance is 2.80 to 3.17 million ounces.
Does AngloGold Ashanti still own mines in South Africa?
The 2025 annual report lists no South African operation among its 10 operations. The company is still listed on the Johannesburg exchange under the code ANG.
Is AngloGold Ashanti a South African or British company?
The parent company, AngloGold Ashanti plc, is incorporated in England and Wales. Its primary listing is on the NYSE, with secondary listings in Johannesburg and Accra.
What is the Arthur Gold Project?
It is a planned open-pit mine in southern Nevada with a first reserve of 4.9 million ounces and a pre-feasibility estimate of about 500,000 ounces a year over nine years.
Does AngloGold Ashanti own Kibali?
It owns 45% through a joint venture with Barrick, which operates the mine. The company reports its share of output.
What does all-in sustaining cost mean?
It is the cost of producing an ounce including the capital needed to sustain the mine. For the group it was US$1,998 per ounce in the first half of 2026, per the company.
Where can I find the latest AngloGold Ashanti production figures?
The company publishes quarterly earnings releases and operating statistics on its investor site and through the SEC and Johannesburg Stock Exchange. Always use the latest release.
This page is for information only. It is not investment advice. Production, cost and guidance figures are company-reported and dated; check the latest release before relying on them. Royalty and licence terms are set by governments and can change.
Farmonaut mining
Map your mining site from space
Send a KML, KMZ or polygon and Farmonaut screens the area from satellite images before ground crews go in.

Mining Pro sample view, synthetic data
Keep reading
Sources
- AngloGold Ashanti plc, 2025 Annual Report (PDF copy): minedocs.com
- AngloGold Ashanti, 2025 Mineral Resource and Mineral Reserve Report: reports.anglogoldashanti.com
- AngloGold Ashanti, Q2 2026 Earnings Release and Dividend Declaration (31 July 2026): cityam.com
- AngloGold Ashanti, Q4 and year ended 31 December 2025 earnings release (February 2026): finance.yahoo.com
- AngloGold Ashanti, Q3 and nine months 2025 earnings release: gse.com.gh
- Wikipedia, AngloGold Ashanti: en.wikipedia.org
- Wikipedia, Obuasi Gold Mine: en.wikipedia.org
- World Gold Council, Gold Demand Trends full year 2025, Supply: gold.org
- USGS, Mineral Commodity Summaries 2026: Gold (February 2026): pubs.usgs.gov
- Reuters via Kitco, Ghana’s gold output hits record 6 million oz in 2025 (12 February 2026): kitco.com
- EITI, Ghana country page: eiti.org
- Ecofin Agency, Guinea’s largest gold mine records 6% output rise in 2025 (22 February 2026): ecofinagency.com
- The Citizen, AngloGold Ashanti vows to stay in Tanzania: thecitizen.co.tz
- Miningmx, Cash flush AngloGold plans $100m Geita expansion (11 November 2025): miningmx.com
- Reuters via The Citizen, AngloGold earnings surge on record prices, reports 5 million ounce US gold reserves: thecitizen.co.tz
- Augusta Gold, announcement of acquisition by AngloGold Ashanti: newswire.ca
- TaxLawGH (MSL Business School), Ghana Minerals and Mining (Royalties) Regulations, L.I. 2517: taxlawgh.com
Discussion
Questions, corrections or field experience? Share them below. First-time comments are reviewed before they appear, and your email is never published.
No comments yet. Be the first to add a question or your experience.

 Double A Trading
 GemSprout Metals Limited
 Qader Group
 Ileys General Trading
 SG Gold Mining LLC
 VRV Global Pte Ltd
 Omsri International FZE
 G.I.T.T.
 Jaunita Erss Ltd
 Almosi SARL
 SRK Consulting
 Berks Gold Limited
 Mwerezi Minerals Company Limited
 Mining SARL
 SenGold Invest SAS
 Sean Mining Limited
 NTS Group (Pty) Ltd
 Mine4Africa











