

Gold producers · Company profile
Newmont Mining Corporation: Mines, Output and Costs
Newmont made 5.889 million ounces of gold in 2025 and held 118.2 million ounces of reserves at year end. This page shows output by mine, cost per ounce, how it compares with Agnico Eagle and Barrick, and what it reports on water and emissions.
Key takeaways
- Newmont’s attributable gold output was 5.889 million oz in 2025, about 5.6% of the 3,300 t mined worldwide (Newmont, February 2026; USGS, 2026; share calculated).
- Nevada Gold Mines was its largest source at 999 koz (Newmont’s 38.5% share); Barrick holds 61.5% and operates it (Newmont and Barrick filings, 2026).
- Gold all-in sustaining cost was US$1,609/oz in 2025 on a co-product basis, up from US$1,444 in 2023 (Newmont Form 10-K, 2025).
- Reserves were 118.2 million oz at 31 December 2025; the main climate target is a 32% cut in Scope 1 and 2 emissions by 2030 (Newmont, 2026).
- Q2 2026: realized price US$4,414/oz, 1.29 million oz produced, AISC US$1,621/oz on a by-product basis (Newmont Form 8-K, 23 July 2026).
In this article
- Newmont at a glance
- Where Newmont mines gold: output by operation
- How output changed after the mine sales
- How Newmont compares with the other big gold miners
- What it costs Newmont to mine an ounce
- Reserves and the land position
- Canadian assets and the NI 43-101 question
- Growth projects and risks Newmont names
- From ore to doré: how a gold mine makes an ounce
- Water, emissions and tailings: what Newmont reports
- Safety, workforce and communities
- How satellite data fits into gold mining
- How to read a gold miner's report: a short checklist
- Frequently asked questions
Newmont Corporation, headquartered in Denver, Colorado, is the world’s largest gold producer. It made 5.889 million ounces of gold attributable to the company in 2025 and ended the year with 118.2 million ounces of proven and probable gold reserves (Newmont operating statistics, February 2026; Newmont annual report on Form 10-K for 2025). That is roughly 5.6 percent of the 3,300 tonnes of gold the world mined in 2025 (USGS Mineral Commodity Summaries 2026; share calculated here). This page shows where those ounces come from, what they cost to mine, how Newmont compares with Agnico Eagle and Barrick, and what the company reports on water, emissions and safety.
Newmont at a glance
Newmont says it was incorporated in 1921. It is primarily a gold producer, with copper, silver, lead and zinc as other products. Its filings list operations or assets in the United States, Papua New Guinea, Australia, Ghana, Suriname, Argentina, the Dominican Republic, Chile, Peru, Ecuador, Mexico and Canada, on a land position of about 49,800 square kilometres (19,200 square miles) (Newmont Form 10-K, 2025).
- Listing: common stock trades on the New York Stock Exchange under NEM; the company also has an ASX listing (Mining.com, February 2026).
- Leadership: Natascha Viljoen became President and Chief Executive Officer after Tom Palmer retired from the role at the end of 2025 (Newmont Form 10-K, 2025).
- People: about 17,500 employees and about 26,600 contractors at 31 December 2025 (Newmont Form 10-K, 2025).
- Segments: 12 mines Newmont operates plus its 38.5 percent share of Nevada Gold Mines, which it does not operate (Newmont Form 10-K, 2025).
- Takeover history: the purchase of Newcrest Mining, completed on 6 November 2023, added Lihir, Cadia and other assets (Newmont Form 10-K, 2025).
Where Newmont mines gold: output by operation
Newmont reports gold made at each operation. “Produced” means ounces recovered at the mine; “sold” means ounces delivered to buyers in the period. The two differ because of timing. For its consolidated core portfolio Newmont made 5.321 million ounces in 2025; counting only its ownership share and adding its equity-method stakes in Pueblo Viejo (40 percent) and Lundin Gold’s Fruta del Norte mine (Newmont owns 32 percent of Lundin Gold) brings the attributable total to 5.889 million ounces (Newmont operating statistics, February 2026).
Chart
Gold produced by operation, 2025
Thousand ounces; the eight largest operations, as reported (NGM at Newmont’s 38.5% share)
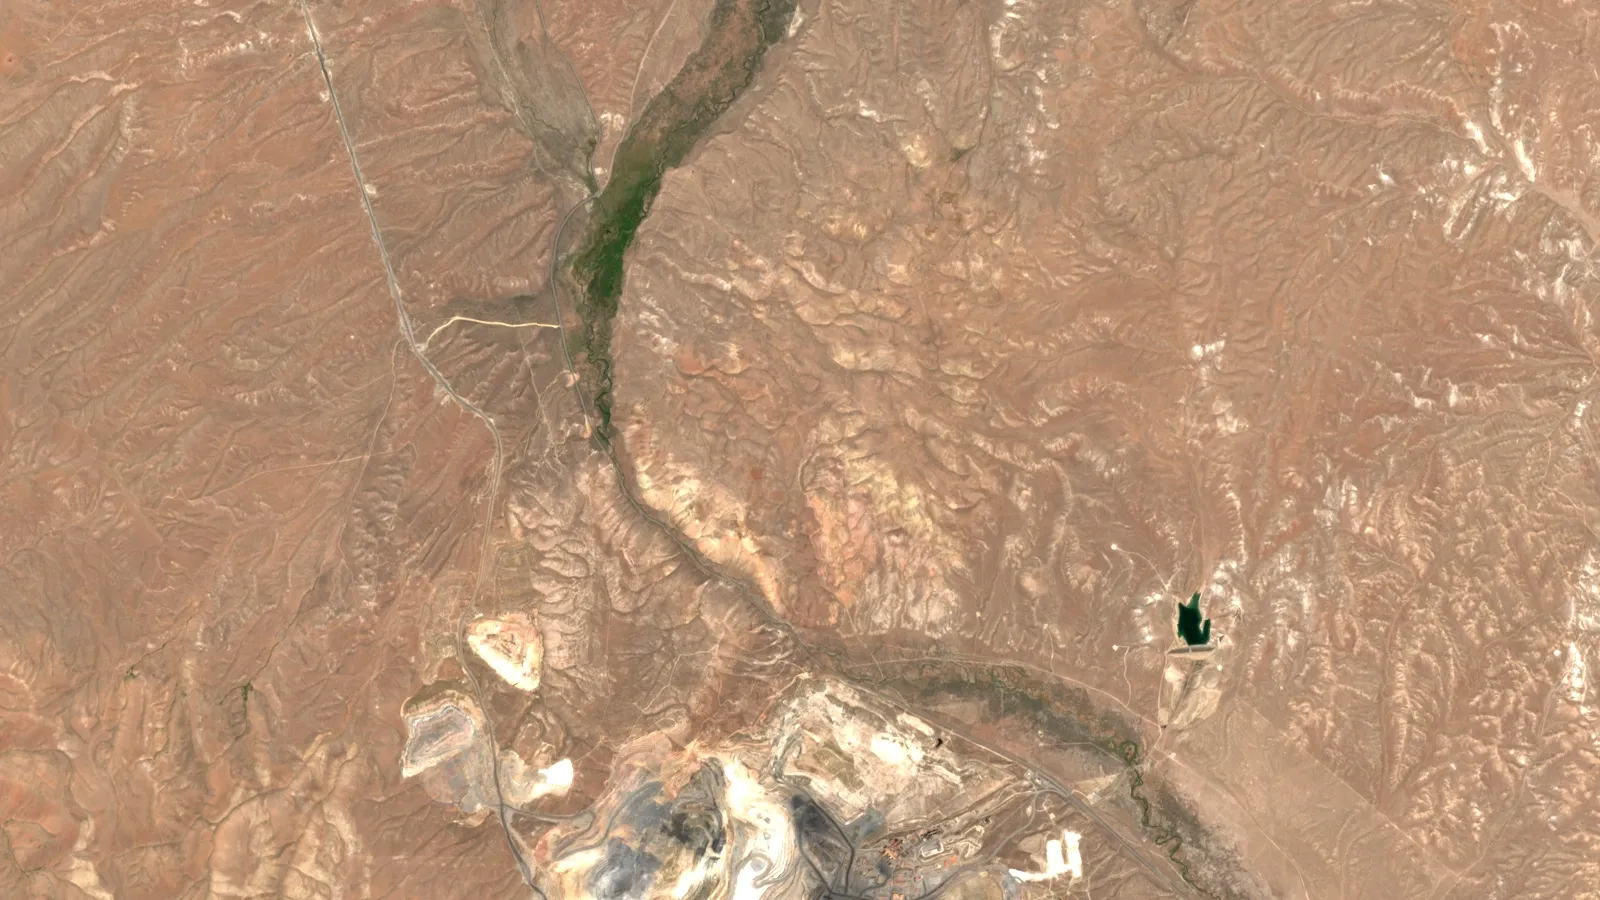
Nevada Gold Mines (NGM) is the largest single contributor, with 999,000 ounces counted at Newmont’s 38.5 percent share. Barrick holds the other 61.5 percent and operates the joint venture, which includes Carlin, Cortez and Turquoise Ridge (Barrick annual report, 2025). So the Carlin Trend is a joint-venture asset, not a Newmont-operated mine. For more on the district, see the guide to gold deposits in Nevada.
Outside Nevada the biggest producers in 2025 were Ahafo South in Ghana (664,000 ounces), Lihir in Papua New Guinea (585,000), Boddington in Western Australia (565,000) and Yanacocha in Peru (515,000). Suriname’s Merian mine, which Newmont owns 75 percent and the state company Staatsolie owns 25 percent, made 237,000 ounces; Newmont consolidates it at 100 percent (Newmont Form 10-K, 2025).
Newmont also sells by-product metals. In 2025 it produced 135,000 tonnes of copper (mostly from Cadia and Boddington), 28 million ounces of silver, and lead and zinc at Peñasquito in Mexico (Newmont operating statistics, February 2026). That is why Newmont quotes costs per gold-equivalent ounce as well as per ounce of gold.
How output changed after the mine sales
Total consolidated gold fell from 6.545 million ounces in 2024 to 5.530 million in 2025. Most of the drop was not a mining problem. Newmont sold seven assets it called non-core: Telfer, CC&V, Musselwhite, Éléonore, Porcupine, Akyem and the Coffee project. Those sales closed between the fourth quarter of 2024 and the fourth quarter of 2025 (Newmont annual report). Mining.com puts the company’s 2025 output decline at 14 percent and notes that Newmont forecasts a further decline for 2026 (Mining.com, February 2026).
Chart
Gold produced by retained mine, 2024 and 2025
Thousand ounces; selected operations still owned at year end 2025
Among the mines Newmont kept, the picture is mixed. Yanacocha rose from 354,000 to 515,000 ounces and Peñasquito from 299,000 to 415,000, while Ahafo South fell from 798,000 to 664,000 and Cadia from 464,000 to 385,000. Ahafo North, a new open pit in Ghana, declared commercial production in October 2025 (same filing).
How Newmont compares with the other big gold miners
Mining.com ranked the top gold producers of 2025 with Newmont first, Agnico Eagle second and Barrick third; Zijin Mining of China, Navoi Mining of Uzbekistan, AngloGold Ashanti, Polyus, Gold Fields, Kinross and Northern Star completed its top ten (Mining.com, February 2026). The figures below come from each company’s own report, so the bases differ and the chart should be read as a size guide, not a league table.
Chart
2025 gold output of the three largest producers
Million ounces; each company’s own reporting basis (see table)
| Company | 2025 gold output | Basis | Main listings |
|---|---|---|---|
| Newmont | 5.889 million oz | Attributable, including equity-method stakes | NYSE, ASX |
| Agnico Eagle | 3.447 million oz | Payable gold production | NYSE, TSX |
| Barrick | 3.26 million oz | Reported 2025 gold production | NYSE, TSX |
Sources: Newmont operating statistics (February 2026); Agnico Eagle fourth-quarter 2025 results; Barrick annual report (2025). Barrick lost output in 2025 after its Loulo-Gounkoto complex in Mali was suspended in January and resumed in December (Mining.com, February 2026).
How to read these figures: Newmont publishes mine-by-mine production and cost tables each quarter. Its headline attributable figure mixes consolidated mines with equity-method stakes, and the divestments make year-on-year comparisons hard. For dividends, see our guide to gold mining stocks with dividends.
What it costs Newmont to mine an ounce
Gold miners report all-in sustaining cost (AISC): the cost of producing an ounce including by-product credits, sustaining capital, royalties and mine-site overhead, but not growth projects. Newmont’s 2025 gold AISC was US$1,609 per ounce on a co-product basis, up from US$1,516 in 2024 and US$1,444 in 2023. Its cost applicable to sales (CAS, the direct cost of the metal sold) for gold was US$1,199 per ounce in 2025 (Newmont annual report). “Co-product” means costs are shared between gold and the other metals by sales value.
Chart
Newmont gold cost per ounce, 2023 to 2025
US$ per ounce sold; AISC on a co-product basis
The spread between mines is wide. In 2025 gold co-product CAS ran from US$532 per ounce at the new Ahafo North pit and US$795 at Yanacocha to US$1,594 at Cerro Negro in Argentina and US$1,562 at Merian (Newmont operating statistics, February 2026). Costs have moved up across the industry: the World Gold Council puts the global average AISC at US$1,785 per ounce in the first quarter of 2026, up 16 percent on a year earlier, and the average margin over AISC at a record US$3,076 per ounce (World Gold Council, August 2026).
For 2026 Newmont guided to about 5.26 million attributable ounces at a gold AISC of about US$1,680 per ounce, and reaffirmed that in July. In the second quarter it realized US$4,414 per ounce, produced 1.29 million attributable ounces and booked a gold AISC of US$1,621 per ounce, with and seismic events at Cadia (Newmont Form 8-K, 23 July 2026; Kitco). The second-quarter AISC is on a by-product basis, so do not set it directly beside the co-product 2025 figures above.
The calculator below turns ounces, a price and an AISC into an operating margin, using the same logic. Enter your own numbers; the defaults are examples.
Calculator
What margin does a gold mine leave per year (US$)?
Enter ounces sold, a price and the AISC from a company report.
- Revenue (US$ m): 4,000
- All-in sustaining cost (US$ m): 1,600
- Margin per ounce (US$): $2,400
- Margin after growth capital (US$ m): 2,100
All inputs are examples in US dollars, not Newmont’s figures or a forecast. Enter today’s gold price and the AISC from a company report; the margin excludes tax, interest and hedging.
Reserves and the land position
At 31 December 2025 Newmont reported attributable proven and probable gold reserves of 118.2 million ounces, measured and indicated resources of 88.1 million ounces and inferred resources of 60.6 million ounces (same filing). Reserves are the part of a deposit that is economic to mine under stated assumptions; resources are a larger, less certain pool. Inferred resources have the lowest confidence of all and are not counted in reserves. Newmont, as a US filer, reports under the US Securities and Exchange Commission rule known as Regulation S-K 1300. Canadian-listed companies use National Instrument 43-101, which requires a “qualified person” (an engineer or geoscientist) to sign technical reports (Ontario Securities Commission, NI 43-101 text).
A reserve figure is a planning number, not a promise. It moves with the gold price assumed, with costs and with drilling results. A satellite image cannot replace that work, but it can help choose where to drill first; see the section on satellite data below.
Canadian assets and the NI 43-101 question
Readers who arrive looking for Newmont and NI 43-101 often want to know what Newmont still owns in Canada. The 10-K lists Red Chris (British Columbia, gold and copper, in which Newmont holds 70 percent) and Brucejack (British Columbia, gold) among its operations; Red Chris made 62,000 ounces and Brucejack 231,000 ounces of gold in 2025 (Newmont annual report; Newmont operating statistics, February 2026). The Musselwhite, Éléonore and Porcupine mines and the Coffee project have been sold. Newmont itself reports reserves under S-K 1300, not NI 43-101.
Growth projects and risks Newmont names
The largest project in the filing is Tanami Expansion 2 in the Northern Territory of Australia. It adds a 1,460 metre hoisting shaft to extend mine life beyond 2040, with commercial production expected in the second half of 2027 and a total capital cost of US$1.7 to US$1.8 billion (Newmont annual report). Other projects named in the filing include Cadia panel caves in New South Wales, the Red Chris block cave in British Columbia and Wafi-Golpu in Papua New Guinea.
The filing also lists risks. Operations in Ghana, Papua New Guinea and Peru face political and regulatory uncertainty; block-cave mining can produce seismic events, which happened at Cadia in the second quarter of 2026 (Kitco, July 2026); and the Nevada joint venture is run by Barrick, and Mining.com wrote in February 2026 that a conflict over it may be brewing (Newmont annual report; Mining.com, February 2026).
From ore to doré: how a gold mine makes an ounce
Newmont’s mines use several routes. Some ship doré, an impure gold-silver bar poured at the mine; others ship concentrate to smelters. The sequence is similar across them, and the infographic shows a typical open-pit gold circuit. Grade (grams of gold per tonne of rock, g/t) and recovery (the share of that gold actually captured) decide how many ounces a tonne of ore yields.
Infographic
A gold circuit in 5 steps
- 1Drill and modelCore samples give grade; a block model estimates tonnes and ounces.
- 2Blast and haulOpen pits or block caves deliver ore and waste.
- 3Crush and grindRock is milled fine enough to free the gold.
- 4Leach or floatCyanide leaching or flotation captures gold into solution or concentrate.
- 5Pour and refineDoré bars or concentrate go to a refinery.

▶ Follows a gold nugget from rock to ring through drilling, crushing, leaching and refining. · 5:27
Water, emissions and tailings: what Newmont reports
Newmont’s climate targets are for 2030, not 2026: cut absolute Scope 1 and 2 emissions (those from its own fuel and purchased power) by 32 percent against 2018, and cut Scope 3 emissions (from suppliers and joint ventures) by 30 percent against 2019. It rebased the baseline in 2025 after the divestments and Ahafo North, and calls the goals aspirational (Newmont 2025 Sustainability Report).
- Emissions: Scope 1 and 2 emissions fell 4.7 percent against 2024, and renewable energy supplied 22 percent of purchased grid electricity, up from 21 percent. Emissions per gold-equivalent ounce rose because output fell (Newmont 2025 Sustainability Report).
- Water: the recycled-water rate reached 71 percent, up from 62 percent at the 2018 baseline (Newmont 2025 Sustainability Report).
- Cyanide and land: cyanide-related spills fell 25 percent from 2024, and reclamation was completed on 131 hectares (Newmont 2025 Sustainability Report).
- Tailings: at December 2025 the inventory held 22 active, 15 inactive and 39 reclaimed and closed tailings facilities, with disclosures against the Global Industry Standard on Tailings Management published in August 2025 (Newmont 2025 Sustainability Report).
Gold mining is energy- and water-intensive, and cyanide leaching needs careful control; the US Environmental Protection Agency’s technical document on gold describes the cyanide and heap-leach risks that regulators watch (US EPA, gold mining technical document).

▶ Explains the seven main environmental impacts of mining in plain words with satellite maps. · 2:31
Safety, workforce and communities
Newmont reported no work-related fatalities at any site in 2025, but a worker died at Tanami in Australia on 4 February 2026. In 2024 two workers died at Cerro Negro in Argentina (Newmont 2025 Sustainability Report; Newmont Form 10-K, 2025). The company reports that in 2025 it paid US$3.2 billion in taxes, royalties and other payments to governments, spent US$2.3 billion with local suppliers in host countries and put US$97 million into community projects (Newmont 2025 Sustainability Report).
Agreements with Indigenous groups shape two Australian sites. At Boddington, an Indigenous Land Use Agreement with the GKB Aboriginal Corporation includes cultural heritage work around a proposed second tailings facility. At Tanami, a mining agreement is regulated by the Central Land Council on behalf of the Warlpiri (Yapa) Traditional Owners (Newmont 2025 Sustainability Report).
How satellite data fits into gold mining
Majors like Newmont use drilling, geophysics and models to decide where to spend. Satellite imagery is a cheaper first screen. It cannot see gold itself. It maps the iron-oxide, clay and silica alteration that hot fluids leave around some gold systems, along with faults and land cover, so a licence owner can rank areas before drilling. Farmonaut turns a licence boundary into a satellite mineral-detection report with exploration targets, not a resource estimate and not an environmental clearance.

▶ Explains how satellites map the rock around gold rather than the gold itself. · 4:25
How to read a gold miner’s report: a short checklist
- Attributable or consolidated? Attributable counts only the company’s ownership share; consolidated counts 100 percent of mines it controls, such as Merian.
- Produced or sold? Produced is recovered metal; sold is what reached buyers in the period.
- Which cost basis? By-product credits copper or silver against gold cost; co-product shares cost by sales value. Check which one a figure uses before comparing.
- Reserves or resources? Only reserves have passed economic tests; check the price assumed.
- What changed in the portfolio? Acquisitions and sales distort year-on-year changes.
- Which reporting standard? S-K 1300 in the US, NI 43-101 in Canada, JORC in Australia.
For a closer look at a related question, see our guide: Antofagasta plc Mines: Output, Costs and Growth.
If this topic matters to you, read Malartic Gold Mine: Output, Costs and Reserves in Quebec next.
Frequently asked questions
Is Newmont the largest gold mining company in the world?
By attributable gold production in 2025, yes: 5.889 million ounces, against 3.447 million for Agnico Eagle and 3.26 million for Barrick, on each company’s own reporting basis (company reports; Mining.com ranking, February 2026).
Where is Newmont headquartered?
In Denver, Colorado, in the United States (same filing).
What is Newmont’s stock ticker?
NEM on the New York Stock Exchange, with a secondary listing on the Australian Securities Exchange. This page is not investment advice.
Who is Newmont’s chief executive?
Natascha Viljoen, who succeeded Tom Palmer on 1 January 2026 (Newmont annual report).
Which are Newmont’s biggest gold mines?
By 2025 output: Nevada Gold Mines (999,000 ounces at Newmont’s share), Ahafo South in Ghana (664,000), Lihir in Papua New Guinea (585,000), Boddington (565,000) and Yanacocha (515,000) (Newmont operating statistics, February 2026).
Does Newmont own the Carlin Trend?
Not on its own. Carlin sits inside Nevada Gold Mines, where Newmont holds 38.5 percent and Barrick 61.5 percent and operates the venture.
How much does it cost Newmont to mine an ounce of gold?
Its 2025 gold all-in sustaining cost was US$1,609 per ounce on a co-product basis, and direct cost applicable to sales was US$1,199 per ounce (same filing).
How much gold does Newmont have in reserve?
118.2 million ounces of attributable proven and probable reserves at 31 December 2025, plus 88.1 million ounces of measured and indicated resources (Newmont annual report).
Did Newmont sell mines?
Yes. Telfer, CC&V, Musselwhite, Éléonore, Porcupine, Akyem and the Coffee project were sold between late 2024 and late 2025 (same filing).
What are Newmont’s climate targets?
A 32 percent cut in Scope 1 and 2 emissions and a 30 percent cut in Scope 3 emissions by 2030, against baselines in 2018 and 2019, described by the company as aspirational (Newmont 2025 Sustainability Report).
Does Newmont operate under NI 43-101?
No. As a US filer it reports reserves under SEC Regulation S-K 1300. NI 43-101 applies to Canadian-listed issuers.
What happened to Newmont’s output?
It guided to about 5.26 million attributable ounces for the year and reported 1.29 million in the second quarter, with seismic events at Cadia reducing output (Newmont Form 8-K, 23 July 2026).
This page is for information only. It is not investment advice. It gives no share prices or targets. Check each company’s own reports before you invest.
Farmonaut mining
Get a quote to map your licence from space
Mining business owners can request a quote for a satellite mineral-detection report on their own licence area, an exploration target ahead of any resource estimate.

Mining Pro sample view, synthetic data
Keep reading

Sources
- Newmont, Annual Report on Form 10-K for 2025: s24.q4cdn.com
- Newmont, Fourth Quarter 2025 Operating Statistics: s24.q4cdn.com
- Newmont, 2025 Sustainability Report: s24.q4cdn.com
- USGS, Mineral Commodity Summaries 2026: Gold: pubs.usgs.gov
- Barrick, Annual Report 2025: s25.q4cdn.com
- Agnico Eagle, Fourth Quarter 2025 results: s205.q4cdn.com
- Mining.com, Top 10 gold mining companies of 2025 (26 February 2026): mining.com
- Newmont, Form 8-K second-quarter 2026 earnings release (23 July 2026): sec.gov
- Kitco, Newmont second-quarter 2026 results (23 July 2026): kitco.com
- World Gold Council, Record gold prices outpace rising mining costs in Q1 2026: gold.org
- Ontario Securities Commission, National Instrument 43-101: osc.ca
- US EPA, Technical document on gold mining: archive.epa.gov
Discussion
Questions, corrections or field experience? Share them below. First-time comments are reviewed before they appear, and your email is never published.
No comments yet. Be the first to add a question or your experience.

 Sahel Shipping SA
 Sania Corporation
 Sean Mining Limited
 NTS Group (Pty) Ltd
 Mine4Africa
 Lithspo Minerals Limited
 Tintina Mining Group
 Dalgety Minerals Pty Ltd
 Vortex Minerals Pty Ltd
 Faith At Work (Pty) Ltd
 Geotech Mining Solutions plc
 Vulcan International Limited
 Kidepo Associates
 GKY Mining
 Alkimy SARL
 Double A Trading
 GemSprout Metals Limited
 Qader Group
 Ileys General Trading
 SG Gold Mining LLC
 VRV Global Pte Ltd
 Omsri International FZE
 G.I.T.T.
 Jaunita Erss Ltd











