

Silver supply · Data guide
Silver as Byproduct of Copper, Lead & Zinc: The Real %
Yes. Lead-zinc mines supply 29.4% of the world’s mine silver and copper mines 28.0%, so those two metals alone give 57.4%. Add gold mines (15.9%) and byproduct silver reaches about 73%. Only 26.1% comes from primary silver mines.
Key takeaways
- Lead-zinc mines gave 29.4% of world mine silver in 2025 and copper mines 28.0%. Together that is 57.4% (Silver Institute, World Silver Survey 2026).
- Gold mines add 15.9%, so byproduct silver from copper, lead-zinc and gold is about 73%. Primary silver mines supply 26.1%.
- World mine output was 846.6 million ounces in 2025, up 3%. The USGS estimates about 26,000 tonnes. Mexico is the top producer.
- In the US, the USGS counts 4 silver mines and 31 byproduct or coproduct operations. Silver is on the US critical minerals list since November 2025.
- Supply follows copper, zinc and gold mining, not the silver price. The average price rose 34% in 2025 while US mine output rose about 4% (USGS).
In this article
- Is Most Silver Produced as a Byproduct of Copper, Lead and Zinc Mining?
- Percentage of Silver Supply by Source Metal
- Where Silver Is Mined: Top Producing Countries
- How Byproduct Silver Is Recovered
- What Happens to Silver Supply When Base-Metal Mining Slows
- Why Silver Matters Beyond Mining: Uses and the Critical Minerals List
- Calculator: Estimate Your Byproduct Silver Exposure
- Calculator: How Much Silver Is in Your Concentrate?
- How to Check the Current Percentage Yourself
- How We Checked the Numbers on This Page
- Farmonaut: Satellite Mapping for Byproduct Silver Zones
- FAQ: Silver Byproduct Percentages
- Summary and Bottom Line
Is Most Silver Produced as a Byproduct of Copper, Lead and Zinc Mining?
Yes, but “most” needs numbers. In the Silver Institute’s World Silver Survey 2026, lead-zinc mines supplied 29.4% of the silver mined in 2025 and copper mines supplied 28.0%. Together that is 57.4%, so copper plus lead-zinc is a clear majority on its own. Gold mines added 15.9%, which takes byproduct silver from all three metals to about 73%. Primary silver mines, where silver is the main product, supplied 26.1%. The last 0.6% sits in an “other” group. The Silver Institute’s April 2026 press release confirms that lead and zinc mines remained the largest source of silver, and that world mine output rose 3% to 846.6 million ounces in 2025.
The US Geological Survey says the same thing in words. Its Mineral Commodity Summaries for silver states that silver is mainly a byproduct of lead-zinc, copper and gold mines, listed in that order of silver output. So the textbook line is right. The only thing most pages get wrong is the size of each slice.
This page gives the current numbers, shows where they come from, and explains why they matter if you buy, trade, mine or explore for silver. It also has two calculators you can use with your own figures, and a short note on what we changed from the last version of this page.
Bottom line: about 57% of mine silver comes from lead-zinc and copper mines, about 73% comes from those two plus gold mines, and about 26% comes from mines that exist mainly for silver.
Percentage of Silver Supply by Source Metal
The table below splits 2025 world silver mine output by the metal that pays for the mine. The percentages are the Silver Institute’s, as shown in its World Silver Survey 2026 chart. The million-ounce column is our own arithmetic: each share multiplied by 846.6 million ounces. One million troy ounces is about 31 tonnes of silver.
Chart
Where world mine silver comes from
Share of 2025 world silver mine output, by the metal that pays for the mine
| Source of the silver | Share of world mine silver (2025) | About how much (million troy ounces) | How the silver is recovered |
|---|---|---|---|
| Lead-zinc mines | 29.4% | 249 | Silver sits in galena and zinc ore. It travels in the lead and zinc concentrates to a smelter. |
| Copper mines | 28.0% | 237 | Silver sits in copper sulfide ore. It is recovered when the copper concentrate is smelted and refined. |
| Primary silver mines | 26.1% | 221 | Silver is the main product. These mines usually sell silver concentrate or doré (a rough silver-gold alloy). |
| Gold mines | 15.9% | 135 | Silver comes out with the gold, mostly in doré or in the refinery. |
| Other | 0.6% | 5 | Not broken out by the Silver Institute. |
The shares come from the Silver Institute’s World Silver Survey 2026 (released April 2026), as shown in Statista’s chart of the Silver Institute data. We did not have the full survey, so treat the table as a faithful copy of a published chart, and use the Silver Institute press release for the headline facts.
Lead-Zinc Mines: The Largest Source of Byproduct Silver
Lead-zinc ore is the biggest single source of mine silver in the world, at 29.4% of output. The silver is found inside galena (lead sulfide) and, to a smaller degree, inside zinc ore. The mine does not separate it. Silver rides in the lead and zinc concentrates to a smelter and is taken out there.
The Silver Institute notes that lead and zinc mines remained the largest source in 2025, but that their share slipped slightly compared with 2024 while gold and copper output grew. That is the usual way the mix moves: it changes when base-metal mines open, close or hit different ore, not when the silver price moves. For more on how these mines are changing, see our guide to lead-zinc ore and the innovations shaping mining.
Copper Mines: Silver in Porphyry Copper Ore
Copper mines supplied 28.0% of world silver in 2025. The Silver Institute says copper-mine silver rose 6% in 2025, helped by higher byproduct output from copper operations in Peru.
Silver in copper ore is usually a trace mineral in sulfide ore. Large porphyry copper systems often carry it. To see how those systems form and where they are found, read our guide to porphyry copper deposits and our overview of copper deposits, top countries and where to explore.
Gold Mines and Primary Silver Mines
Gold mines gave 15.9% of world silver, about 135 million ounces. The Silver Institute reports that gold-mine silver grew 5% in 2025. The USGS adds that most recent silver discoveries have been tied to gold occurrences. Epithermal gold-silver veins are a classic example. If you work on this type of target, our page on epithermal gold deposits explains the styles and clues.
Primary silver mines supply 26.1%. They are fewer, and they are the mines that respond most directly to the silver price. Byproduct mines mostly cannot, because their output is set by copper, lead, zinc or gold.
Common mistake: quoting “silver is 70% byproduct” without a source. The Silver Institute numbers support a range, and the right answer depends on whether you count gold: 57.4% with copper plus lead-zinc only, and about 73.3% with gold included.
Where Silver Is Mined: Top Producing Countries
The USGS estimates world silver mine output at 26,000 tonnes in 2025, up from 25,300 tonnes in 2024. That is a different method from the Silver Institute’s 846.6 million ounces (about 26,300 tonnes by our conversion), but the two agree closely. Mexico is the largest producer by a wide margin, with an estimated 6,300 tonnes in 2025. Peru, China, Bolivia, Chile, Poland, Russia and the United States follow.
Chart
Top silver-producing countries, 2024 and 2025
Silver content of mine output, tonnes
Peru’s rise in 2025 came from copper byproduct output, according to the Silver Institute, which fits the byproduct picture. Chile also rose, from an estimated 1,200 tonnes in 2024 to 1,400 tonnes in 2025. Kazakhstan fell the most in the USGS table, from an estimated 850 tonnes in 2024 to 630 tonnes in 2025.
Silver Production in the United States and Canada
US mines produced an estimated 1,100 tonnes of silver in 2025, worth about $1.4 billion, according to the USGS Mineral Commodity Summaries 2026. Silver was mined at 4 silver mines and recovered as a byproduct or coproduct at 31 other base- and precious-metal operations, across 12 states. Alaska leads, followed by Nevada. The USGS says domestic output rose about 4% in 2025 because one Idaho company mined higher-grade ore and made operating improvements.
The 4-versus-31 count is a useful shortcut. Even in the United States, almost 9 out of 10 operations that recover silver do so as a byproduct or coproduct. This count is by mines, not by ounces, so it does not equal the output shares above.
Canada is a smaller producer. The USGS table lists an estimated 400 tonnes for 2025, up from 366 tonnes in 2024. For current Canadian numbers, check Natural Resources Canada’s mineral production statistics, which are updated on their own schedule.
How Byproduct Silver Is Recovered
Byproduct silver is not mined on its own. It travels inside the ore of the main metal to the smelter or refinery, where it is separated out. This is why byproduct silver follows a different logic from primary silver: the mine plan is set by the copper, lead, zinc or gold in the ground.
Infographic
From copper, lead-zinc or gold ore to refined silver
- 1Mine the oreCopper, lead-zinc or gold ore comes out of the ground.
- 2Make a concentrateThe mill separates the valuable minerals. The silver stays with them.
- 3Smelt and refineThe smelter and refinery recover each metal, including silver.
- 4Sell the silverSilver leaves as refined metal for industry, investors and recyclers.
Copper Ore: Silver in Sulfide Minerals
- Silver occurs with copper sulfide minerals and is carried into the copper concentrate.
- The concentrate goes to a smelter, and silver is taken out during refining. It is not separated at the mine.
- Because copper pays for the mine, the cost of recovering silver is carried by the copper business. That is why byproduct silver can be produced even when the silver price alone would not justify a mine.
Lead-Zinc Ore: Galena and Sphalerite
- Silver is carried mainly in galena (lead sulfide), with some in the zinc mineral sphalerite.
- Lead and zinc concentrates go to smelters, and silver is recovered from the lead stream.
- Lead-zinc is the largest of the byproduct sources, at 29.4% of world silver.
Gold and Polymetallic Ore
- Gold ores often carry silver. It is poured out with the gold in doré bars and separated at a refinery.
- Complex gold-copper and polymetallic deposits give silver as a secondary stream.
- Gold mines supply 15.9% of world silver, a much larger share than many people expect.
Secondary Supply: Recycled Silver
Mine output is not the whole supply. The Silver Institute reports that recycling rose 2% in 2025 to 197.6 million ounces, a 12-year high. In the United States, the USGS estimates that about 1,000 tonnes of silver was recovered from new and old scrap in 2025, about 11% of apparent consumption. US refineries made about 1,100 tonnes of silver from ores and concentrates and 1,000 tonnes from scrap in the same year. The US is also a big importer: the USGS puts net import reliance at 77% of apparent consumption for 2025, with Mexico (47%) and Canada (18%) the main sources over 2021 to 2024.
What Happens to Silver Supply When Base-Metal Mining Slows
If most silver is a byproduct, supply follows the copper, lead, zinc and gold industries more than it follows the silver price. A few practical effects follow from that.
Chart
Average silver price, 2021 to 2025
US dollars per troy ounce, annual average
- Price transmission is weak. The USGS reports that the average silver price in 2025 was $38 per troy ounce, 34% higher than in 2024. US mine output rose only about 4% in the same period, and world output rose about 3%. A big price jump did not bring much new silver, because most of it cannot be switched on and off.
- Closures matter. A strike, closure or permit delay at a copper or lead-zinc mine takes its silver off the market, whatever silver itself is doing.
- The market is short of metal. The Silver Institute says demand exceeded supply for the fifth year in a row in 2025, and it expects the deficit to widen to 46.3 million ounces in 2026 with mine output flat.
- Recycling helps, but it is capped. Recycling at 197.6 million ounces is a real buffer, yet refinery bottlenecks limited volumes in 2025.
Common mistake: treating silver supply as separate from copper and zinc cycles. A buyer who plans only around the silver price misses the real driver: base-metal mine output and grades.
Why Silver Matters Beyond Mining: Uses and the Critical Minerals List
The USGS lists the estimated US uses of silver in 2025 as electrical and electronics (25%), other industrial uses and photography (19%), net physical investment in bars (18%), solar photovoltaics (15%), coins and medals (14%), jewelry and silverware (6%) and brazing and solder (3%). Solar cells use silver paste, which is why solar demand matters to silver buyers. If you also follow farm inputs, Farmonaut’s guide to chemicals used for high yields covers a different set of industrial inputs.
Chart
What silver is used for in the United States
Estimated share of US silver use, 2025. Electronics = electrical and electronics; other industry includes photography; bars = net physical investment.
Silver also became a “critical mineral” in the United States. The USGS says the final 2025 list of critical minerals, published in the Federal Register on 7 November 2025, added copper, lead, potash, rhenium, silicon and silver, among other changes. The three most relevant to this page are copper, lead and silver. A byproduct metal on a critical list shows why base-metal mine supply and silver supply are now discussed together.
Calculator: Estimate Your Byproduct Silver Exposure
This tool applies the Silver Institute’s 2025 world shares to a volume of silver you buy or hold. It shows how much of that volume statistically traces back to each type of mine. Enter your own numbers.
Calculator
How much of your silver comes from byproduct mines?
Enter the silver you buy or hold in a year and your price. The split uses the world shares for mine silver.
- From lead-zinc mines: 29,400 oz
- From copper mines: 28,000 oz
- From gold mines: 15,900 oz
- From primary silver mines: 26,100 oz
- Value of the byproduct part at your price: $2,785,400
Example values only, not a benchmark. The split applies the Silver Institute’s 2025 world shares (lead-zinc 29.4%, copper 28.0%, gold 15.9%, primary silver 26.1%, other 0.6%) to your volume. It cannot know your suppliers’ real mix, it ignores recycled silver, and the price is whatever you enter. The default price is the 2025 average from the USGS. Use today’s price.
Calculator: How Much Silver Is in Your Concentrate?
If you work on a copper, lead-zinc or gold project, the question is often how much silver sits in a tonne of concentrate and what it is worth after the smelter’s deductions. This calculator gives a first estimate from your own grade, tonnage and payable percentage. It uses the standard conversion of 31.1035 grams per troy ounce, which follows from the USGS note that one metric tonne equals 32,150.7 troy ounces. It is a screening tool, not a contract price.
Calculator
How much silver is in your concentrate?
Enter your own tonnage, silver grade and payable percentage.
- Contained silver: 4,823 oz
- Contained silver in kilograms: 150.0 kg
- Payable value at your price: $164,933
Example values only, not a benchmark. Grade, payable percentage and price are your inputs. Your smelter contract sets the real payable percentage and any deductions. 31.1035 grams per troy ounce follows from the USGS conversion of 32,150.7 troy ounces per metric tonne.
How to Check the Current Percentage Yourself
These percentages are republished every year and they will move. Here is a short method for getting the current figures instead of trusting any one page, including this one.
- Open the USGS National Minerals Information Center and download the latest Mineral Commodity Summaries chapter for silver. The file names follow the pattern pubs.usgs.gov/periodicals/mcsYYYY/mcsYYYY-silver.pdf, where YYYY is the edition year.
- Read the production table, the mine count (silver mines versus byproduct or coproduct operations) and the World Resources paragraph on which metals supply silver.
- Cross-check the world total and the split by source metal in the latest World Silver Survey from the Silver Institute’s supply and demand page.
- For Canada, use the Natural Resources Canada statistics page linked above.
- Compare year on year. A single year’s percentage is a snapshot, not a constant.
How We Checked the Numbers on This Page
We reviewed this page in October 2026 against three kinds of source: the USGS Mineral Commodity Summaries for silver (2026 and 2025 editions), the Silver Institute’s World Silver Survey 2026 press release and supply page, and the Federal Register entry for the 2025 critical minerals list. Where a figure is our own arithmetic, the page says so.
What changed from the last version of this page. An earlier version showed a US split of silver output by source metal (31%, 28%, 25% and 16%) and credited it to the USGS. We could not find those figures in the USGS silver chapter for 2024, 2025 or 2026, so we removed them. We also corrected the gold-mine share of world silver. The earlier version gave about 1.7%, which came from misreading a 13.9 million ounce year-on-year increase as the full amount. The Silver Institute’s 2025 share for gold mines is 15.9%. Finally, we removed a claim that Canada produces about 1,200 tonnes of silver per year. The USGS lists about 400 tonnes for 2025. The world shares for lead-zinc (29.4%) and copper (28.0%) were right, and they are now credited to the Silver Institute, which is the right source.
Farmonaut: Satellite Mapping for Byproduct Silver Zones
Because most silver is a byproduct, finding silver usually means finding copper, lead-zinc or gold systems first. Farmonaut’s satellite-based mineral detection uses multispectral and hyperspectral satellite data to flag alteration zones, faults and deposit-linked patterns. Satellite results are targets for field checking, sampling and drilling, not proof of grade. They help you decide where to send a field team first.
- Faster screening. Farmonaut reports that early exploration timelines can drop from months to days, with early-stage cost lower by up to 80 to 85 percent compared with traditional ground work.
- Minerals covered. The platform covers precious metals including gold and silver, and base metals including copper and zinc, among more than 20 mineral types.
- Simple workflow. Send your area of interest as coordinates, a KML or KMZ file or a polygon, plus the target mineral. Delivery is typically 5 to 20 business days, depending on size and complexity.
For a worked example of how a mineral zone is modelled in 3D, see this satellite-driven 3D mineral prospectivity mapping example. You can also read our guides to silver mining and silver ore trends and lead in silver ore. To map your own site, use mining.farmonaut.com. To discuss a specific project, get a quote or contact us.
We cover a connected topic in Silver as a Byproduct of Copper Mining: Top Producers.
FAQ: Silver Byproduct Percentages
What percentage of silver production is a byproduct of copper, lead and zinc mining?
About 57.4% of world mine silver in 2025: 29.4% from lead-zinc mines and 28.0% from copper mines, per the Silver Institute’s World Silver Survey 2026 shares. If you add gold mines (15.9%), byproduct silver is about 73.3%.
Is most silver production really a byproduct of lead, zinc and copper mining?
Yes. Copper plus lead-zinc alone is a majority (57.4%). The USGS also says silver is mainly a byproduct of lead-zinc, copper and gold mines.
How much silver comes from primary silver mines?
About 26.1% of world mine silver in 2025, or roughly 221 million ounces by our arithmetic. In the United States, the USGS counts 4 silver mines against 31 byproduct or coproduct operations.
What is the percentage of silver as a byproduct of gold mining?
15.9% of world mine silver in 2025, about 135 million ounces. Gold-mine silver grew 5% in 2025.
How much silver does the world mine in a year?
The Silver Institute reports 846.6 million troy ounces for 2025, up 3%. The USGS estimates 26,000 tonnes. The two figures use different methods and agree closely (about 26,300 tonnes against 26,000).
Which country mines the most silver?
Mexico, with an estimated 6,300 tonnes in 2025 (USGS), followed by Peru and China.
Why do byproduct percentages matter for buyers and investors?
Because supply follows base-metal and gold mining, not the silver price. A closure at a large copper or lead-zinc mine can tighten silver supply regardless of silver demand. This page is for information only and is not investment advice.
Is silver on the US critical minerals list?
Yes. Silver was added in the final 2025 list published in the Federal Register on 7 November 2025.
Where can I check these percentages myself?
Use the USGS Mineral Commodity Summaries for silver and the Silver Institute’s World Silver Survey. The section “How to Check the Current Percentage Yourself” gives the steps.
Can satellites find silver?
Satellites do not measure silver grade directly. They help you find the host systems, such as alteration zones in copper, lead-zinc and gold terrain. Those targets then need field sampling and drilling.
Summary and Bottom Line
Most mined silver is a byproduct. In the Silver Institute’s 2025 data, lead-zinc mines gave 29.4% of world silver, copper mines 28.0%, primary silver mines 26.1% and gold mines 15.9%. In the United States, the USGS counts 4 silver mines against 31 byproduct or coproduct operations. Supply therefore follows base-metal and gold mining, which explains why a 34% rise in the average silver price in 2025 did not bring a matching rise in output. If you source, trade or explore for silver, track copper, zinc and gold mine output as closely as you track the silver price. For project-specific mapping of copper, lead-zinc or gold systems that may carry byproduct silver, get a quote or contact us.
This page is for information only. It is not investment advice, and the figures can change when the sources are updated.
Farmonaut mining
Map your own project area from space
Send a polygon or KML file. Farmonaut screens your area with satellite data and reports back in 5 to 20 business days, depending on size and mineral.
Keep reading
Sources
- USGS, Mineral Commodity Summaries 2026: Silver: pubs.usgs.gov
- USGS, Mineral Commodity Summaries 2025: Silver: pubs.usgs.gov
- USGS, Mineral Commodity Summaries 2024: Silver: pubs.usgs.gov
- Silver Institute, World Silver Survey 2026 press release (15 April 2026): silverinstitute.org
- Silver Institute, Silver supply and demand: silverinstitute.org
- Statista, silver production by primary source metal, 2025 (Silver Institute data): statista.com
- Federal Register, Final 2025 List of Critical Minerals (7 November 2025): federalregister.gov
- Natural Resources Canada, mineral production statistics: mmsd.nrcan-rncan.gc.ca
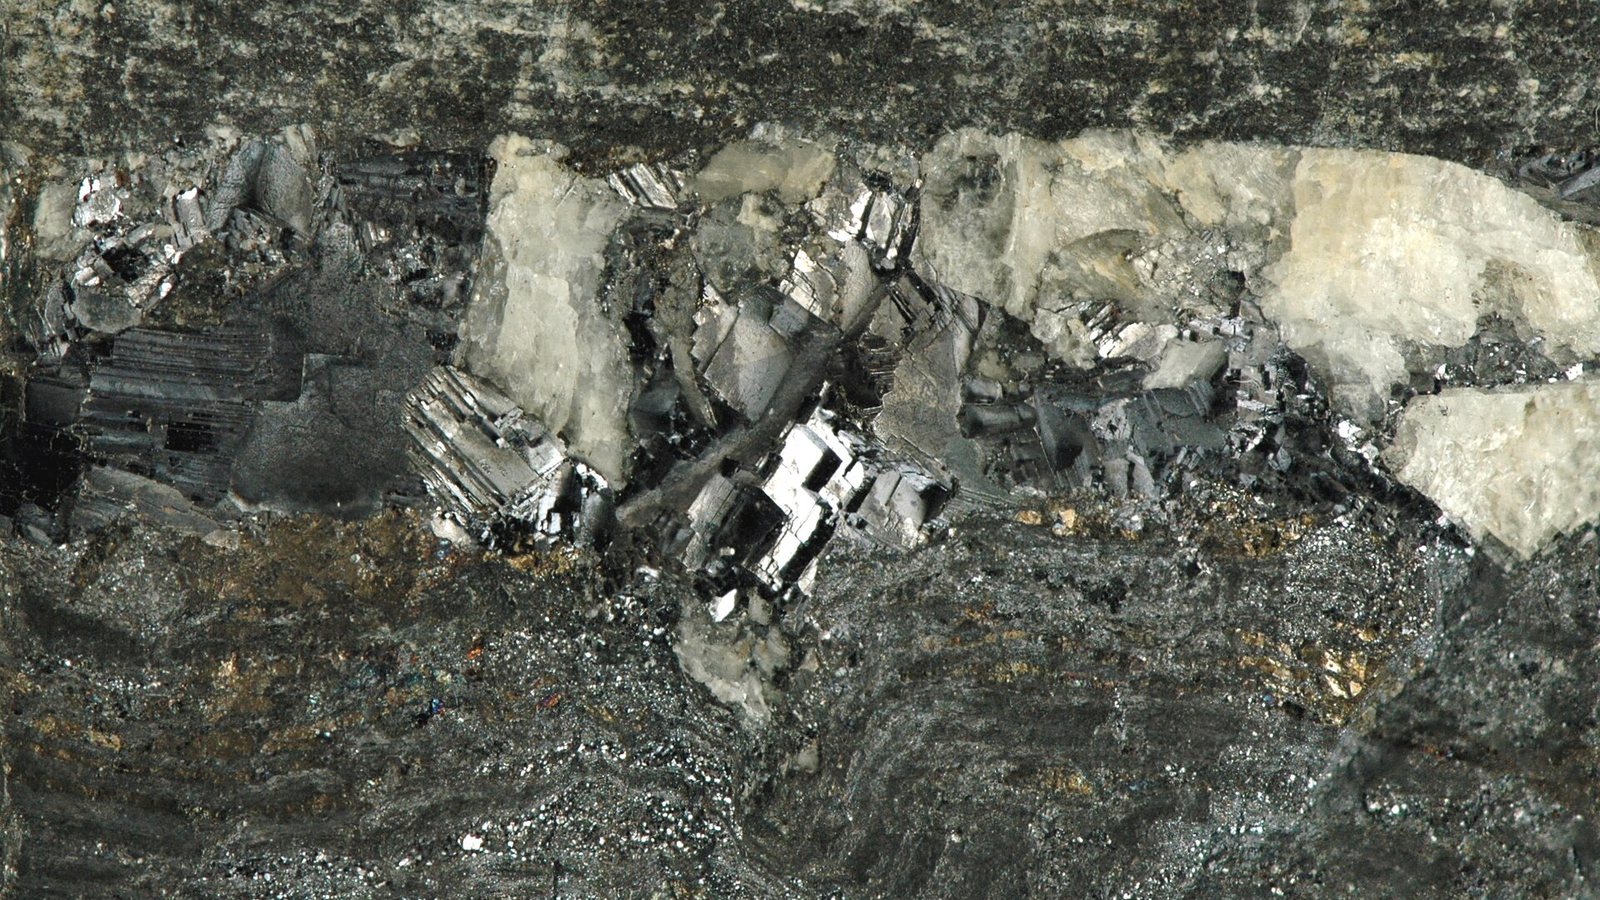
- Wikimedia Commons, hero photo by James St. John (CC BY 2.0): commons.wikimedia.org
Discussion
Questions, corrections or field experience? Share them below. First-time comments are reviewed before they appear, and your email is never published.
No comments yet. Be the first to add a question or your experience.

 WSP Investment Company
 Dalgety Minerals Pty Ltd
 Vortex Minerals Pty Ltd
 Faith At Work (Pty) Ltd
 Geotech Mining Solutions plc
 Vulcan International Limited
 Kidepo Associates
 GKY Mining
 Alkimy SARL
 Double A Trading
 GemSprout Metals Limited
 Qader Group
 Ileys General Trading
 SG Gold Mining LLC
 VRV Global Pte Ltd
 Omsri International FZE
 G.I.T.T.
 Jaunita Erss Ltd
 Almosi SARL
 SRK Consulting
 Berks Gold Limited
 Mwerezi Minerals Company Limited
 Mining SARL

 Exploration consultancy · South Africa · Gold










