

US gold production · Ranked list
US Gold Miners Ranked: 10 Largest Mines by Output
Nevada Gold Mines, a Barrick and Newmont joint venture, is the largest US gold producer at about 2.59 million ounces in 2025. This guide ranks the ten US mines above 100,000 ounces, names their owners and shows what an ounce cost.
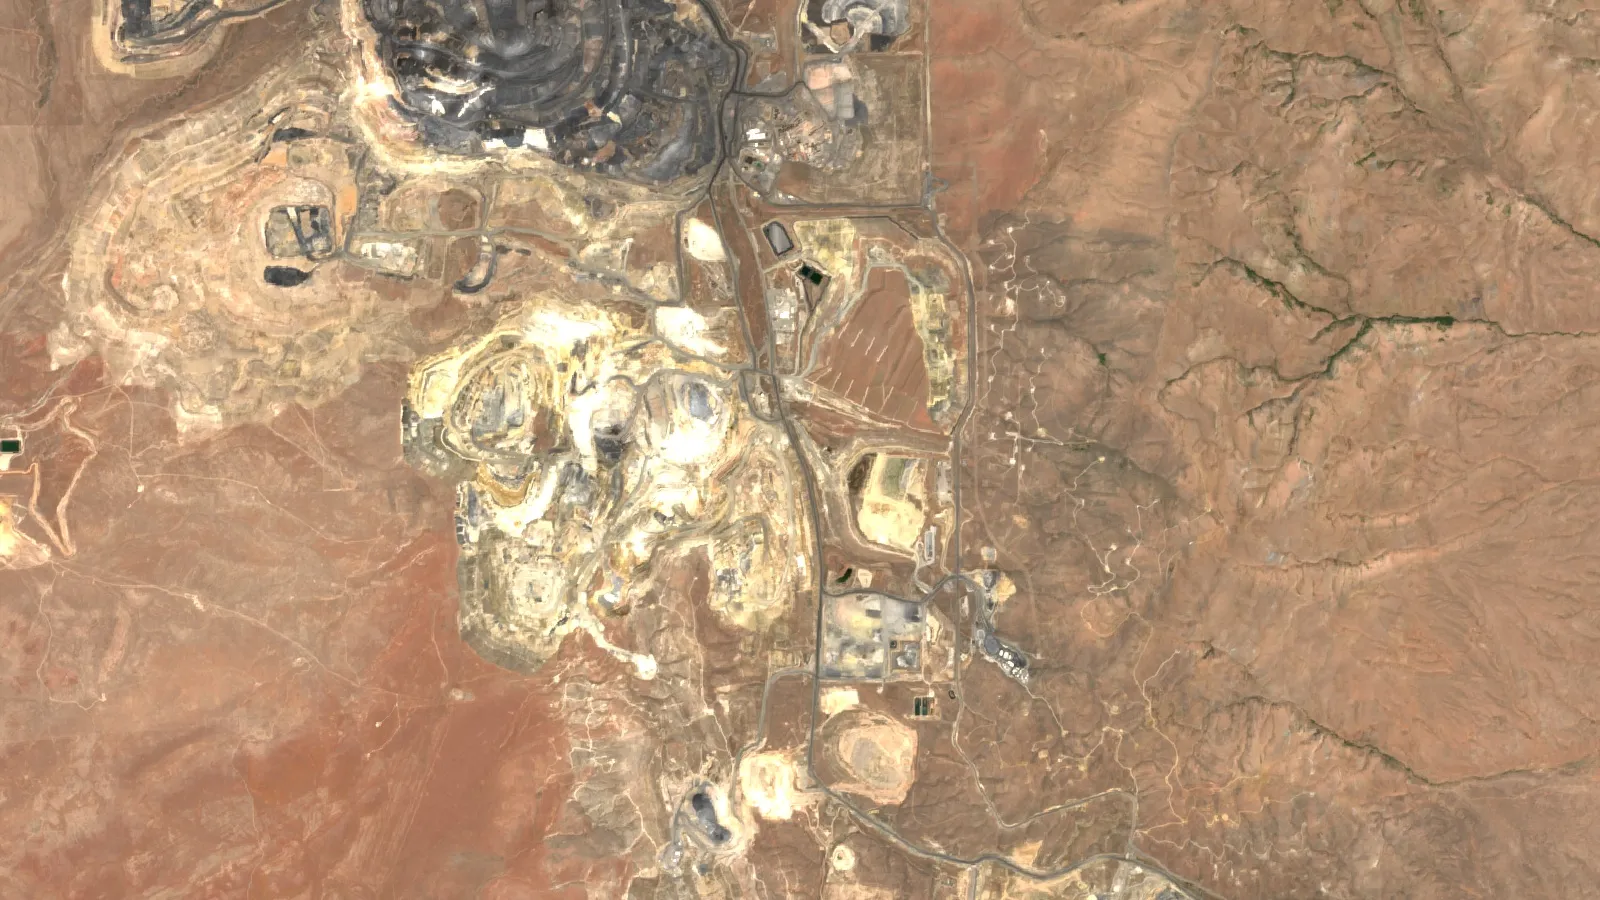
Key takeaways
- Nevada Gold Mines produced about 2.59 million oz in 2025 on a 100% basis; Barrick owns 61.5% and Newmont 38.5% (Barrick mine statistics, Q4 2025).
- USGS estimates US mine output at 160 t in 2025, 64% from Nevada and 22% from Alaska; the top 25 operations made about 94% (USGS, 2026).
- Carlin led the ten largest US gold mines at about 1.12 million oz in 2025; Kinross, Northern Star, SSR and Coeur run others on the list.
- At the Barrick and Kinross mines, cost of sales per oz in 2025 ran from about US$1,198 (Bald Mountain) to US$1,921 (Phoenix).
- Nevada mining directly employed an average of 14,491 people in 2025 at US$125,218 average pay (Nevada Division of Minerals).
In this article
- The 10 largest US gold mines by ounces produced
- How we chose and what the ranking leaves out
- Who owns the mines: the main US gold miners
- Where US gold comes from: Nevada, Alaska and the rest
- How a gold mine turns rock into bullion
- What it costs to produce an ounce of gold
- How a US gold mine is permitted and reclaimed
- What gold mining means for rural counties
- What to watch at the biggest US gold mines
- How new gold mines are found
- Frequently asked questions
The largest gold producer in the United States is Nevada Gold Mines, a joint venture owned 61.5% by Barrick and 38.5% by Newmont. It produced about 2.59 million ounces in 2025 on a 100% basis, roughly half of all US mine output, which the US Geological Survey estimates at 160 metric tons (about 5.1 million troy ounces). Kinross is the next largest operator, with Nevada mines at Bald Mountain and Round Mountain plus Fort Knox in Alaska. This guide ranks the ten largest US gold mines by ounces produced, names who owns them, shows what an ounce cost to produce, and then covers what these mines mean for the rural counties around them.
The 10 largest US gold mines by ounces produced
The table ranks mines by gold produced, taken from each owner’s own year-end report; all rows are calendar 2025 except Pogo, which is Northern Star’s financial year to June 2026. Read the last column before comparing rows, because the owners do not all report on the same basis. A troy ounce is 31.1035 grams, and “Au eq.” means gold equivalent, which converts small amounts of silver into gold at set prices.
Chart
Gold produced by the largest US mines
Thousand ounces; 2025 (Pogo: year to June 2026); Nevada Gold Mines on a 100% basis
| Rank | Mine | State | Operator | Gold produced (oz) | Basis |
|---|---|---|---|---|---|
| 1 | Carlin complex | Nevada | Nevada Gold Mines | 1,116,000 | 100% of the mine |
| 2 | Cortez complex | Nevada | Nevada Gold Mines | 739,000 | 100% of the mine |
| 3 | Turquoise Ridge | Nevada | Nevada Gold Mines | 555,000 | 100% of the mine |
| 4 | Fort Knox | Alaska | Kinross | 410,822 | Au eq.; includes 100% of Manh Choh ore, of which Kinross owns 70% |
| 5 | Pogo | Alaska | Northern Star | 265,304 | Gold sold in the year to June 2026, not calendar 2025 |
| 6 | Bald Mountain | Nevada | Kinross | 179,169 | Au eq. |
| 7 | Phoenix | Nevada | Nevada Gold Mines | 177,000 | 100% of the mine (gold and copper) |
| 8 | Marigold | Nevada | SSR Mining | 153,535 | Gold ounces |
| 9 | Cripple Creek & Victor (CC&V) | Colorado | SSR Mining | 152,557 | Full year, including about 28,000 oz made before SSR took over on 28 February 2025 |
| 10 | Round Mountain | Nevada | Kinross | 143,402 | Au eq. |
Sources for the table: Barrick’s Q4 2025 mine statistics for the four Nevada Gold Mines operations (Barrick prints these on a 100% basis and also shows its 61.5% share), Kinross’s 2025 results, SSR Mining’s 2025 results, Northern Star’s June 2026 quarterly report for Pogo and Coeur Mining’s fourth-quarter 2025 release. Barrick prints its mine figures in thousands of ounces, so the three Nevada Gold Mines rows are rounded.
How we chose and what the ranking leaves out
We ranked the US mines that reported more than 100,000 ounces of gold (or gold equivalent) in their owner’s latest full-year public results. Ranking by ounces mined says nothing about profit, mine life or the size of the company that owns the mine. Several points matter when you read the list.
- Just outside the ten: Coeur’s Kensington mine in Alaska produced 106,068 ounces in 2025, and its Wharf mine in South Dakota produced 97,327 ounces (Coeur Q4 2025 release). Pogo’s figure covers a different twelve months from the rest, so compare it with care.
- Mid-size Nevada mines: Nevada’s Major Mines report lists Integra’s Florida Canyon at 70,927 oz, i-80 Gold’s Granite Creek-based output at 62,074 oz, Coeur’s Rochester at 60,178 oz and KGHM’s Robinson at 43,323 oz for 2025, as reported by the Elko Daily.
- Silver and base-metal mines: Mines that sell mostly silver, zinc or copper can still make gold. They sit outside this list unless they passed 100,000 ounces of gold.
- Joint ventures: Barrick and Newmont split Nevada Gold Mines, so neither company alone produced the 100% figures above. Barrick’s own share was 1.59 million ounces from the joint venture in 2025.
The USGS says the top 25 operations produced about 94% of US mined gold, so a short list covers most of the metal. Smaller placer miners, mostly in Alaska and the western states, make up the rest. For Nevada, the Nevada Division of Minerals keeps a record of all mining operations and their annual production.
Who owns the mines: the main US gold miners
Barrick and Newmont: Nevada Gold Mines
Nevada Gold Mines runs the Carlin complex, the Cortez complex, Turquoise Ridge (including Twin Creeks) and the Phoenix gold-copper mine, according to Nevada’s Division of Minerals. The Division also reports that the joint venture produced nearly 2.6 million ounces of gold in 2025, out of about 3.38 million ounces for the whole state (Elko Daily). Newmont reports its 38.5% interest in the joint venture in its operating statistics. In its August 2026 results, Barrick said it plans an initial public offering of a minority stake in a new company that will hold its North American gold assets, including Nevada Gold Mines. Newmont has consented, and the two partners agreed to expand the joint venture with Barrick’s excluded properties. Barrick expects completion by the end of 2026, subject to market conditions and approvals (Barrick Q2 2026 results).
Chart
Kinross US mines, year on year
Thousand gold-equivalent ounces produced
Kinross: Alaska and Nevada
Kinross is a Canadian company that lists on the Toronto and New York exchanges and runs three US gold mines. In January 2026 it approved construction of the Round Mountain Phase X underground, the Curlew project and Bald Mountain’s Redbird 2. It says the three projects will add about 3 million ounces and extend Nevada mine lives into the 2030s. Round Mountain’s gold output fell in 2025 as the mine moved to a new phase, while Fort Knox rose with high-grade ore from Manh Choh (Kinross 2025 results).
SSR Mining and Coeur Mining
SSR Mining runs Marigold in Nevada and, since 28 February 2025, Cripple Creek & Victor in Colorado. It reported Marigold at 153,535 ounces for 2025, below its full-year guidance range of 160,000 to 190,000 ounces. Coeur, a US-based company, runs Kensington in Alaska, Wharf in South Dakota and Rochester in Nevada. Rochester is mainly a silver mine. Pogo is owned by Northern Star Resources, an Australian-listed company.
Where US gold comes from: Nevada, Alaska and the rest
The USGS puts 2025 US mine output at an estimated 160 metric tons, worth about US$17 billion, from more than 40 lode mines in 12 states plus placer operations. Nevada made about 64% and Alaska about 22%, and roughly 7% came as a by-product of copper ore (USGS Mineral Commodity Summaries 2026). The same report puts US reserves at 3,000 metric tons and assessed resources at 33,000 tons, of which 15,000 tons are identified and 18,000 tons undiscovered. On the USGS table, the US ranks fifth for 2025 mine output at 160 tons, behind China (380), Russia (310), Australia (280) and Canada (200), and accounts for about 5% of the world total of 3,300 tons.
Chart
US gold mine production
Metric tons per year
Output has slipped for years even as the value of the gold rose, because grades fall as the best ore is mined. The chart shows the USGS series for 2021 to 2025.
How a gold mine turns rock into bullion
Most US gold comes from two kinds of ore. Oxide ore near the surface is crushed, stacked on a lined pad and leached with a weak cyanide solution, a method called heap leaching. Harder sulfide ore is ground in a mill, then oxidized and leached. Gold is recovered on carbon, melted into doré bars, and sent to a refinery. The video below follows one nugget through the steps.
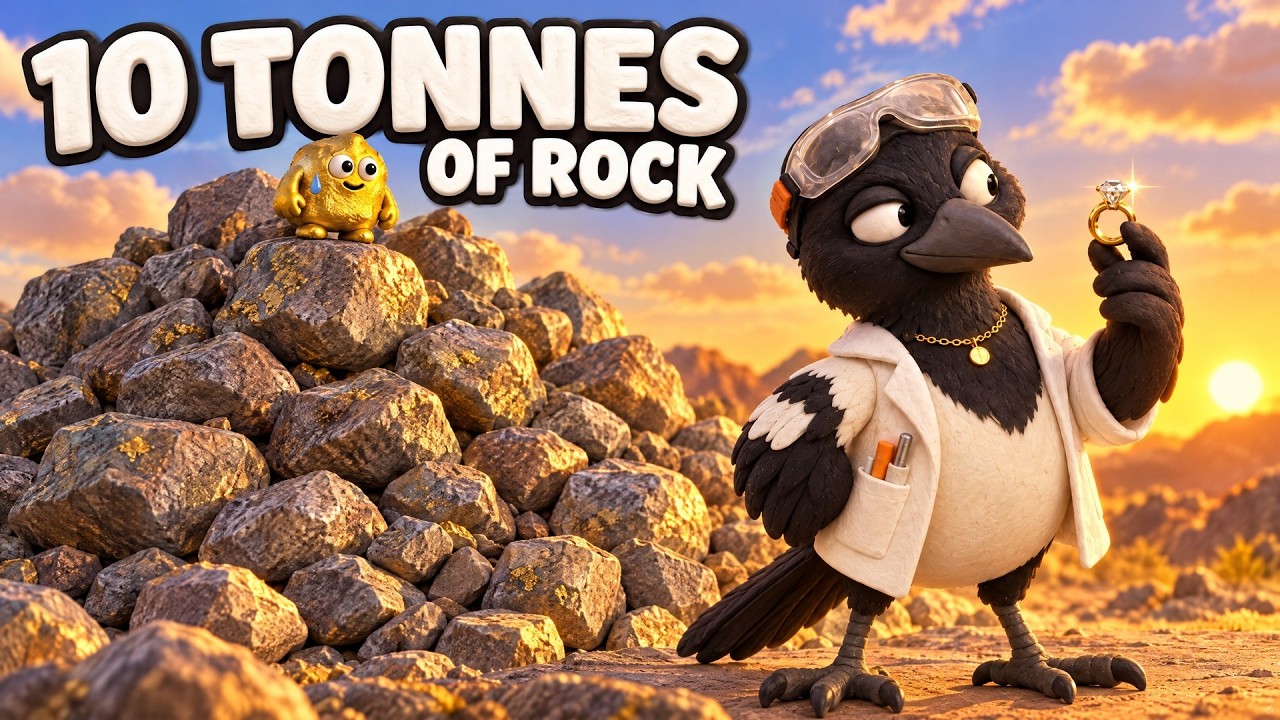
▶ Follows a gold nugget from rock to ring through drilling, crushing, leaching, melting and refining. · 5:27
What it costs to produce an ounce of gold
Cost of sales per ounce is the simplest comparable figure, but each owner builds it differently, so treat the bars as a guide. Barrick’s Nevada mines ran from about US$1,545 to US$1,921 per ounce sold in 2025, and Kinross’s three US mines from US$1,198 to US$1,918 per gold-equivalent ounce. Kinross guides its 2026 US cost of sales at about US$1,700 per ounce on roughly 685,000 ounces. Spot gold was US$4,104 per ounce on 7 October 2026 and averaged US$3,485.67 for 2025 (the 7 October figure is the New York spot price and the average uses Kitco prices, both from Elko Daily’s report on Nevada’s Major Mines figures), so the gap between price and cost is wide, but the cost of sales does not include everything a mine pays. Taxes, royalties, exploration and growth capital come out of the margin as well.
Chart
Cost of sales per ounce, 2025
US$ per ounce sold; owners define costs differently
Use the calculator to test your own numbers. A royalty is a share of sales paid to the owner of the mineral rights, and many US mines pay one to a land or royalty holder.
Calculator
What is a gold mine’s margin per ounce?
Enter your own ounces, gold price, cost and royalty.
- Annual revenue: $600,000,000
- Annual margin before tax and capital: $357,000,000
Example values only, not any mine’s figures. The gold price is an input: example, use today’s price (US$ per troy ounce). The cost default sits inside the 2025 cost-of-sales range of US$1,198 to US$1,921 per ounce in the chart (Barrick, Kinross). Result is before tax, capital, exploration and head-office costs.
How a US gold mine is permitted and reclaimed
On federal land, the Bureau of Land Management regulates hardrock mining under 43 CFR 3809. Work beyond casual use needs an approved plan of operations before it starts (small exploration that disturbs 5 acres or less a year can go ahead on a notice instead), and bulk sampling that removes 1,000 tons or more of presumed ore needs one as well (43 CFR 3809.11). Operators must also post a financial guarantee for reclamation. They can choose a guarantee for one operation, a blanket guarantee across a state or the nation, or evidence of a guarantee held under state law (43 CFR 3809.551). State agencies add water, air and closure rules. Reclamation means regrading disturbed ground, replacing topsoil and re-seeding, so that the land can serve a later use such as grazing or wildlife habitat. How well that works differs by site, climate and ore type.
The video below sets out seven environmental impacts of mining in plain terms, which are the issues those permits are written to manage.
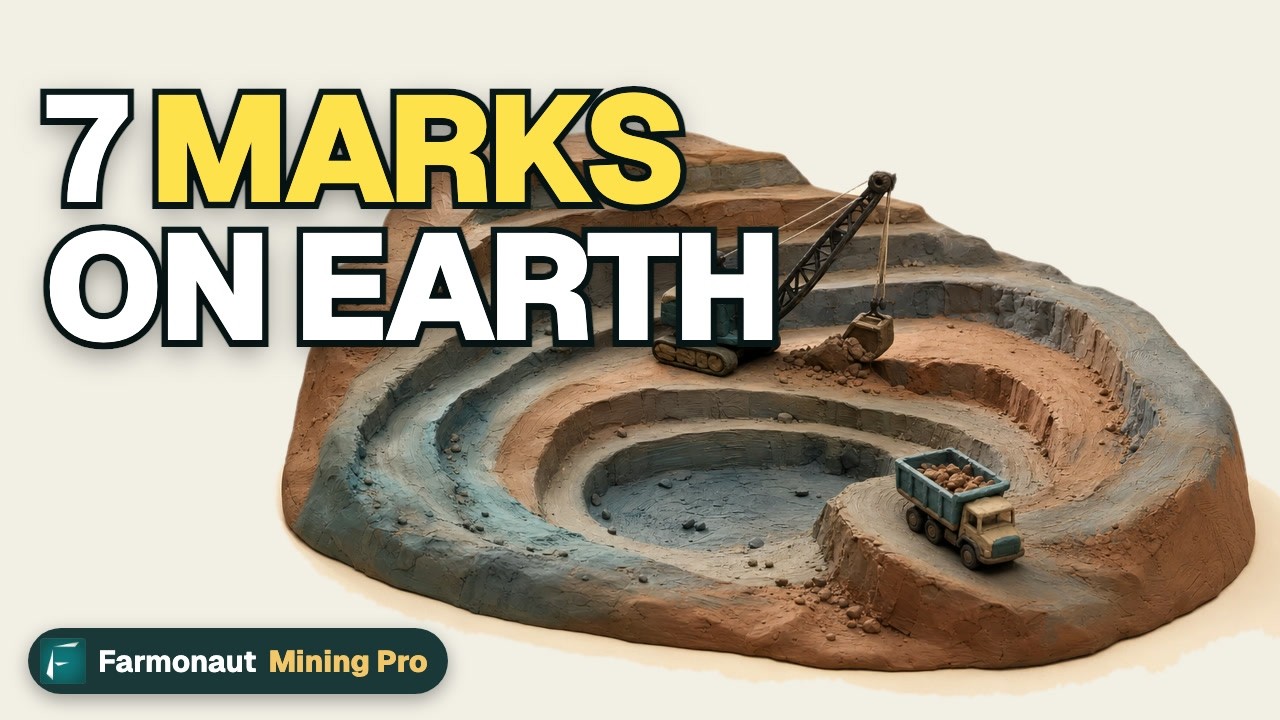
▶ A plain-language claymation on the seven environmental impacts of mining. · 2:31
What gold mining means for rural counties
Gold mines are usually far from cities, so they often are the biggest private employer in their county. Nevada’s mining industry directly employed an average of 14,491 people in 2025 at an average pay of US$125,218 a year, and the state put total mineral production value at about US$13.7 billion (Nevada Division of Minerals, via Elko Daily). Nationally, the USGS counts about 13,000 mine and mill workers in 2025. Their wages, plus local purchases and taxes, are what the “rural prosperity” case rests on. Effects differ by place. Mines also bring housing pressure, water demand and, at the end, closure, so planning for the day the ore runs out matters as much as the first payroll.
For other metals that Nevada produces, see our guide to the biggest lithium and uranium mining companies. For maps of where US gold sits in the ground, see our US gold deposits guide, and for one of the mines above, our Round Mountain gold mine profile.
What to watch at the biggest US gold mines
The owners’ own plans show where output may move next, so these points are worth tracking in the next quarterly reports.
- Kinross in Nevada: Round Mountain Phase X is an underground mine with reserve grades of 3.2 g/t, against 0.8 g/t for the open pit it replaces. Kinross says it extends the mine life by eight years to 2038. The three approved US projects are expected to start contributing in 2028 (Kinross 2025 results). Grams per tonne (g/t) is the standard grade unit, and a higher number means richer ore.
- Coeur in Alaska and South Dakota: Coeur guides 98,000 to 110,000 ounces at Kensington for 2026 and says Wharf’s mine life nearly doubled to twelve years after 2025 drilling (Coeur Q4 2025 release).
- SSR Mining: It expects Marigold’s 2026 output to be weighted 55% to 60% to the second half, because higher-grade ore stacked on the leach pad in the second quarter should produce later in the year.
- Nevada Gold Mines: The planned offering and the addition of Barrick’s excluded properties could change how this joint venture is owned and reported.
- Prices and costs: Cost of sales per ounce rose at several of the mines in 2025 as ore grades fell. A lower gold price squeezes the margin at the high-cost end first, which is why the calculator above uses cost per ounce as an input.
Production from these mines shifts from quarter to quarter with mine sequencing, so one weak quarter does not say much about the year. Check each company’s latest quarterly release on its own investor page, and see the Nevada Division of Minerals for state totals.
How new gold mines are found
All the mines above began as exploration targets. Companies narrow a search area with geology, geochemistry and remote sensing before drilling. Satellites cannot see gold itself, but they can map iron stains, clay minerals and fault patterns left by hot fluids, which help rank ground to visit first. The video below explains the idea. Farmonaut offers satellite-based mineral detection that screens a licence or claim area for exploration targets, which come ahead of any resource estimate. If you hold ground and want it screened, you can request a quote. Alaska is a good example of the search at work, and our Alaska gold deposits map shows the known sites.

▶ Explains how satellites help exploration teams by mapping the rock around gold. · 4:25
For a closer look at a related question, see our guide: Gold Deposits in Europe: Top 6 Mines Ranked by Output.
If this topic matters to you, read Top Canadian Gold Producers Ranked by Output next.
Frequently asked questions
Who is the largest gold miner in the US?
Nevada Gold Mines, owned 61.5% by Barrick and 38.5% by Newmont, is the largest, with about 2.59 million ounces in 2025 on a 100% basis (Barrick mine statistics). Kinross is the largest operator outside that joint venture.
Which is the biggest gold mine in the US?
The Carlin complex in Nevada, at about 1.12 million ounces in 2025 on a 100% basis, ahead of the Cortez complex at 739,000 ounces (Barrick, Q4 2025 mine statistics).
Which state produces the most gold?
Nevada, with about 64% of US output in 2025, followed by Alaska at about 22% (USGS, 2026).
How much gold does the US produce in a year?
The USGS estimates 160 metric tons of mine production for 2025, down from 187 tons in 2021. That is roughly 5.1 million troy ounces.
How many people work in US gold mining?
The USGS reports about 13,000 mine and mill employees in 2025. Nevada’s mining sector as a whole averaged 14,491 direct jobs in 2025.
Are there big gold mines outside Nevada and Alaska?
Yes. Cripple Creek & Victor in Colorado produced 152,557 ounces in 2025 and Wharf in South Dakota produced 97,327 ounces. The USGS counts lode gold mines in 12 states.
Who owns Nevada Gold Mines?
Barrick owns 61.5% and operates it, and Newmont owns 38.5%. Barrick has said it plans a public offering of a minority stake in a new company holding its North American gold assets by the end of 2026.
Does the US import or export gold?
Both. The USGS estimates 320 tons of gold imports and 260 tons of exports for 2025, against 160 tons mined.
Can I prospect or mine gold on public land?
Often yes on open federal land, but you need to follow the Bureau of Land Management and state rules, check who holds existing claims, and get permission before you disturb ground. Do not use mercury. This is general information, not legal advice, so confirm the rules with the regulator.
This page is for information only. It is not investment advice and gives no share prices or targets. It is not legal advice either: confirm claim and permit rules with the regulator. Get permission before prospecting, follow safety rules and never use mercury.
Farmonaut mining
Map your mining site from space
Mining consultants can see how satellite data screens a licence area for exploration targets, ahead of a resource estimate.

Mining Pro sample view, synthetic data
Keep reading
Sources
- USGS, Mineral Commodity Summaries 2026: Gold: pubs.usgs.gov
- Barrick, Q4 2025 mine statistics: s25.q4cdn.com
- Barrick, second quarter 2026 results: s25.q4cdn.com
- Kinross, 2025 fourth-quarter and full-year results: finviz.com
- SSR Mining, 2025 results: ssrmining.com
- Coeur Mining, fourth-quarter 2025 results: s201.q4cdn.com
- Newmont, Q4 2025 operating statistics: s24.q4cdn.com
- Northern Star, June 2026 quarterly report: nsrltd.com
- Elko Daily , Nevada Major Mines coverage: elkodaily.com
- 43 CFR 3809.11, plan of operations: law.cornell.edu
- 43 CFR 3809.551, financial guarantee: law.cornell.edu
- Nevada Division of Minerals, Mining: minerals.nv.gov
Discussion
Questions, corrections or field experience? Share them below. First-time comments are reviewed before they appear, and your email is never published.
No comments yet. Be the first to add a question or your experience.

 SenGold Invest SAS
 Sania Corporation
 Sean Mining Limited
 NTS Group (Pty) Ltd
 Mine4Africa
 Lithspo Minerals Limited
 Tintina Mining Group
 Dalgety Minerals Pty Ltd
 Vortex Minerals Pty Ltd
 Faith At Work (Pty) Ltd
 Geotech Mining Solutions plc
 Vulcan International Limited
 Kidepo Associates
 GKY Mining
 Alkimy SARL
 Double A Trading
 GemSprout Metals Limited
 Qader Group
 Ileys General Trading
 SG Gold Mining LLC
 VRV Global Pte Ltd
 Omsri International FZE
 G.I.T.T.
 Jaunita Erss Ltd
