

Crop Scouting Apps: Software, Satellite Data & Records
Reviewed August 2026 against USDA Agricultural Marketing Service, USDA NASS, and Frontiers in Insect Science.
Try it: Run your own numbers →
Crop scouting apps replace paper field notebooks with GPS-tagged reports, photo logs, and satellite vegetation maps that sync to your phone in the field. The best crop scouting software combines three things in one place: a mobile app for logging pest, disease, and spray observations; satellite imagery (NDVI and related indices) to spot problem zones before you walk them; and exportable records that satisfy pesticide recordkeeping rules. Below is what to look for, how the categories compare, and where the actual US data on pest losses and pesticide spend comes from.
Why Scouting Software Matters Now
US pests destroy a documented share of production every season, and the tools farmers use to catch problems early have not kept pace with the size of the problem. Globally, an estimated 45% of annual food production is lost to pests, according to Koppert US, drawing on Regional IPM Center data (Koppert US). On the input side, US growers apply roughly 500 million kg of pesticide active ingredient annually, per US EPA and USDA pesticide-risk databases, at an annual cost to US agriculture of about $10 billion (US EPA).
A meaningful share of that spend is avoidable overshoot. A 2025 study in Frontiers in Insect Science, synthesizing US crop pest management data from 1992 to 2018, found that resistance-driven applications account for about 10% of pesticide use and roughly $10 billion in annual economic losses across that period (Frontiers in Insect Science). US pesticide mass applied peaked near 500,000 tons in 1996 and again in 2018, per the same study — meaning three decades of chemistry and equipment advances have not reduced total volume, only shifted its composition. That is the gap scouting software is built to close: catching an outbreak or resistance signal early enough to spray less, not more.
The market reflects that pressure. The US precision farming software market — the category crop scouting apps sit inside — was valued at $470.31 million in 2025 and is projected to reach $1,263.52 million by 2034, a compound annual growth rate of 11.61% from 2026 to 2034, according to IMARC Group (IMARC Group). That’s the third-party evidence that adoption is accelerating; treat it as a market-size signal, not a per-farm cost estimate, since IMARC does not publish a per-acre subscription price and no source in this brief does either — check current vendor pricing pages directly for that figure.
What “Crop Scouting App” Actually Covers
Searches for crop scouting apps, scouting apps, crop scouting software, crop scouting tools, and crop monitoring app or crop monitoring software overlap heavily but are not identical requests. In practice, a complete tool needs to answer four separate jobs:
- Field observation capture — GPS-tagged notes, photos, and voice-to-text entries logged while walking a field, syncing once connectivity returns.
- Remote crop analysis — satellite-derived vegetation indices (NDVI and similar) that flag stressed zones between physical scouting visits, which is what distinguishes crop analysis software from a plain notebook app.
- Team and task coordination — assigning scouting routes to multiple people and consolidating their reports into one field record.
- Records output — exportable logs of what was observed, sprayed, and when, for internal use or compliance review.
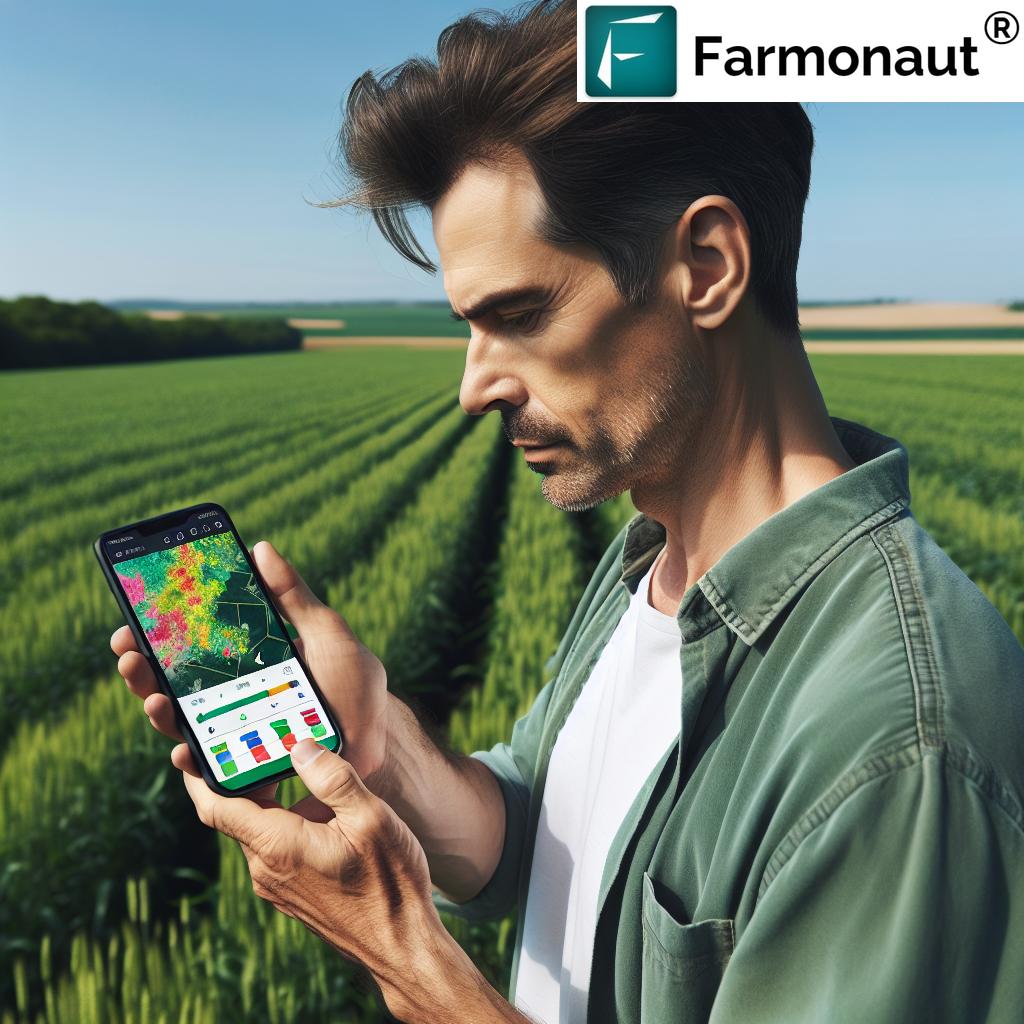
Farmonaut’s mobile app for crop scouting is built around the first two: field reports plus satellite insight, in one workflow, with the offline capture and task management described below.
Core Features to Compare
| Feature | Paper / manual scouting | Basic scouting app | Farmonaut’s app |
|---|---|---|---|
| Data collection | Handwritten notes, error-prone | Digital form, no GPS tagging | Digital forms, photo integration, GPS-tagged observations |
| Satellite integration | None | None or add-on | NDVI and vegetation-health imagery built in |
| Offline capability | Always available, no sync | Varies by app | Full offline capture, auto-sync on reconnect |
| Task management | Manual assignment | Limited or absent | Assign, track, and monitor scouting tasks per team member |
| Records export | Manual transcription | Basic CSV export | Exportable reports plus API access for external systems |
| Weather integration | Separate lookup | Varies by app | Weather data and forecasts inside the app |
Field Reports and Observations
The mechanics that separate a usable scouting app from a digital notebook: custom report templates by crop, GPS-tagged entries so each observation maps to an exact field location, multi-photo attachments for pest or disease evidence, voice-to-text for hands-full situations, and offline mode with automatic sync. None of that requires cell signal at the moment of capture — the sync happens once the device reconnects, which matters for the rural coverage gaps common across Midwest and Plains cropland.
Satellite Data: The Layer Paper Scouting Can’t Match
Satellite imagery adds a field-wide view between physical visits. Vegetation indices such as NDVI highlight stressed zones so a scout walks the acres that need attention instead of the whole field. Layered against historical imagery, the same data shows whether a stressed patch is new or a recurring pattern tied to soil or drainage. Weather data and forecasts sit inside the same view, so a scouting decision and a spray-window decision use the same screen. Layering and mapping this imagery is where GIS in agriculture comes in, and farms put it to use in several ways.
Records: The Compliance Layer Behind “Crop Record Keeping”
This is where scouting software overlaps with a legal obligation, not just convenience. Under the 1990 farm bill, federal law requires anyone applying a restricted-use pesticide to keep records of that application for 2 years, administered through USDA’s Agricultural Marketing Service pesticide recordkeeping program (USDA Agricultural Marketing Service). A scouting app that logs spray events alongside pest observations, with a timestamp and GPS location attached automatically, produces exactly the record that requirement asks for — without a separate paper logbook. If your state or crop program has additional recordkeeping rules beyond the federal 2-year minimum for restricted-use products, USDA AMS’s page above is the authoritative starting point to check current requirements, since state add-ons change independently of federal law.
Turning Observations Into Decisions
Logged data is only useful once it drives a decision. In Farmonaut’s app that means: recommendations generated from the combination of field data, satellite insight, and regional trend data; performance tracking across a season to see whether an intervention worked; pest and disease pattern review using historical plus current field data; and yield estimation that draws on both satellite indices and the observations scouts logged on the ground.
Coordinating a Scouting Team
Operations running more than one scout need task assignment, real-time notifications when a team member flags an issue, and the ability for multiple people to contribute to a single field report so no observation gets lost between phones. Farmonaut’s app supports all three, with a manager-level view of which fields have been covered and which are still pending.
Integrations: Why “Crop Scouting Software” Needs an API
Most farms already run other software — accounting, input purchasing, equipment telemetry — and a scouting tool that can’t move data in and out of that stack becomes an isolated island. Farmonaut addresses this with API access for connecting scouting and satellite data to existing farm management software or other agricultural tools (learn more about the API), plus data export in standard formats and support for pulling in readings from third-party in-field sensors. Full technical reference, including endpoints for satellite and weather data, is in the developer documentation.
What the Data Doesn’t Yet Tell Us
Being direct about the limits of the public record matters more than filling gaps with guesses. As of this review, there is no published figure for: the share of US farmers or acreage actively using a crop scouting app; a peer-reviewed yield-improvement percentage specifically attributable to scouting software versus unaided scouting; vendor-by-vendor market share in US crop scouting software; or a standard cost-per-acre for scouting-app subscriptions across the market. USDA’s National Agricultural Statistics Service (NASS) tracks the closest available proxy — pest management and technology adoption practices — through its Agricultural Resource Management Survey, queryable by state and year at the NASS Quick Stats Database; that dataset updates annually with roughly a six-month lag after each crop year closes, so a specific adoption number for your state and year is best pulled fresh from there rather than quoted secondhand. For market-share and per-vendor figures, that data sits with paid trackers such as IMARC Group, The Insight Partners, and Verified Market Research, which reissue precision-farming forecasts annually.
Crop Scouting Cost Calculator
Estimate the pesticide-application budget one scouting outcome could shift — how much a single avoided or resistance-driven spray pass is actually worth on your acreage, using the US per-acre application cost you enter below.
Run your own numbers
Assumes the entered cost-per-pass and avoided-pass count are accurate for your operation; excludes yield-loss risk from delayed detection, labor cost of scouting itself, and any spray still required regardless of timing. The 10% resistance-driven default reflects the 1992–2018 US average from Frontiers in Insect Science, not your farm specifically — adjust it to your own pest history.
Getting Started
- Download the app: from the Google Play Store or the Apple App Store, or use the direct app link.
- Create an account in the app or on the website.
- Map your field boundaries using the built-in mapping tools.
- Build report templates matched to your crops and the observations you track.
- Start your first scouting session and layer in satellite data as fields develop.
Pricing
Plans are listed on Farmonaut’s pricing page and vary by field area and feature tier; no third-party source in this review publishes an independent per-acre benchmark for scouting-app subscriptions, so compare current published tiers directly against your acreage before committing.
Frequently Asked Questions
Q: What’s the difference between a crop scouting app and crop monitoring software?
A: “Scouting” usually refers to the field-visit workflow — logging pest, disease, and spray observations on a phone. “Monitoring software” usually adds the always-on layer: satellite imagery and vegetation indices that watch fields between visits. A complete platform, including Farmonaut’s, does both.
Q: How current is the satellite imagery?
A: Update frequency depends on subscription tier and location, with most areas refreshed every few days and some plans offering more frequent coverage for specific regions — check current plan details for your area’s revisit schedule.
Q: Does the app work without cell signal?
A: Yes. Field reports and photos capture offline and sync automatically once the device reconnects.
Q: Will this satisfy pesticide recordkeeping requirements?
A: A scouting app that timestamps and geolocates spray events produces the type of record USDA’s Agricultural Marketing Service requires retained for 2 years for restricted-use pesticide applications (USDA AMS). Confirm your specific state’s rules add nothing beyond the federal minimum before relying on any single tool as your sole record.
Q: Can I connect other farm management systems or sensors?
A: Yes, through the API and third-party sensor integration, with full endpoint reference in the developer documentation.
The Bottom Line
Crop scouting software earns its place on a farm by closing the gap between a $10 billion annual pesticide cost and the roughly 10% of that spend tied to resistance-driven overspray (Frontiers in Insect Science) — catching problems early enough that a decision gets made with data instead of a guess. Whichever app you choose, weigh it against the four jobs above: field capture, satellite insight, team coordination, and exportable records. Farmonaut’s app for crop scouting covers all four, from the mobile app to the API layer behind it.

 Field Capacity
 Abhishta Agri
 SP Farms
 Indosistim Teknologi
 Liquify Digital
 CU Foods
 BeyondTech Global
 Rouge VC
 AgroGreen Dynamics
 AgroRisk
 Oath Inc
 Reddane Farming
 Esri North East Africa
 Cresol
 MDCV UK
 Etech Consulting Madagascar
 Vestlandsforsking
