

Reviewed August 2026 against USDA NASS land value reports, NCREIF farmland return data, and American Farm Bureau Federation market intelligence.
Try it: Run your own numbers →
U.S. Farmland Investment Guide: Platforms, Returns, Costs
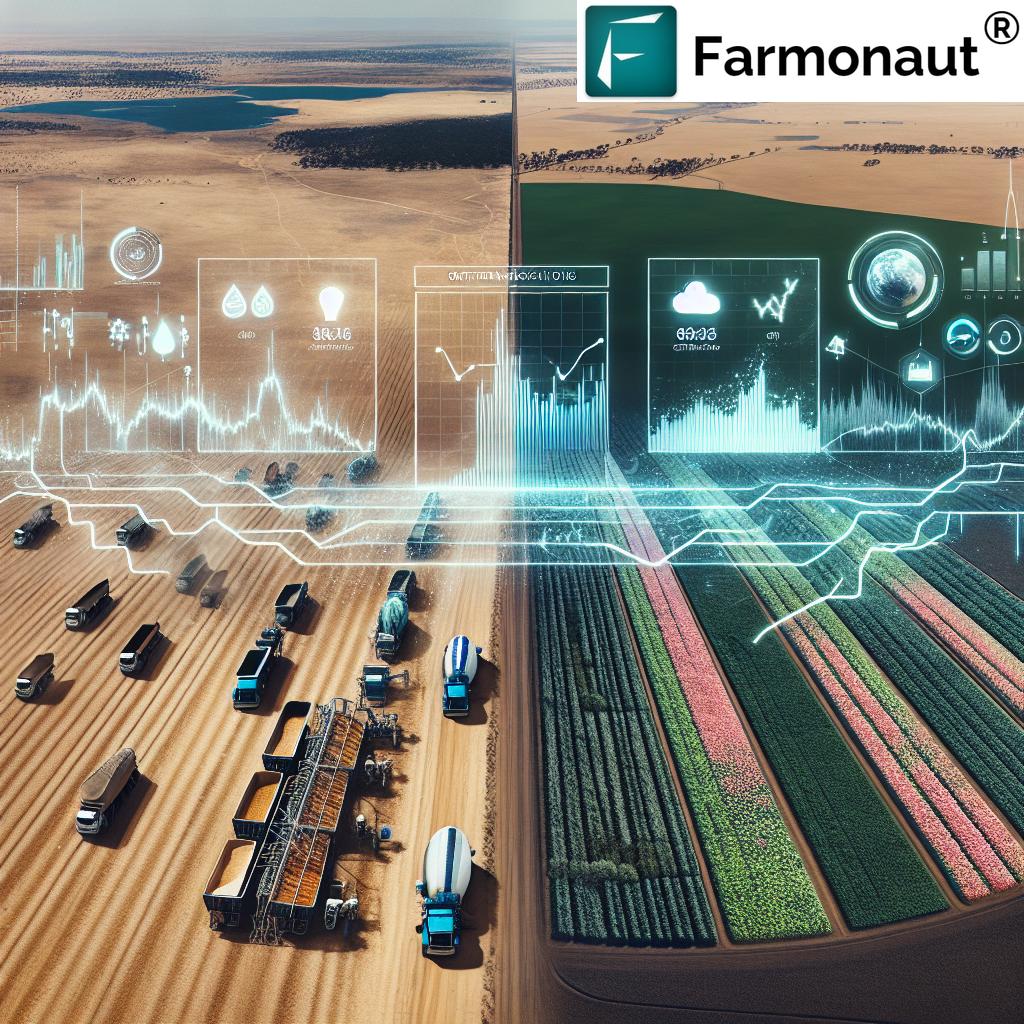
U.S. cropland averaged $6,020 per acre in July 2026, up 3.3% from $5,830 per acre a year earlier, according to USDA’s National Agricultural Statistics Service (NASS). Over the 33 years from 1991 through Q3 2024, the NCREIF Farmland Index delivered a 10.29% average annual return with only 6.74% volatility — a risk-adjusted profile few other asset classes can match. That combination of steady appreciation and low volatility is why farmland now sits in institutional portfolios alongside timber and real estate, and why a fast-growing set of platforms exist to let individual investors buy in without owning a tractor.
This guide covers what the farmland asset class actually is, how it has performed against other assets, what it costs to buy into by region and platform, and the checklist to run before you put money into any of it. Every figure below carries its source and date so you can verify or refresh it yourself — farmland prices, unlike some private-market assets, are published on a fixed public schedule.
Table of Contents
- What Is the Farmland Asset Class?
- U.S. Farmland Investment: Current Values by Land Type
- Farmland Returns vs. Stocks, Bonds, and Real Estate
- Farmland Investment Platforms: How to Buy In Without Owning a Farm
- Top Farmland Investment Firms and Fund Structures
- Agriculture Asset Management: What It Actually Involves
- Risks and Cost Pressures Investors Underestimate
- Where Agritech Fits Into Farmland Due Diligence
- Farmland Cash-Rent Yield Calculator
- A Durable Checklist for Evaluating Any Farmland Deal
- FAQs
- Try it: Run your own numbers
What Is the Farmland Asset Class?
Farmland is classified as a real asset — like timberland, energy infrastructure, or commercial real estate — because it produces income (from crops, livestock, or rent) and tends to hold or gain value during inflationary periods. The U.S. farmland and buildings market was valued at roughly $3.5 trillion as of 2024, per USDA data compiled by Statista. That places it among the largest real-asset categories in the country, larger than the market capitalization of most single industry sectors.
What makes farmland a distinct asset class rather than just “real estate” is its return driver: value comes from a combination of land appreciation and operating income (cash rent or crop share), not from tenant leases tied to office or retail demand cycles. The average U.S. farm covers 469 acres, per USDA NASS, and most farmland changes hands through private sales between neighboring operators rather than public listings — which is exactly the friction that farmland investment platforms exist to remove.
U.S. Farmland Investment: Current Values by Land Type
USDA NASS publishes farmland values every year in its Land Values Summary, typically released in the first week of August covering data through the prior July. The most recent report puts the national average cropland value at $6,020 per acre (July 2026), average pasture at $2,000 per acre (July 2026), and average farm real estate — land and buildings combined — at $4,500 per acre for 2026. Cropland rose 3.3% year over year, from $5,830 per acre in the 2025 report.
| Land category | Average value per acre | Period | Source |
|---|---|---|---|
| Cropland (US average) | $6,020 | July 2026 | USDA NASS |
| Cropland (US average) | $5,830 | 2025 | USDA NASS |
| Pasture (US average) | $2,000 | July 2026 | USDA NASS |
| All farm real estate (land + buildings) | $4,500 | 2026 | USDA NASS |
| Total US farmland + buildings market | $3.5 trillion (aggregate) | 2024 | USDA / Statista |
These are national averages; NASS’s full report breaks values down by state, and cropland in the Corn Belt or California’s Central Valley trades far above the national figure while range and pastureland in the Mountain West trades well below it. State-level detail is in the PDF itself — see the USDA NASS July 2026 Land Values report for your state’s numbers. Because this report refiles annually, treat any per-acre figure older than 12 months as a starting point for negotiation, not a closing price — pull the current PDF before you make an offer.
Cropping patterns shifted alongside prices: U.S. corn planted acreage fell roughly 3% year over year for the 2025–2026 crop year while soybean acreage rose about 5%, per USDA NASS Quick Stats. That swing matters to an investor because cash rent and land value both track the profitability of the dominant local crop — a county that shifted more acres to soybeans is pricing in different margin expectations than one that held steady on corn.
Farmland Returns vs. Stocks, Bonds, and Real Estate
The NCREIF Farmland Index — the industry benchmark tracked by the National Council of Real Estate Investment Fiduciaries — recorded a 10.29% average annual total return from 1991 through Q3 2024, with a standard deviation of just 6.74%. For comparison, that volatility is roughly half what you’d expect from the S&P 500 over the same window, per the NCREIF analysis published by Peoples Company. The five years from 2019 through 2024 were even stronger for cropland specifically, averaging above 9% annually.
That said, farmland is not immune to down years. The NCREIF Farmland Index posted a total return of just 0.20% in 2025 — a sharp deceleration that FarmTogether’s market analysts flagged as a rare downturn after more than a decade of consistent gains, driven by softer row-crop commodity prices compressing the income component of returns. Land values held up better than income returns did, which is the pattern typically seen when commodity prices fall faster than land supply adjusts.
Farm income at the sector level also matters to landlords collecting cash rent: USDA and the American Farm Bureau Federation project U.S. net farm income at roughly $180 billion for 2025. That figure sits below the record years of the early 2020s, which is consistent with the moderation seen in the 2025 NCREIF return and is the macro backdrop against which any current cash-rent negotiation should be read. For a peer-reviewed comparison of farmland’s risk-adjusted returns against equities and bonds, Purdue’s Center for Commercial Agriculture publishes an ongoing analysis — see Purdue Center for Commercial Agriculture’s farmland risk/return comparison.
Farmland Investment Platforms: How to Buy In Without Owning a Farm
Direct farmland ownership means buying a parcel outright, arranging a lease with an operator, and handling property tax, insurance, and capital repairs yourself — a six- or seven-figure commitment for even a modest parcel at $6,020 per acre cropland pricing. Farmland investment platforms exist to lower that entry point by pooling capital across investors into one of three structures:
- Farmland REITs: Publicly traded trusts that own diversified farmland portfolios; shares trade like any other stock, giving investors daily liquidity in exchange for less control over which specific farms are held.
- Private farmland funds: Pooled vehicles, often structured as LPs, that buy and manage a portfolio of farms on behalf of accredited investors, typically with multi-year lock-up periods and minimums in the tens of thousands of dollars.
- Fractional/crowdfunded platforms: Online marketplaces that let investors buy a fractional interest in a single named farm, with cash-rent or crop-share income distributed proportionally.
The global farmland and agriculture investment platform market was sized at approximately $1.25 billion in 2025, according to Intel Market Research — a figure that captures the platform/technology layer itself rather than the farmland assets under management, and one worth revisiting periodically since this segment is still consolidating. Before committing capital to any platform, verify: (1) whether it holds direct title to farms or only a contractual interest, (2) the fee load — acquisition fee, annual asset management fee, and disposition fee, stacked together, (3) the redemption or exit mechanism and its notice period, and (4) whether historical returns quoted are net of fees or gross.
For broader context on how agricultural asset management as a discipline extends beyond land acquisition into day-to-day operating decisions, see Farmonaut’s guide to agricultural asset management strategies, and for a primer on the commodities that drive farm income and therefore land value, see the top 10 agricultural commodities.

Top Farmland Investment Firms and Fund Structures
Rather than naming a “top” list that goes stale as firms merge, raise new funds, or close to new investors, evaluate any farmland investment firm — public REIT, private fund, or fractional platform — against the same five criteria institutional allocators use:
| Criterion | What to check | Why it matters |
|---|---|---|
| Track record length | Years of realized (not just marked) returns, ideally spanning at least one commodity down-cycle | 2025’s 0.20% NCREIF return shows even the benchmark has down years — a firm untested through one hasn’t proven risk management |
| Portfolio concentration | Number of farms, states, and crop types held | A single-region, single-crop portfolio carries weather and commodity-price risk the NCREIF index diversifies away |
| Fee structure | Acquisition, management, and disposition fees stacked as a total drag on the 10.29% long-run benchmark | A 2% annual fee is a fifth of the 33-year average return before any income tax |
| Liquidity terms | Redemption windows, lock-up length, secondary market (if any) | Farmland itself is illiquid; some platforms add fund-level lock-ups on top of that |
| Title and custody | Direct ownership vs. LP interest vs. platform-held note | Determines your legal claim if the platform or sponsor fails |
Regulatory filings are the most durable way to check any of this yourself: SEC EDGAR for public REITs and Reg A+/Reg D offering filings for private platforms, and state secretary-of-state records for the entity actually holding title to the land. A firm’s own marketing page will not tell you fee stacking or concentration — the filing will.
Agriculture Asset Management: What It Actually Involves
Agriculture asset management is the operating layer that sits underneath farmland ownership — the decisions that determine whether a parcel priced at $6,020 per acre actually delivers a return anywhere near the 10.29% long-run NCREIF average. It covers four recurring functions:
- Lease and tenant management: Structuring cash rent versus crop-share agreements so income scales with the tenant’s actual output rather than a fixed number that can strain the operator in a weak year.
- Capital improvement planning: Deciding when drainage, irrigation infrastructure, or water management systems pay for themselves in higher achievable rent.
- Input and operating cost monitoring: Tracking fertilizer, fuel, and labor costs against the commodity prices the tenant is selling into, since a rent increase timed against a margin squeeze usually ends the tenancy rather than raising income.
- Compliance and conservation program enrollment: Keeping the parcel eligible for USDA conservation and crop insurance programs, which affect both current income and resale value.
Agriculture investment management, the closely related discipline focused specifically on capital allocation across a farmland portfolio, layers on top of this operating work: deciding how much of a fund’s capital sits in row crops versus permanent plantings versus pasture, and rebalancing that mix as the corn/soybean acreage shifts documented above play out at the county level. Both disciplines depend on data most investors can’t get by driving past a field once a quarter — which is where remote monitoring tools fit in.

Risks and Cost Pressures Investors Underestimate
The 6.74% standard deviation on the 33-year NCREIF return understates farm-level risk because it’s a diversified-portfolio number. A single parcel or single-farm fractional investment carries concentrated exposure to:
- Commodity price cycles: The drop from a 9%+ five-year average to a 0.20% total return in 2025 traces largely to row-crop price softness compressing tenant margins and, in turn, rent negotiations.
- Acreage shifts: A 3% decline in corn acreage and 5% rise in soybean acreage year over year (2025–2026, USDA NASS) signals real re-pricing of relative crop economics at the farm level — land suited to one crop doesn’t reprice instantly to match.
- Interest rate exposure: Farmland acquisitions financed with debt are directly sensitive to prevailing agricultural lending rates; check the current rate environment via your lender or the Farm Credit System before assuming historical leveraged returns will repeat.
- Input cost inflation: Fertilizer, fuel, and equipment costs move independently of land values and directly squeeze the income component of total return; USDA’s ag price indices track this by month and are worth checking against your specific region’s crop mix.
None of this is published as a single “risk score” anywhere — it has to be assembled from the same NASS acreage and land-value releases cited throughout this guide, cross-referenced against the specific crop and region of any deal under consideration.

Where Agritech Fits Into Farmland Due Diligence
Whether you own a parcel directly, hold shares in a fund, or manage a tenant relationship on someone else’s behalf, the underlying question is the same one agriculture asset managers ask every season: is this land producing at the level its price implies? Satellite-based monitoring tools like Farmonaut give investors and operators a way to check crop health, soil moisture, and yield trajectory across a portfolio without a site visit for every parcel every week — directly relevant to the lease and capital-improvement decisions described above. That includes precision agriculture technologies that track field-level conditions across a portfolio, and developer-accessible data through Farmonaut’s satellite and weather API for firms building their own asset-monitoring dashboards, documented at the API developer docs.
This kind of monitoring doesn’t change the macro figures — NASS land values and NCREIF returns are what they are regardless of which tenant is farming a given parcel — but it changes how quickly an owner or manager notices when a tenant’s actual performance is drifting from the lease assumptions, which is the earliest and cheapest point to intervene.

Farmland Cash-Rent Yield Calculator
Cash-rent yield — annual rent income divided by purchase price — is the single number that lets you compare a farmland deal against the 10.29% long-run NCREIF benchmark before you factor in land appreciation. Enter your own numbers below; nothing here is pre-filled with an assumption about your deal.
Run your own numbers
Assumptions: this calculator computes cash-rent yield only — it excludes land appreciation, property tax, insurance, capital improvements, and income tax. It does not model crop-share leases, only fixed cash rent. Cash-rent yield plus expected appreciation together approximate total return; use the NCREIF figures above as your appreciation benchmark, not a guarantee.
A Durable Checklist for Evaluating Any Farmland Deal
Prices and returns in this guide will be out of date within a year — that's the nature of an annually republished USDA series and a quarterly NCREIF index. What doesn't expire is the sequence of checks that separates an informed farmland investment from a marketing pitch:
- Pull the current NASS Land Values report for the specific state and land class (cropland, pasture, or irrigated vs. non-irrigated cropland) rather than relying on the national average — state figures can differ from the national number by a wide margin in either direction.
- Check the current NCREIF Farmland Index return against the 10.29% long-run average and the 0.20% 2025 figure to know whether you're evaluating a deal at the top, middle, or bottom of a cycle.
- Get the trailing three years of actual cash rent or crop-share income for the specific parcel, not a regional average, and compare it to current commodity price trends for that crop.
- Total every fee layer — acquisition, management, disposition — if buying through a fund or platform rather than direct title.
- Confirm the legal ownership structure via SEC EDGAR (public) or state filings (private) rather than the platform's own description of it.
- Check USDA NASS acreage-shift data for the relevant crop and county to see whether local farmers are already repricing the crop mix your rent projection depends on.
- Model the deal with cash-rent yield alone (see the calculator above) before adding any appreciation assumption, so you can see how much of the projected return depends on a price forecast rather than current income.
Global Demand Context for U.S. Farmland
U.S. farmland values are also shaped by global agricultural demand, since a meaningful share of U.S. row-crop and livestock output is exported. Growing global population and shifting dietary patterns support long-run demand for the commodities grown on the land you'd be buying into, while international trade policy directly affects which export markets are open in a given year — a factor worth checking against current USDA Foreign Agricultural Service trade data rather than assuming past export patterns hold. Diversification into different agricultural product categories is one way investors manage this exposure, since demand shifts do not move every commodity in the same direction at the same time.
Limited supply of arable land globally is the long-run structural argument for farmland as an asset class: agricultural land cannot be manufactured, and the $3.5 trillion U.S. market represents a fixed and, in net terms, slowly shrinking base of arable acreage against a global population that continues to need feeding. That scarcity argument doesn't guarantee any single year's return — 2025's 0.20% NCREIF figure is proof of that — but it is the reason farmland behaves differently from other real assets over multi-decade holding periods.

FAQs: U.S. Farmland Investment
- Q: Is farmland a good investment right now?
A: The long-run NCREIF Farmland Index average is 10.29% annually (1991–Q3 2024) with 6.74% volatility, but the index returned only 0.20% in 2025. Whether it's a good entry point depends on the specific parcel's cash-rent yield versus its price, not the long-run average alone — run the calculator above with the deal's actual numbers before deciding. - Q: What's the average price of U.S. farmland per acre?
A: USDA NASS put average U.S. cropland at $6,020 per acre and pasture at $2,000 per acre as of July 2026, with average farm real estate (land plus buildings) at $4,500 per acre for 2026. These are national averages; state-level values in the NASS report vary widely. - Q: What are farmland investment platforms and how do they differ from direct ownership?
A: They're pooled-capital vehicles — REITs, private funds, or fractional/crowdfunded marketplaces — that let investors buy exposure to farmland income and appreciation without buying and managing a whole parcel themselves. The trade-off is fee layers and, in most structures, reduced liquidity and control compared with direct title. - Q: How is agriculture asset management different from just owning land?
A: Agriculture asset management is the ongoing operating work — lease structuring, capital improvements, input cost tracking, and compliance — that determines whether owned land actually converts its price-implied potential into realized rent and appreciation. - Q: How do I check farmland values for my own state or county?
A: Download the current USDA NASS Land Values report, published annually each summer, or query state and county-level detail through USDA NASS Quick Stats. National averages in this guide are a starting reference, not a substitute for the local figure.

Further reading:
Explore Farmonaut's Tools for Agriculture Asset Management
For investors and managers who need portfolio-level visibility into farmland performance between NASS report cycles, Farmonaut's satellite monitoring tools are available on both major mobile platforms:


Whether you hold farmland directly, through a fund, or via a fractional platform, the underlying asset management discipline — tracking input costs, monitoring crop condition, and verifying that a tenant's performance matches lease assumptions — is what converts the raw NASS and NCREIF numbers in this guide into a return you actually realize.
Discussion
Questions, corrections or field experience? Share them below. First-time comments are reviewed before they appear, and your email is never published.
No comments yet. Be the first to add a question or your experience.

 Chimera Innovation
 Hiteshi Infotech
 Clubhouse OS
 Progenseed
 SkyHarvest
 Polaris Digitech
 Teledarbas
 Wild Oak Farm
 SFX
SFX BACF Africa
 Doodlakine
 Exurbia Geospatial
 FieldZero
 Indico Company
