

Farm commodities · Ranked guide
What Are Agricultural Commodities? Top 10 by Value
Agricultural commodities are raw farm goods, such as grain, oilseeds, livestock, milk, sugar and cotton, graded to a standard and sold in bulk. US law names 24 of them (CFTC). By FAOSTAT 2024 value, milk, rice and pig meat lead a top 10 worth about $2.58 trillion, close to half of world farm output by value.
Key takeaways
- An agricultural commodity is a graded, interchangeable farm product sold in bulk; the US Commodity Exchange Act names 24, from wheat and corn to livestock and frozen orange juice (CFTC glossary).
- Top 10 by world gross production value in 2024 (FAOSTAT, current US$): cow’s milk $379.4 bn, rice $361.7 bn, pig meat $354.7 bn, beef $306.4 bn, maize $269.6 bn, chicken $263.9 bn, wheat $208.5 bn, eggs $157.5 bn, soybeans $141.8 bn, tomatoes $136.2 bn.
- By weight, sugar cane leads at 1.94 billion tonnes in 2024, ahead of maize at 1.22 billion; the US grew about 31% of the world’s corn (FAOSTAT).
- CBOT corn had the most open futures contracts of any US farm market on 6 October 2026 (1.86 million), ahead of ICE Sugar No. 11 and CBOT soybeans (CFTC).
- The World Bank’s US corn benchmark fell from $252.7 a tonne in 2023 to $190.6 in 2024 and rose to $225.7 in July to September 2026; lower prices are why corn’s production value was smaller in 2024 than in 2022 although output rose.
In this article
- What are agricultural commodities?
- The top 10 agricultural commodities by value
- How we ranked them
- The top 10 agricultural commodities, one by one
- Other big agricultural commodities just outside the top 10
- How agricultural commodities are traded
- How agricultural commodity prices have moved
- What moves agricultural commodity prices
- Commodity value calculator: what is your crop worth?
- How farmers manage commodity price risk
- What commodities are grown for a purpose other than food?
- FAQ
Agricultural commodities are raw farm products, such as grain, oilseeds, livestock, milk, sugar and cotton, that are graded to a common standard and sold in bulk, so one lot can replace another. US law names 24 of them in the Commodity Exchange Act, from wheat and corn to livestock and frozen orange juice, according to the CFTC futures glossary.
The world’s farms produced goods worth about $5.24 trillion in 2024, measured as gross production value in current US dollars in FAOSTAT’s value of agricultural production data. This guide ranks the top 10 agricultural commodities by that value, shows how much of each the world grows, explains how each one is traded (CME Group and ICE futures, where a contract exists), charts recent prices, and gives a calculator that turns a futures price into a number for your own crop.
What are agricultural commodities?
A farm product becomes a commodity when buyers stop caring which farm it came from. That happens when the product is graded against a published standard. A grade fixes things such as moisture, broken kernels, protein or fat, so a buyer in Rotterdam can price a cargo of corn without seeing it.
Two examples show how exact these standards are. The World Bank’s benchmark corn price is for US No. 2 yellow maize loaded at US Gulf ports, as stated in the notes to the World Bank Pink Sheet (October 2026). The ICE Sugar No. 11 contract prices raw cane sugar at 96 degrees average polarization, from a fixed list of origin countries, according to the ICE Sugar No. 11 contract specifications.
The legal definition in the United States
The US Commodity Futures Trading Commission (CFTC) uses a four-part definition in its regulation 1.3(zz). An agricultural commodity is:
- one of the commodities listed by name in the Commodity Exchange Act, such as wheat, cotton, corn, the soybean complex and livestock;
- anything that is, or once was, or comes from a living plant or animal, is generally interchangeable within its class, and is used mainly for food, shelter, animal feed or natural fibre;
- tobacco, products of horticulture and other goods the CFTC designates by rule; or
- an index based wholly or mainly on agricultural commodities.
The named list covers wheat, cotton, rice, corn, oats, barley, rye, flaxseed, grain sorghums, mill feeds, butter, eggs, Irish potatoes, wool, wool tops, fats and oils, cottonseed meal, cottonseed, peanuts, soybeans, soybean meal, livestock, livestock products and frozen concentrated orange juice. One odd exception: a 1958 law still bans futures trading in onions, the CFTC glossary notes.
Agricultural products vs agricultural commodities
Every agricultural commodity is an agricultural product, but not every agricultural product is a commodity. Agricultural goods include anything grown or raised on a farm and sold on: grain, fruit, vegetables, meat, milk, eggs, flowers, wool and timber from farm woodlots. A bulk truckload of No. 2 yellow corn is a commodity. A branded jar of local honey, a box of heirloom tomatoes sold at a farmers’ market or an aged cheese is a product with its own identity and price.
The line moves as processing adds value. Raw milk is a commodity, and cheese, butter and nonfat dry milk have their own futures on the Chicago Mercantile Exchange; a named farmhouse cheese does not.
Main types of agricultural commodities
- Grains and cereals: corn (maize), wheat, rice, barley, oats and sorghum. Used for food, animal feed and fuel ethanol.
- Oilseeds and vegetable oils: soybeans, canola (rapeseed), sunflower and palm oil, crushed into oil for cooking and biofuel and into meal for feed.
- Livestock and meat: cattle, hogs and poultry, sold live or as carcasses and cuts.
- Dairy: raw milk, butter, cheese and milk powders.
- Soft commodities: the CFTC uses “softs” for crops such as sugar, cocoa and coffee; orange juice and cotton are often grouped with them.
- Fibers: cotton and wool.
- Roots, tubers and vegetables: potatoes, cassava and tomatoes. Large in value, but mostly sold fresh or under contract rather than on futures exchanges.
- Pulses: dry beans, lentils, peas and chickpeas.
The top 10 agricultural commodities by value
Ranked by gross production value in 2024 (current US dollars, FAOSTAT), the ten most valuable single farm commodities in the world are cow’s milk, rice, pig meat, cattle meat, maize, chicken meat, wheat, hen eggs, soybeans and tomatoes. Together they were worth about $2.58 trillion, close to half of all farm output by value.
Chart
The top 10 agricultural commodities by value
World gross production value in 2024, billion US dollars (current prices), single commodities
| Rank | Commodity | Value, 2024 | World output, 2024 | US output, 2024 | Main futures |
|---|---|---|---|---|---|
| 1 | Raw cow’s milk | $379.4 bn | 797 million t | 102.5 million t | CME Class III and IV milk |
| 2 | Rice (paddy) | $361.7 bn | 820 million t | 10.1 million t | CBOT rough rice |
| 3 | Pig meat | $354.7 bn | 125 million t | 12.6 million t | CME lean hogs |
| 4 | Cattle meat (beef) | $306.4 bn | 70 million t | 12.3 million t | CME live and feeder cattle |
| 5 | Maize (corn) | $269.6 bn | 1,218 million t | 377.6 million t | CBOT corn |
| 6 | Chicken meat | $263.9 bn | 128 million t | 20.2 million t | None of note |
| 7 | Wheat | $208.5 bn | 798 million t | 53.7 million t | CBOT SRW and HRW wheat, Euronext milling wheat |
| 8 | Hen eggs | $157.5 bn | 94 million t | 6.5 million t | None of note |
| 9 | Soybeans | $141.8 bn | 398 million t | 118.8 million t | CBOT soybeans, meal and oil |
| 10 | Tomatoes | $136.2 bn | 188 million t | 10.7 million t | None of note |
Values and tonnages come from the FAOSTAT value of production and FAOSTAT crops and livestock production datasets. Meat is carcass weight with the bone. Rice is paddy, before milling.
How we ranked them
Lists of “top agricultural commodities” often mix up three different things: what weighs the most, what earns the most, and what trades the most on exchanges. We picked one stated metric and stuck to it.
- Metric: gross production value, the quantity produced times the average price farmers receive, before any costs are taken off (it is not net income), for the whole world. FAO publishes it country by country and as a world total.
- Year and units: 2024, current US dollars, from the FAOSTAT release of May 2026. FAO marks most world totals for 2024 as estimates.
- Single items only: we ranked single commodities, not FAO’s groups such as “cereals” or “vegetables and fruit”.
- What we left out: processed goods (sugar, flour, vegetable oil) because FAO values the farm crop (sugar cane, wheat, oil palm fruit) instead.
A different metric gives a different list. By weight, sugar cane leads; by exchange trading, corn, sugar and soybeans lead. Both lists appear further down.
The top 10 agricultural commodities, one by one
1. Raw cow’s milk
Milk was worth $379.4 billion in 2024, the most of any single farm commodity. The world produced 797 million tonnes of cow’s milk; the United States produced 102.5 million tonnes, Brazil 36.8 million, the UK 15.9 million, Canada 10.0 million and Australia 8.7 million (FAOSTAT).
Main uses: drinking milk, cheese, butter, yogurt and milk powders. How it trades: raw milk is sold to dairies and processors. Price risk is managed on the Chicago Mercantile Exchange through Class III milk (200,000 pounds per contract), Class IV milk, butter, cheese and nonfat dry milk futures, all listed in the CFTC Commitments of Traders report for agriculture.
2. Rice
Rice was worth $361.7 billion, with 820 million tonnes of paddy grown in 2024. China grew 209 million tonnes; the US 10.1 million, Brazil 10.7 million and Australia 0.6 million (FAOSTAT).
How it trades: export rice is priced in deals between exporters and importers. The World Bank tracks Thai 5% broken white rice as a benchmark; it averaged $407.8 a tonne in 2025, down from $588.4 in 2024 (Pink Sheet). In the US, the CBOT rough rice contract covers 200,000 pounds.
3. Pig meat
Pig meat was worth $354.7 billion. The world produced 125 million tonnes in 2024, almost half of it in China (57.9 million tonnes). The US produced 12.6 million, Brazil 5.4 million and Canada 2.3 million (FAOSTAT).
How it trades: hogs go to packers through cash sales and contracts. The CME lean hog futures contract covers 40,000 pounds. Open interest was 296,786 contracts on 6 October 2026 (CFTC).
4. Cattle meat (beef)
Beef was worth $306.4 billion from 70 million tonnes. The US was the largest producer at 12.3 million tonnes, ahead of Brazil (10.2 million). Australia produced 2.6 million, Canada 1.3 million and the UK 0.9 million (FAOSTAT).
How it trades: through auctions, direct sales and formula contracts with packers. CME live cattle futures (40,000 pounds) and feeder cattle futures are the main hedging tools. The World Bank’s beef benchmark, New Zealand 90% lean beef delivered to US ports, averaged $6.86 a kilogram in 2025, up from $5.93 in 2024.
5. Maize (corn)
Corn was worth $269.6 billion and is by far the heaviest crop on this list: 1,218 million tonnes in 2024. The United States grew 377.6 million tonnes, about 31% of the world total, ahead of China (295 million) and Brazil (115 million). Canada grew 15.3 million (FAOSTAT).
Main uses: animal feed, fuel ethanol, sweeteners, starch and food. In the US, ethanol now takes nearly 45% of total corn use, says the USDA Economic Research Service. How it trades: the CBOT corn contract (5,000 bushels) is the most widely held farm futures contract in the CFTC’s weekly report, with 1.86 million contracts open on 6 October 2026.
6. Chicken meat
Chicken was worth $263.9 billion from 128 million tonnes. The US led with 20.2 million tonnes, then China (16.1 million) and Brazil (13.7 million). The UK produced 1.9 million, Australia 1.5 million and Canada 1.4 million (FAOSTAT).
How it trades: there is no chicken contract in the CFTC’s list of US agricultural futures. Birds are sold to processors and then to retailers and restaurants under negotiated deals. The World Bank tracks a Brazilian wholesale price for frozen chicken; it averaged $1.71 a kilogram in 2025.
7. Wheat
Wheat was worth $208.5 billion from 798 million tonnes. China grew the most (140 million tonnes). Among our readers’ countries, the US grew 53.7 million, Canada 35.9 million, Australia 34.1 million and the UK 11.2 million (FAOSTAT).
How it trades: by class. CBOT soft red winter (SRW) and hard red winter (HRW) wheat both use 5,000-bushel contracts, and hard red spring wheat now trades on MIAX Futures (CFTC). In Europe, wheat also trades on Euronext’s milling wheat futures in Paris. USDA forecast the 2026/27 US season-average farm price at $6.30 a bushel in its October 2026 WASDE report.
8. Hen eggs
Eggs were worth $157.5 billion from 94 million tonnes, about 1.78 trillion eggs. China produced a third of them (31.3 million tonnes). The US produced 6.5 million tonnes, the UK 0.8 million and Canada 0.7 million (FAOSTAT).
How it trades: eggs are one of the commodities named in the Commodity Exchange Act, but no egg futures appear in the CFTC’s current agricultural report. Prices are set in cash markets and in contracts between farms, packers and retailers.
9. Soybeans
Soybeans were worth $141.8 billion from 398 million tonnes. Brazil grew 144.5 million tonnes and the US 118.8 million; together they grew two thirds of the world’s crop. Canada grew 7.6 million (FAOSTAT).
Main uses: crushed into meal for animal feed and oil for food and biofuel. How it trades: the CBOT soybean contract (5,000 bushels) had 1.12 million contracts open on 6 October 2026, and soybean meal and soybean oil have their own futures (CFTC). USDA forecast the 2026/27 US season-average price at $12.00 a bushel (WASDE, October 2026).
10. Tomatoes
Tomatoes were worth $136.2 billion from 188 million tonnes. China grew 61.7 million tonnes; the US 10.7 million, Canada 0.5 million and Australia 0.4 million (FAOSTAT).
How it trades: tomatoes are perishable, so there is no futures market. Fresh tomatoes go through wholesale markets and retail buyers; tomatoes for paste and sauce go to processors.
Other big agricultural commodities just outside the top 10
Several crops that people think of first when they hear “commodities” rank below the top 10 by farm value. Some of them, such as sugar, cotton and canola, are among the most traded on exchanges.
| Commodity | Value, 2024 | US-listed futures contract | Contract size |
|---|---|---|---|
| Potatoes | $122.2 bn | None in the US | Not applicable |
| Apples | $111.6 bn | None | Not applicable |
| Grapes | $97.3 bn | None | Not applicable |
| Sugar cane | $96.0 bn | ICE Sugar No. 11 (SB) | 112,000 lb raw sugar |
| Seed cotton | $72.0 bn | ICE Cotton No. 2 (CT) | 50,000 lb net weight |
| Oil palm fruit | $66.5 bn | CME USD Malaysian crude palm oil | 25 tonnes |
| Rapeseed (canola) | $47.5 bn | ICE Canola (RS), in Canadian dollars | 20 tonnes |
| Green coffee | $24.9 bn | ICE Coffee C (KC), Arabica | 37,500 lb |
| Cocoa beans | $15.1 bn | ICE Cocoa (CC) | 10 tonnes |
Values are FAOSTAT gross production value for 2024 in current US dollars. The table is a selection: sweet potatoes, tea, cucumbers and buffalo milk also rank above seed cotton. Contract details are from the ICE Cotton No. 2 page, the ICE Coffee C page, the ICE Cocoa page, the ICE Canola page and the CFTC report. ICE calls Sugar No. 11, Coffee C and Cocoa world benchmark contracts for their markets.
Which agricultural commodity is produced most by weight?
Sugar cane. The world harvested 1.94 billion tonnes in 2024, then maize at 1.22 billion, rice paddy at 820 million and wheat at 798 million (FAOSTAT). Sugar cane is heavy because it is mostly water and fibre; it ranks 14th by value. The FAO agricultural production statistics 2010–2023 note that world output of primary crops reached 9.9 billion tonnes in 2023, and that maize, wheat and rice made up 91% of all cereal output that year.
How agricultural commodities are traded
There are three main ways a farm commodity changes hands, and one farm can use all three.
- Cash (spot) sale: you deliver the grain or animals and get today’s local price. The local price differs from the futures price by the “basis”, which reflects transport, storage and local supply.
- Forward contract: you agree a price and delivery date with a buyer, such as an elevator or a packer, before harvest or before the animals are finished.
- Futures and options: standard contracts on an exchange, for a fixed amount and grade, for delivery in a set month. Farmers and processors use them to lock in a price; speculators take the other side.
The chart shows the eight agricultural futures with the most open contracts in the CFTC’s weekly report on US exchanges. Contract sizes differ, so the bars show how widely held each contract is, not the dollar value. Corn, sugar and soybeans lead; the soybean complex (beans, meal and oil) holds three of the eight places.
Main futures contracts for agricultural commodities
| Commodity | Exchange | Contract | Size |
|---|---|---|---|
| Corn | CBOT (CME Group) | Corn | 5,000 bushels |
| Soybeans | CBOT (CME Group) | Soybeans | 5,000 bushels |
| Wheat | CBOT (CME Group) | SRW and HRW wheat | 5,000 bushels |
| Rice | CBOT (CME Group) | Rough rice | 200,000 pounds |
| Cattle | CME | Live cattle | 40,000 pounds |
| Hogs | CME | Lean hogs | 40,000 pounds |
| Milk | CME | Class III milk | 200,000 pounds |
| Sugar | ICE Futures U.S. | Sugar No. 11 | 112,000 pounds |
| Soybean meal | CBOT (CME Group) | Soybean meal | 100 tons |
| Soybean oil | CBOT (CME Group) | Soybean oil | 60,000 pounds |
| Cotton | ICE Futures U.S. | Cotton No. 2 | 50,000 pounds |
| Canola | ICE Futures U.S. | Canola (Saskatchewan delivery) | 20 tonnes |
| Coffee | ICE Futures U.S. | Coffee C | 37,500 pounds |
| Cocoa | ICE Futures U.S. | Cocoa | 10 metric tons |
Sizes are as listed in the CFTC Commitments of Traders report of 6 October 2026 and the ICE contract pages.
Chart
Most widely held US agricultural futures
Open interest, number of futures contracts, 6 October 2026; contract sizes differ
How agricultural commodity prices have moved
Grain and oilseed prices fell sharply after 2023 and were higher again in 2026. The World Bank’s benchmark price for US corn averaged $252.7 a tonne in 2023, $190.6 in 2024 and $203.2 in 2025, then $225.7 in July to September 2026. US hard red winter wheat and soybeans followed a similar path (Pink Sheet, October 2026).
Chart
Benchmark prices for corn, wheat and soybeans
US dollars per tonne; annual averages for 2023 to 2025, quarterly average for July to September 2026
Lower prices explain why the dollar value of some big crops shrank even though farmers grew as much or more. Corn’s gross production value fell from $368.1 billion in 2022 to $269.6 billion in 2024; wheat fell from $268.2 billion to $208.5 billion. Livestock products held up: milk, beef and chicken were all worth more in 2024 than in 2022 (FAOSTAT).
For a wider view of price drivers across commodity groups, the World Bank commodity markets page publishes the monthly Pink Sheet and a twice-yearly outlook. For price trends and outlooks in more depth, see our agricultural commodities news and market trends page.
Chart
Value of production, 2022 vs 2024
World gross production value, billion US dollars (current prices), selected commodities
What moves agricultural commodity prices
- Weather and crop size: drought or flood in a big exporter changes world supply. Markets react to each monthly USDA WASDE report, which updates world supply and demand forecasts.
- Demand for feed and fuel: livestock feed and fuel ethanol are the main US uses of corn (USDA ERS), so herd sizes and biofuel rules both move demand.
- Exchange rates: world benchmark prices are quoted in US dollars, so a weaker currency in Brazil or Australia changes what their farmers are paid.
- Trade policy: tariffs, export taxes and export bans move grain from one buyer to another and can raise or lower prices overnight.
- Energy and input costs: fuel and fertilizer costs feed into the price farmers need to break even.
- Animal disease: outbreaks such as bird flu or African swine fever cut supply and close export markets for meat and eggs.
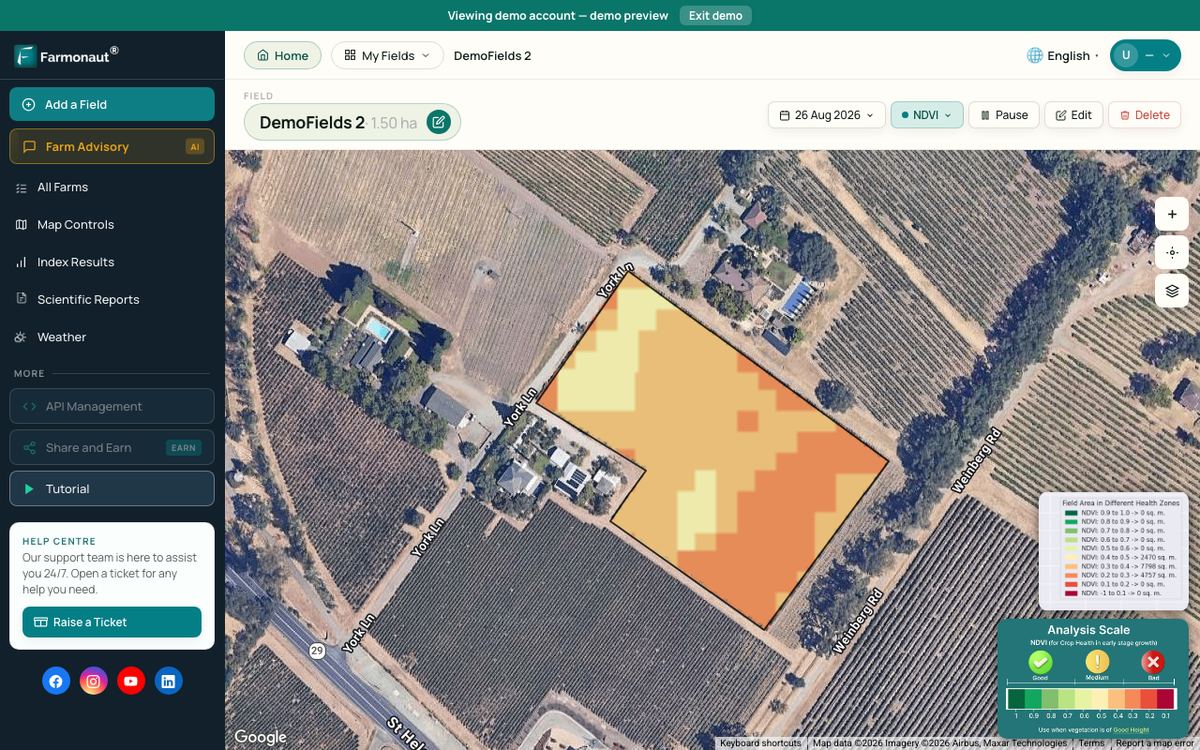
Watching your own crop through the season tells you early whether you will have more or less to sell than planned. Satellite crop maps from services such as Farmonaut show which parts of each field are growing well or falling behind, which helps you decide how much of the crop to price ahead.
▶ How satellite NDVI maps show crop stress across a 400-acre corn farm before it is visible from the ground. · 4:09
Commodity value calculator: what is your crop worth?
A futures quote is a price per bushel, pound or tonne. A farm decision needs a total: what the whole crop is worth, whether that price covers your costs, and how many contracts would cover part of the crop. The calculator below does the arithmetic. It starts with 500 acres of corn, 180 bushels an acre, USDA’s October 2026 season-average price forecast of $4.70 a bushel, and a cost of $850 an acre. These are examples only; type in your own numbers.
The calculator does not give trading advice. Futures can lose more than the money you put in. Talk to a licensed broker or farm financial adviser before you hedge, and check the exchange’s current contract rules.
Try the numbers for your own farm below.
Calculator
What is your crop worth at a given price?
Enter your own area, yield, price, cost and contract size.
- Margin per acre (negative means a loss): -$4
- Break-even price: 4.72 $/bu
- Value of one futures contract: $23,500
- Contracts to cover your chosen share: 9.0
Example values only, not a benchmark, a forecast or trading advice. The $4.70 a bushel default is USDA’s 2026/27 US season-average corn price forecast (WASDE, October 2026); the 5,000-bushel contract size is the CBOT corn, soybean and wheat size listed by the CFTC. Yield, cost and the share to price are round examples: change them to your own. Futures can lose more than the deposit; talk to a licensed broker or adviser before you hedge.
How farmers manage commodity price risk
Price is only half of farm income; the other half is how much you grow. A sound marketing plan looks at both.
- Price part of the crop, not all of it: one approach is to forward-sell or hedge a share of expected output early and leave the rest open until the crop is safe.
- Know your break-even: cost per acre divided by expected yield gives the price you need. The calculator shows it.
- Use crop insurance: revenue insurance can protect against both low yields and falling prices; rules differ by country and by program.
- Spread risk across enterprises: mixing crops and livestock, or several crops, means one bad price does not hit the whole farm.
- Store or sell: on-farm storage lets you wait for a better basis, but it costs money and carries quality risk.
▶ Why mixing crops and livestock on one farm spreads risk across more than one commodity. · 2:55
What commodities are grown for a purpose other than food?
Several agricultural commodities are grown mainly for fibre, fuel or industry rather than for eating.
- Cotton: grown for textile fibre; the seed is crushed for oil and feed. The world grew 72.8 million tonnes of seed cotton in 2024 (FAOSTAT).
- Wool: a named commodity in the Commodity Exchange Act, used for clothing and carpets.
- Corn for ethanol: nearly 45% of US corn use goes to fuel ethanol (USDA ERS).
- Vegetable oils for biodiesel: soybean, canola and palm oil are also used to make biodiesel and renewable diesel.
- Natural rubber: tapped from rubber trees for tyres; the World Bank tracks its price alongside farm goods.
- Tobacco and flowers: the CFTC definition names tobacco and horticulture products as agricultural commodities.
Related pages on our site: satellite-based verification for crop loans and insurance, product traceability, carbon footprint tracking, the large-scale farm management dashboard and the satellite and weather API developer docs.
FAQ
What is an agricultural commodity in simple terms?
It is a raw farm product, such as corn, wheat, milk, cattle or cotton, that is graded to a standard and sold in bulk, so buyers treat one lot as the same as another. US law names 24 such commodities in the Commodity Exchange Act.
What are the top 5 agricultural commodities?
By world gross production value in 2024 (FAOSTAT, current US dollars): cow’s milk ($379.4 billion), rice ($361.7 billion), pig meat ($354.7 billion), beef ($306.4 billion) and maize ($269.6 billion). By weight, the top five are sugar cane, maize, rice, wheat and cow’s milk.
Which agricultural commodities are traded the most on futures exchanges?
In the CFTC’s weekly report for 6 October 2026, the agricultural futures with the most open contracts were CBOT corn (1.86 million), ICE Sugar No. 11 (1.16 million) and CBOT soybeans (1.12 million), followed by soybean meal, soybean oil and SRW wheat.
What are soft commodities?
The CFTC uses “soft commodities” for crops such as sugar, cocoa and coffee. Traders often add cotton and orange juice. Grains, oilseeds and livestock are usually treated as separate groups.
How can I invest in agricultural commodities?
People get exposure through futures and options, exchange-traded funds that hold futures, or shares in farm and food companies. Each carries risk, and futures can lose more than the deposit. This page is not financial advice; get advice from a licensed professional before you invest.
Farmonaut crop monitoring
See your own fields from space
Draw your fields once and Farmonaut shows satellite crop health maps for them through the season, on web, Android or iOS.



Keep reading
Sources
- CFTC, Futures Glossary (agricultural commodity, enumerated agricultural commodities, soft commodities): cftc.gov
- CFTC, Disaggregated Commitments of Traders, Agriculture, Futures Only, 6 October 2026: cftc.gov
- FAO, FAOSTAT Value of Agricultural Production (release of May 2026, data to 2024): fao.org
- FAO, FAOSTAT Crops and Livestock Products (production quantities to 2024): fao.org
- FAO, Agricultural production statistics 2010-2023 (FAOSTAT highlights, 2024 update): fao.org
- World Bank, Commodity Price Data (The Pink Sheet), 2 October 2026: thedocs.worldbank.org
- World Bank, Commodity Markets: worldbank.org
- USDA, World Agricultural Supply and Demand Estimates (WASDE-676), October 2026: usda.gov
- USDA Economic Research Service, Feed Grains Sector at a Glance: ers.usda.gov
- ICE Futures U.S., Sugar No. 11 Futures contract specifications: ice.com
- ICE Futures U.S., Cotton No. 2 Futures contract specifications: ice.com
- ICE Futures U.S., Coffee C Futures contract specifications: ice.com
- ICE Futures U.S., Cocoa Futures contract specifications: ice.com
- ICE Futures U.S., Canola Futures contract specifications: ice.com
- Euronext, Milling Wheat (EBM) futures: live.euronext.com
Discussion
Questions, corrections or field experience? Share them below. First-time comments are reviewed before they appear, and your email is never published.
No comments yet. Be the first to add a question or your experience.

 Soybean Processors Association
 Sun Palm Australia
 Grandstream Algérie
 XOS Realty
 Geospatial Lab Africa
 Agro La Gándara
 HIPSAC
 ZOL Zimbabwe
 Juligerm
 AdBio
AdBio MISE Maroc
 NWNS
NWNS Red August Group
 Farm Inc
 WeMe Global
 Agrotoken
 Blue BearX
 Insignito
 Croptimum
 DnCubed
