

Agriculture Advertising: Proven Channels, Real Numbers
Reviewed August 2026 against USDA’s Economic Research Service, the 2022 Census of Agriculture, and Defra’s Agriculture in the United Kingdom 2024 release.
Try it: Satellite monitoring ROI: what it returns on your acreage →
Agriculture advertising works when it does two different jobs: selling farm products to consumers and buyers, and selling equipment, inputs, or services to farmers themselves. The channels, the audience, and the numbers behind each job are not interchangeable. Below is what the direct-to-consumer, digital, trade-show, and farmer-targeting sides of agriculture advertising actually produce, with the USDA and Defra figures behind them, a comparison table, four charts built from those figures, and a calculator you can run with your own numbers.
- Agriculture Advertising by the Numbers
- Two Different Jobs: Marketing and Advertising in Agriculture
- Know Your Buyer Before You Spend
- Digital Channels for Agricultural Advertising
- Direct-to-Consumer: The Farming Advertising Strategy With the Clearest Payback
- Trade Shows and Other Methods of Advertising in Agriculture
- How to Advertise to Farmers: Targeting the Buyer, Not the Eater
- A UK Case Study: Farm Shops as an Advertising Channel
- Methods of Advertising in Agriculture, Compared
- Where Satellite and Traceability Tools Fit an Agriculture Advertising Strategy
- Trust, Testimonials, and Spreading the Risk Across Channels
- Agriculture Advertising: FAQs
Agriculture Advertising by the Numbers
In the United States, direct-to-consumer farm sales — the clearest form of agriculture advertising paying off in cash — reached $3.3 billion in 2022 across 116,617 farms, a 16% increase over 2017 in nominal dollars, according to USDA’s 2022 Census of Agriculture (data collected in 2022, released February 2024). That is a sliver of the wider picture: producers moved $17.5 billion in food through all direct-marketing channels that year, a 25% inflation-adjusted increase since 2017, and wholesale, retail, and institutional (“intermediated”) sales alone hit $14.2 billion, up 33.2% inflation-adjusted, across 60,332 farms — more than double the number of farms selling that way in 2017. Advertising that only chases the consumer half of that market is ignoring the larger and faster-growing half.
The chart below builds the $17.5 billion total from its two components, both reported by USDA’s Economic Research Service (ERS chart of note, 2022 Census of Agriculture) and confirmed against the census release covered by Seed World’s summary of the February 2024 USDA release. That release also puts the total US farm count at 1.9 million operations working 880 million acres (39% of all US land), with average farm size up 5% to 463 acres since 2017 — the backdrop against which any agriculture advertising budget has to compete for attention.



Two Different Jobs: Marketing and Advertising in Agriculture
“Agricultural advertising” gets used for two unrelated activities, and conflating them is why so much farm marketing underperforms. The first is a farm or agribusiness advertising its own produce, meat, or specialty goods to consumers, restaurants, or distributors — the direct-to-consumer and intermediated-sales world covered above. The second is a company advertising services or products to farmers: seed, machinery, crop insurance, agronomy advice, or ag-tech platforms. Ag advertising strategy has to name which job it is doing before it picks a channel, because a Facebook reel that wins over a household shopper does nothing for a 2,000-acre grain operation deciding on a fungicide programme.
Both jobs still run on the same underlying principle: know exactly who receives the message before writing it. The next sections split the two apart — starting with the consumer-facing side, then covering how to advertise to farmers as buyers in its own section further down.
Know Your Buyer Before You Spend
Every agriculture advertising strategy aimed at consumers starts with the same question: who is actually buying? Local households wanting fresh, traceable produce behave nothing like a restaurant buyer who needs a reliable weekly case count, and neither behaves like a regional distributor optimizing for cost per pallet.
- Demographics: age, location, farm size served, and buying patterns
- Purchasing behaviour: frequency, basket size, and preferred channel — market stall, online, wholesale
- Preferences: certifications (Organic, Regenerative, Fair Trade), bulk versus time-sensitive orders, and sourcing transparency
- Try it: Satellite monitoring ROI: what it returns on your acreage
Segmentation turns a generic flyer into three distinct messages: local consumers respond to freshness and community ties, distributors want consistent supply and traceability documentation, and restaurants want unique varieties they can put a story behind. For operations managing many fields or client accounts, tools built for large-scale farm management make that segmentation practical by tying customer and field data together instead of running both from separate spreadsheets.
Bottom line: a farm business that segments before it advertises turns a generic push into a set of personalized conversations, and that foundation determines whether every strategy below actually converts.
Digital Channels for Agricultural Advertising
A website, an active social presence, and a maintained email list remain the three legs of digital agriculture advertising, and each has a real, checkable benchmark behind it rather than a vibe.
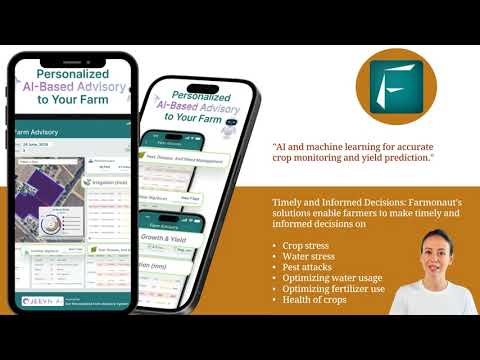
- Website: the base for ordering information, crop-health content, and contact details. Farmonaut’s platform lets a farm publish knowledge-backed field content alongside its sales pages, which gives visitors a reason to stay past the homepage.
- Social media: a 2023 Farm Journal Media poll found 45% of farmers using social media say it has helped their business, and the National Corn Growers Association projected in 2024 that close to 90% of farmers will use some form of social media to interact with consumers and industry peers by 2030 — both figures reported in a High Plains Journal review of the surveys published August 2024. The same review cites a USDA analysis finding a 15% average sales gain among farmers who promote goods on social platforms. Weigh that against the American Farm Bureau Federation finding, in the same review, that 58% of Americans say they know nothing at all about ranching or farming — the gap social content is actually closing.
- Email: skip the uncited “farms get 25-30% open rates” line that circulates without a source. Mailchimp’s own benchmark report, last updated December 2023, puts the all-industry average open rate at 35.63% and click rate at 2.62%; among the categories it tracks, non-profits led at a 40.04% open rate and 3.27% click rate, education and training sat at 35.64% and 3.02%, business and finance at 31.35% and 2.78%, and ecommerce trailed at 29.81% and 1.74% (see the chart below). A farm CSA or wholesale-buyer list should be measured against those published numbers, not an unsourced agriculture-specific figure.
Consistency compounds: farm tours, harvest updates, and answered questions posted on a regular schedule keep a brand present without a paid budget.
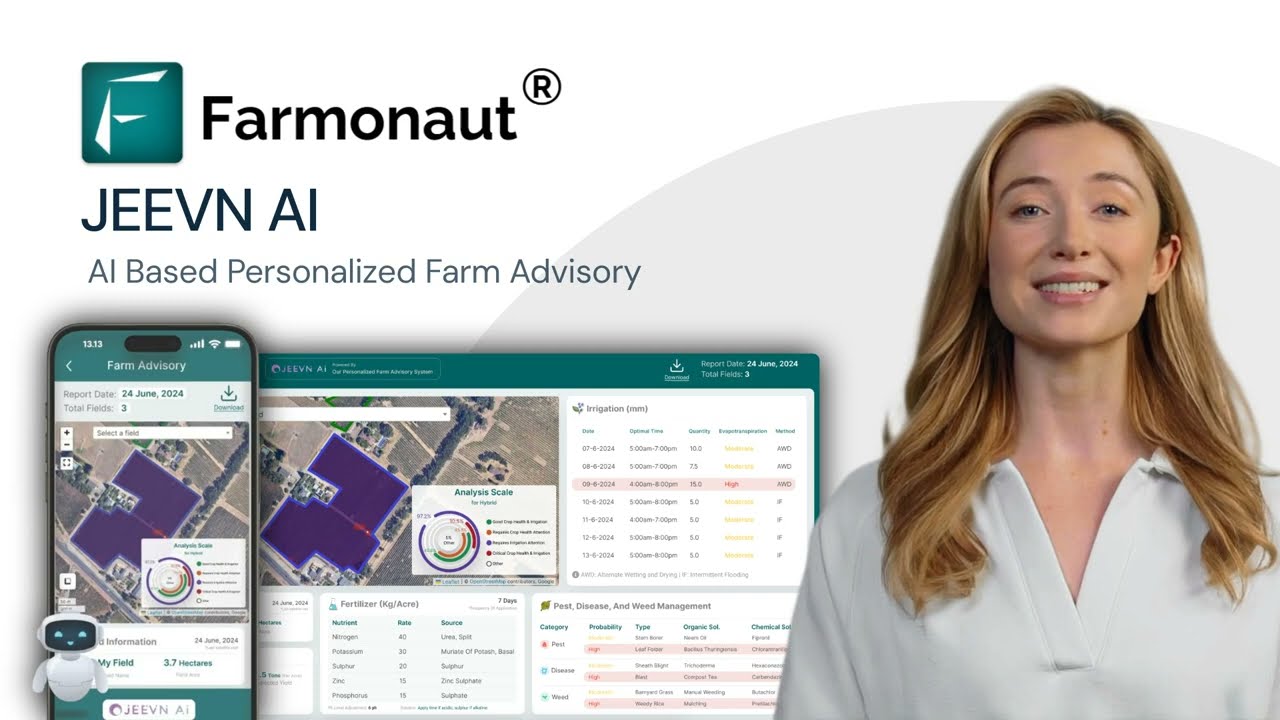
For a custom farm dashboard or a data-driven farm website: Farmonaut’s API (see the developer docs) exposes the same satellite and weather data behind the app for a custom build.
Direct-to-Consumer: The Farming Advertising Strategy With the Clearest Payback
Direct-to-consumer (DTC) selling is the one place agriculture advertising and agriculture revenue meet directly. Divide USDA’s $3.3 billion 2022 DTC total by its 116,617 selling farms and the average works out to roughly $28,300 in direct sales per farm for the year — a number every farm running a stand, CSA, or online store can benchmark itself against directly, and one that is due for a fresh Census of Agriculture update on the next five-year cycle.
- CSA programmes: members pay upfront for seasonal deliveries, smoothing cash flow before the growing season starts.
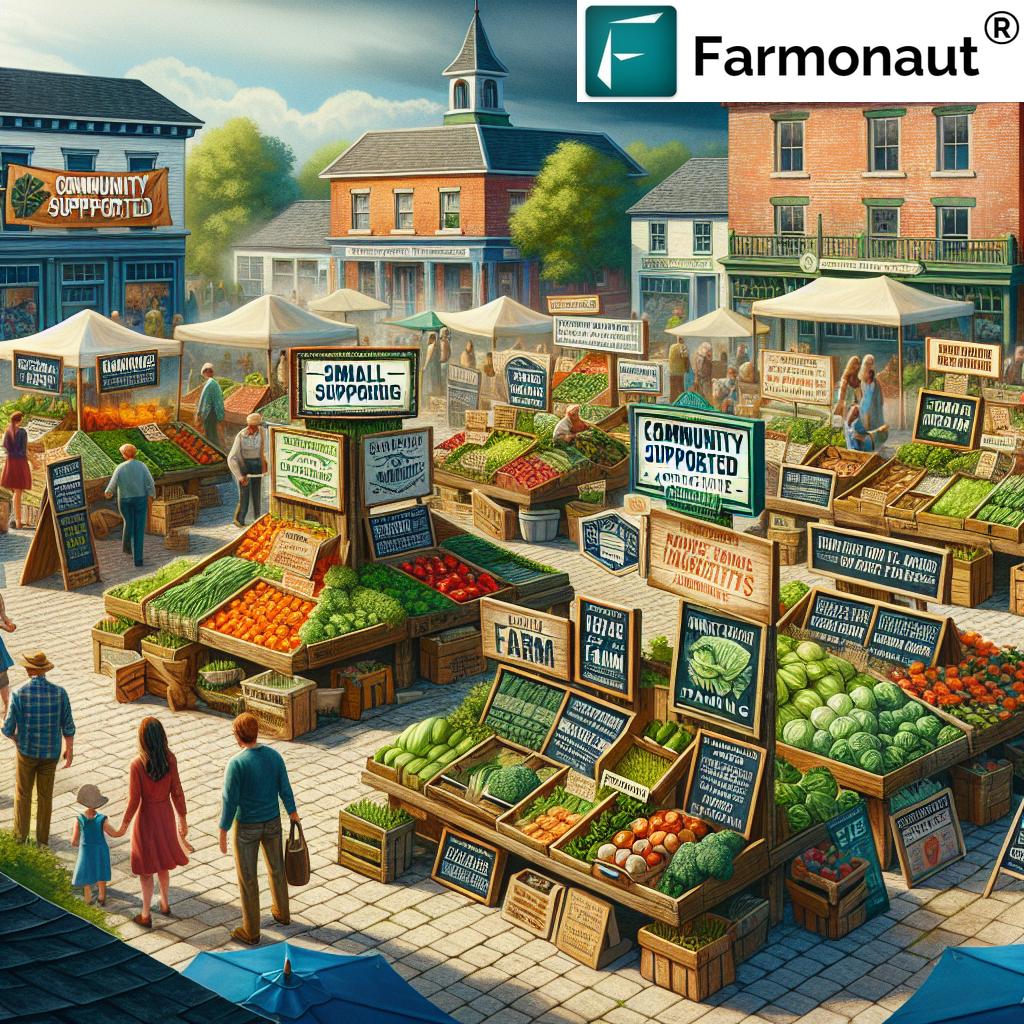
- Farm stands and farmers’ markets: in-person conversion and word-of-mouth referral in one visit.
- Online stores: reach beyond the local radius, with shipping and traceability as the trust mechanism replacing a face-to-face sale.
USDA’s own comparison shows why the DTC story is more interesting than “sales are up”: the number of farms selling direct fell 10.3% between 2017 and 2022, yet nominal DTC dollars rose 16% over the same span — fewer farms are capturing a larger, more concentrated slice of direct sales each. California alone accounted for 37.7% of national direct sales in 2022, with the rest concentrated on the West Coast and in Northeast metro areas, per the same ERS chart of note cited above.
Digital tools that verify origin — satellite-based field monitoring paired with blockchain traceability — give small DTC operations the same trust signal a big brand buys with certifications, which matters most for the online-store channel where the buyer never sees the field.

For the mechanics of setting up recurring, subscription-style direct sales, see Farmonaut’s companion piece on community-supported agriculture marketing.
Satellite monitoring ROI: what it returns on your acreage
Change any figure. Nothing is pre-assumed about your farm.
Your inputs only — this tool contains no benchmark yield or price data. Use your own last-season figures, and treat any vendor’s yield-gain percentage as unproven until they show you two contrasting seasons.
Assumptions: figures are illustrative starting points, not defaults — replace every field with your own numbers. The calculator does not account for repeat purchases, seasonal demand swings, or organic (unpaid) orders; treat its output as the paid-acquisition floor, not your total order count.
Trade Shows and Other Methods of Advertising in Agriculture
Digital reach has a ceiling that in-person methods of advertising in agriculture do not share. Trade shows and networking events let a business:
- Put products in front of a room of qualified buyers rather than a broad feed
- Demonstrate carbon-footprint tracking and traceability live, where a buyer can ask questions on the spot
- Build trust through direct Q&A that a landing page cannot replicate
- Pick up distribution or supply leads that started as a five-minute booth conversation
Farmers’ market promotion runs on the same logic at a smaller scale — local press coverage and repeat foot traffic come from being visibly present, not from a single social post.
How to Advertise to Farmers: Targeting the Buyer, Not the Eater
Everything above sells farm output to consumers or distributors. Ag-tech firms, equipment dealers, agronomy consultancies, and input suppliers face the opposite task: how to advertise to farmers as the buyer. That calls for a different targeting logic entirely.
- Segment by crop and county, not just demographics. USDA’s NASS QuickStats database publishes county-level acreage, yield, and crop-mix data for the US; the same segmentation logic applies to Defra’s regional agricultural statistics for the UK. A message aimed at a wheat operation in a Defra-reported region should not be the same message aimed at a specialty-vegetable grower.
- Segment by farm size. USDA’s 1.9 million-farm count spans everything from small plots to operations averaging 463 acres and larger; a service pitched at scale (fleet routing, large-block satellite monitoring) needs a different channel and offer than one pitched at a market-garden operation.
- Use the channels farmers already trust. Farm trade press, county extension offices, commodity-group newsletters, and peer recommendation carry more weight with a farmer audience than a generic display ad — consistent with the Farm Journal Media and National Corn Growers Association findings cited above on how farmers actually engage with content.
- Prove the service works before asking for the sale. A live field-health demo or a free trial period does more in this market than an impression-based campaign, because the buyer is evaluating a season-long relationship, not a single purchase.
This is also where advertising farm-input and farm-service businesses overlaps with the trade-show channel above: a booth conversation with a working demo converts a services pitch better than any single ad format, because the farmer is assessing whether the tool holds up under their conditions, not whether the creative is compelling.
A UK Case Study: Farm Shops as an Advertising Channel
The UK’s farm-retail sector shows what sustained on-farm advertising and reputation-building can do at scale. Britain has roughly 1,581 farm shops generating £1.4 billion in annual sales between them and employing around 25,000 people, according to research led by Harper Adams University with the Farm Retail Association, published March 2022. Of the retailers surveyed, 89% reported increased sales since 2019, 64% expected further growth, and close to a third had opened within the prior decade — a sector still expanding, not a legacy channel on the way out.
The same country’s total agricultural workforce stood at 453,000 in 2024, down 2.0% year on year, working 17 million hectares of utilised agricultural area (69% of UK land, down 1.5%), per Defra’s Agriculture in the United Kingdom 2024 release. That statistical release refreshes annually, so a UK-focused campaign should pull the current-year figures from Defra directly rather than reusing this year’s numbers past their shelf life.
Methods of Advertising in Agriculture, Compared
A single table cannot substitute for planning, but it can put the sourced numbers side by side so a farm or ag-tech marketer can weigh channels against comparable evidence rather than guesswork:
| Method | Who it reaches | Sourced benchmark | Source & date |
|---|---|---|---|
| Direct-to-consumer (stand, CSA, online store) | Households, local buyers | $3.3B in US sales, 116,617 farms, ~$28,300/farm | USDA 2022 Census of Ag, released Feb 2024 |
| Wholesale / intermediated marketing | Retailers, distributors, institutions | $14.2B, +33.2% since 2017, 60,332 farms | USDA ERS, 2022 data |
| On-farm retail (UK farm shops) | Local consumers | £1.4B sales, ~1,581 shops, 25,000 jobs | Harper Adams Univ. / FRA, March 2022 |
| Email marketing | Existing customers/subscribers | 35.63% avg. open rate, 2.62% click rate | Mailchimp, updated Dec 2023 |
| Social media | Consumers, industry peers | 45% of user-farmers say it helped their business; ~90% adoption projected by 2030 | Farm Journal Media 2023; NCGA 2024 projection |
| Trade shows & farmer-targeted B2B outreach | Distributors, dealers, farmers as buyers | No single national benchmark — use the event’s own attendee/exhibitor counts | n/a — verify per event |
Where Satellite and Traceability Tools Fit an Agriculture Advertising Strategy
The strongest agriculture advertising claims are the ones a buyer can verify, and that is the gap satellite and traceability tools close:
- Satellite-based crop monitoring — turns “well-managed and sustainable” from a slogan into a field-level image a buyer can see.
- AI-driven advisory content — gives a farm business real, farm-specific material to publish, instead of generic seasonal copy.
- Traceability — Farmonaut’s product traceability tools back up an origin claim with a checkable record, which matters most for the online-DTC and export-facing intermediated channels.
- Fleet and resource management — Fleet Management supports the on-time-delivery promise that multi-location or wholesale advertising depends on.
- Carbon accounting — Farmonaut’s carbon footprinting gives sustainability marketing a measured figure instead of an unverified claim.
- API access — the Farmonaut API and its developer docs let a marketing or product team build a custom dashboard around the same underlying data.
Trust, Testimonials, and Spreading the Risk Across Channels
Authentic testimonials still outperform claims made in a brand’s own voice: a CSA member, a chef, or a retail buyer describing a real outcome on video carries more weight than any tagline. Pairing that with real-time field data from Farmonaut’s platform — and backing customer service with contact center solutions when order volume grows — turns a testimonial into something a prospective buyer can cross-check rather than take on faith.
No single channel above should carry an entire agriculture advertising budget. Influencer partnerships, affiliate arrangements with complementary brands, and sponsored placement on food or sustainability publications spread the risk that any one platform’s algorithm or ad costs change unfavourably. Track results in whichever analytics tool already sits under the website or email platform in use, and reallocate toward whichever channel’s sourced numbers — from the table above — are actually moving for the specific audience being served.
Agriculture Advertising: FAQs
It covers two distinct activities: promoting farm products to consumers, restaurants, and distributors (the DTC and intermediated-sales world), and promoting products or services to farmers as buyers (equipment, inputs, ag-tech). Confirm which one a campaign is doing before choosing a channel.
Q2. What is the best agriculture advertising strategy for a small farm?
Direct-to-consumer selling has the clearest sourced payback: US farms selling DTC averaged roughly $28,300 in 2022 direct sales each, per USDA’s 2022 Census of Agriculture. Pair it with a maintained email list and consistent social posting rather than paid reach alone.
Q3. How do I advertise to farmers rather than consumers?
Segment by crop, county, and farm size using USDA NASS county-level data (US) or Defra’s regional statistics (UK), then use the channels farmers already trust — trade press, extension offices, commodity newsletters, and live demonstrations at trade shows — over generic display advertising.
Q4. Are the “72% saw sales growth from DTC” or “18% of farms use digital ads” figures real?
Treat any agriculture-marketing statistic without a named source and date as unverified. This article only uses figures traceable to USDA’s Economic Research Service, USDA’s Census of Agriculture, Defra, Harper Adams University/Farm Retail Association, Mailchimp’s published benchmarks, or the named 2023-2024 farmer surveys cited above.
Q5. What email open rate should a farm business expect?
Benchmark against Mailchimp’s published, all-industry figures (35.63% open rate, 2.62% click rate as of its December 2023 update) rather than an unsourced “agriculture” number, since no verifiable agriculture-specific benchmark from a named source could be confirmed at the time of writing.
Q6. How big is the direct-to-consumer farm market in the US?
$3.3 billion across 116,617 farms in 2022, up 16% in nominal dollars since 2017, alongside $14.2 billion in intermediated (wholesale/retail/institutional) sales — both from USDA’s 2022 Census of Agriculture, released February 2024. Check USDA ERS’s chart of note for the next census update.
Q7. Is farm-shop or farm-stand advertising still worth it in the UK?
Yes on the current evidence: UK farm shops generated £1.4 billion in sales with 89% of surveyed retailers reporting growth since 2019, per the Harper Adams University/Farm Retail Association study published March 2022. Confirm current turnover directly with the Farm Retail Association, since that figure is now several years old.
Further reading:
- agriculture digital marketing
Put an Agriculture Advertising Strategy to Work
- Decide first whether the campaign sells farm output or sells to farmers — the channels do not overlap
- Anchor every claim to a sourced number from the table above, not an inherited industry cliché
- Use satellite-backed monitoring and traceability to make sustainability and quality claims checkable, not just stated

 MapMyCrop
 Cresol
 Atur Kuliner
 MDCV UK
 Zerella Group
 Etech Consulting Madagascar
 Vestlandsforsking
 Agritein
 Delicio
 WB Dev
 Sama Premium
 Prochecker
 Tres Valles
 LACOS Geoinformation
 Magrifly
 LatConnect 60
 Blickwinkel
 Agricultural Credit Policy Council
 Marei Nursery
 eKGIS
 Mostas Tech

 Exploration consultancy · South Africa · Gold
 Licence holder · Niger · Gold
 Licence holder · Nigeria · Gold + lithium










