

Customer case study · Sugarcane
Sugarcane Irrigation Scheduling: A Satellite Case Study
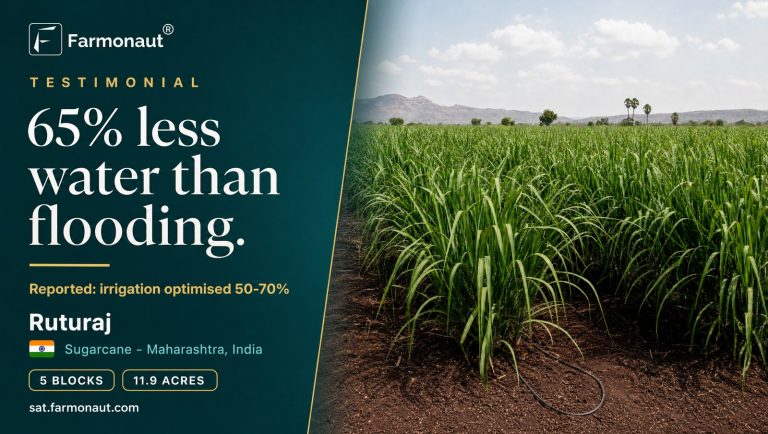
Weekly satellite advisories told sugarcane grower Ruturaj Gore to skip irrigation on 30–48% of days and to apply nothing for 27% of nutrient recommendations. He estimates irrigation was optimised by 30–50% and fertilizer use by 50–70%.
Key takeaways
- Ruturaj Gore’s five sugarcane plots (12.1 acres) received 202 satellite advisories between March and October 2026, about one every five days per plot.
- Skip days removed 30.0–38.5% of the water a same-dose daily routine would use on the four full-season plots, and 47.7% on the smallest plot.
- 27% of 1,010 nutrient recommendations were zero, rising from none in March–May to 100% in October as the cane ripened.
- Neighbouring plots got nitrogen rates from 15.8 to 39.6 kg per acre in the same week, instead of one blanket rate.
- At Maharashtra’s average costs, his estimates are worth about ₹86,000–₹1.28 lakh ($890–$1,320) for the season, most of it from fertilizer.
In this article
- The sugarcane farm and the season at a glance
- What Ruturaj reported
- How the sugarcane irrigation schedule was set each week
- Skip days: where the sugarcane water savings came from
- Monsoon and harvest taper: the shape of the season
- Sugarcane fertilizer schedule: applying only what each plot needed
- Building soil, not just applying fertilizer
- How much money Ruturaj may have saved
- Sugarcane yield outlook before the December harvest
- What this means for sugarcane growers in Florida, Louisiana and Texas
- How we built this case study
- Frequently asked questions about sugarcane irrigation scheduling
A good sugarcane irrigation schedule does two jobs. It gives the crop enough water through the long growth phase, and it cuts water back on days when the soil is already wet or the crop no longer needs much. This case study follows sugarcane grower Ruturaj Gore through a full season of weekly satellite advisories. It shows where the water and fertilizer savings the grower reported actually came from.
Ruturaj farms five sugarcane plots, 12.1 acres in all, on heavy clay soil in Maharashtra, India, a warm, semi-arid region with a summer monsoon. From March to October 2026, the Farmonaut Satellite + AI Farm Monitoring System sent 202 advisories for those five plots, about one every five days per plot. Each one carried a seven-day drip irrigation plan, a nutrient-by-nutrient fertilizer plan and a yield estimate.
In August we looked closely at one week of his advisories, in how his drip plan compared with flood irrigation. This follow-up covers the whole season, from tillering to the run-up to harvest, and adds the fertilizer side.
On 18 October 2026, Ruturaj filled in our in-app feedback form again. His answers: the advisories helped optimise irrigation by 30–50% and fertilizer use by 50–70%. We went back through every advisory to see how the advice could produce savings of that size.
The sugarcane farm and the season at a glance
All five plots were planted between late November and the end of December 2025, so they moved through the crop stages almost together. Four plots were monitored from March 2026. The smallest plot joined the service in July.
| Plot | Area | Planted | Advisories | Days with a drip plan |
|---|---|---|---|---|
| Plot 1 | 5.36 acres | 31 Dec 2025 | 45 | 220 |
| Plot 2 | 3.01 acres | 25 Dec 2025 | 46 | 224 |
| Plot 3 | 2.31 acres | 19 Dec 2025 | 45 | 224 |
| Plot 4 | 0.98 acres | 14 Dec 2025 | 44 | 216 |
| Plot 5 | 0.39 acres | 30 Nov 2025 | 22 | 109 |
The soil is a heavy, alkaline clay. The latest advisories measured a pH of 7.8 to 7.9 and soil organic carbon of 0.16–0.20%, which the advisory rates as low. Salinity was low on three plots and moderate on two. Drip was the recommended irrigation method on every plot, with furrow and alternate-furrow amounts shown alongside for comparison.
What Ruturaj reported
These are Ruturaj’s own answers from the October feedback form, word for word. The percentages are his estimates. They were not measured with a water meter or a fertilizer log.
| Topic | Question in the form | Ruturaj’s answer |
|---|---|---|
| Irrigation | Did this report help in optimising your irrigation? | Yes |
| Irrigation | By how much do you estimate your irrigation was optimised? | 30–50% |
| Fertilizer | Did this report help in optimising your fertilizer application? | Yes |
| Fertilizer | By how much do you estimate your fertilizer use was optimised? | 50–70% |
How the sugarcane irrigation schedule was set each week
Each advisory starts from a new satellite pass. Sentinel-2 photographs the same spot about every five days with two satellites, at 10 m detail in its visible and near-infrared bands. From each pass the system reads three signals for every plot:
Infographic
How each weekly drip plan is built in 5 steps
- 1Satellite passSentinel-2 and Sentinel-1 image each plot every few days.
- 2Read the fieldNDVI, NDWI and radar soil moisture show canopy, leaf water and soil wetness.
- 3Crop water useReference evaporation times the crop coefficient for the current stage.
- 4Skip rulesWet soil, a wet canopy or expected rain set that day to 0 mm.
- 5Dose and timingA drip amount in mm and an early-morning window for each day.
- NDVI, a measure of how green and dense the canopy is.
- NDWI, a measure of water held in the leaves. A water index built on near-infrared and shortwave-infrared light responds to changes in the liquid water content of vegetation canopies.
- Radar soil moisture from Sentinel-1, whose radar works day and night through cloud. That matters in monsoon months, when clouds hide the field from optical cameras.
Next, it works out how much water the crop is using. It multiplies a reference evaporation rate (ET0) by a crop coefficient (Kc) for the current growth stage. When a weather forecast was missing, the advisories used a temperature-based ET0 estimate, the same fallback method that FAO’s irrigation guide gives for places where full weather data is not available.
Finally, it applies skip rules. If the soil and canopy are already wet, or rain is expected, the day gets 0 mm. Otherwise the plan gives a drip amount in millimetres and an early-morning time window, such as 3.5 mm between 05:30 and 08:00. Morning watering loses less water to evaporation.
The advisory also explains how to turn millimetres into pump time: multiply the amount in millimetres by the area each emitter wets (in square metres), then divide by the emitter’s flow rate in litres per hour. The calculator further down does this for you.

▶ How to read a Farmonaut satellite farm advisory, section by section · 9:13
Skip days: where the sugarcane water savings came from
The biggest source of saved water was simple: days on which the advisory said not to irrigate at all. Across the season, 30% to 48% of days on each plot were zero-water days.
To see what that means, compare the advisory plan with a common routine: irrigating every day with the same drip amount the advisory used on its watering days. The difference is the water the skip days kept out of the field. On the four plots watched all season, it came to between 30.0% and 38.5% of that daily amount. On the smallest plot, watched from July through the wet months, it was 47.7%.
Those figures sit inside the 30–50% range Ruturaj reported. They do not prove his estimate, because we do not know exactly how the farm watered before. They do show that the advice itself, followed as written, removes water on that scale.
Chart
Season water: daily same-dose routine vs the advisory
Drip water per plot, mm, March to October 2026 (Plot 5 from July)
Try the numbers for your own farm below.
Calculator
How much water do skip days save on your farm?
Enter your own block size, drip amount and the share of days you skip.
- Water applied with skip days: 625,424 US gal
- Water saved: 12.4 acre-inches
- Drip run time on a watering day: 1.2 hours
Example values only, not a benchmark or forecast. 1 mm of water over 1 acre is 1,069.1 US gallons (1 acre = 4,046.86 m², 1 US gallon = 3.785 L). The run-time line uses the formula printed in each advisory: amount in mm × area wetted per emitter in m² ÷ emitter flow in L/h.
Monsoon and harvest taper: the shape of the season
The advised water changed with the crop and the weather. It peaked in April and May, during tillering and the start of grand growth, at 116–180 mm per plot per month. It eased in June and July as monsoon rain and wet soil triggered more skip days, then fell sharply from September. By October, with the cane ripening for a December harvest, each plot was down to about 40 mm for the month so far.
Chart
Advised drip water by month
mm per plot per month, 2026; March from the 12th, October to the 24th
The ripening advice lines up with published crop science. On 17 October the advisory used a crop coefficient of about 0.75 for ripening cane, and FAO’s standard table gives sugarcane a late-season Kc of 0.75, against 1.25 at mid-season. South African sugarcane research also notes that water stress before harvest, known as drying off, is beneficial and saves considerable water, and that mild stress often raises sucrose content. The advisory followed that pattern: a modest 3.5 mm on alternate days, tapering toward harvest.

▶ Why radar satellites can still see a field on cloudy monsoon days · 2:37
Sugarcane fertilizer schedule: applying only what each plot needed
For fertilizer, each advisory compared the measured level of five nutrients (nitrogen, phosphorus, potassium, sulphur and zinc) with an ideal range for the current stage. When a nutrient was already in range, the recommended rate was zero.
Chart
Share of nutrient recommendations set to zero
% of N, P, K, S and Zn recommendations per month, five plots, 2026
Across the 202 advisories there were 1,010 nutrient recommendations, and 27% of them were zero. In 48 advisories, all five nutrients were zero, so the plot needed no fertilizer that week. The share of zero recommendations grew through the season: none from March to May while the crop was building its canopy, 18% in July, 59% in September and 100% in October, when ripening cane stops responding to nitrogen.
The plots were also treated separately. On 22 April 2026, four plots planted within about two weeks of each other received nitrogen rates from 15.8 to 39.6 kg per acre. A single blanket rate would have over-fed some plots and under-fed others. Over the whole season, the share of zero recommendations ranged from 11% on one plot to 68% on another.
This matches how US extension services advise sugarcane growers. LSU AgCenter’s 2026 recommendations set potassium and phosphorus at zero when soil tests are high or optimum, and warn that too much nitrogen can raise tons of cane per acre but lower sugar per ton. They add that excess nitrogen can make brown rust worse. UF/IFAS bases phosphorus and potassium advice on soil tests too, but not nitrogen, because the soil nitrogen pool can change quickly. That is one reason a fresh nitrogen reading every few days is useful.
A weekly zero rate on 27% of recommendations does not translate directly into a 50–70% saving, because the amounts also changed from week to week. But together, the skipped nutrients, the different rate on each plot and the late-season cut-off are the mechanisms behind the saving the grower described.
Chart
Nitrogen advised for the same week, 22 April 2026
kg of nitrogen per acre per application, four plots planted within about two weeks
Building soil, not just applying fertilizer
Low organic carbon and an alkaline pH limit how well heavy clay soils hold and release nutrients. So alongside each mineral fertilizer, the advisories named an organic option, such as farmyard manure or pressmud compost from the sugar mill, with a maximum single dose. That gives the grower a way to raise soil carbon over several seasons while still correcting short-term shortfalls.
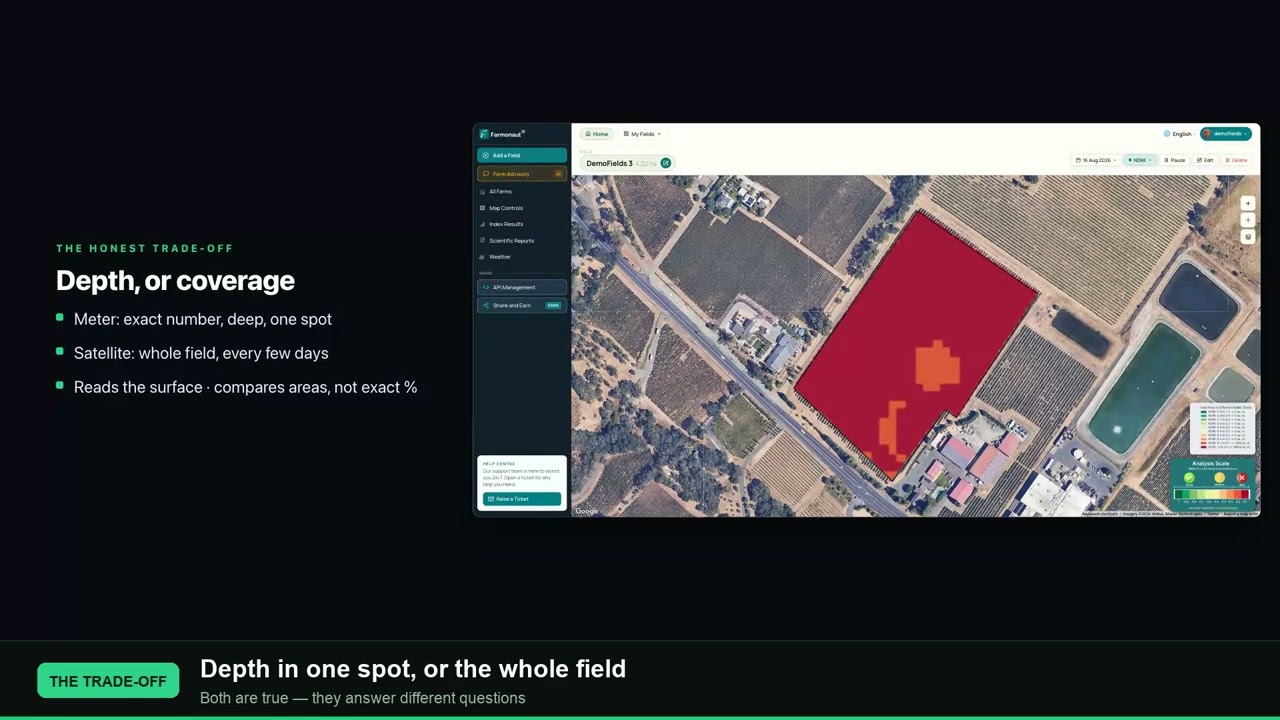
▶ What a satellite measures about soil moisture compared with a probe in the ground · 2:11
How much money Ruturaj may have saved
The feedback form asks for percentages, not rupees. To turn Ruturaj’s estimates into money, we applied them to the average cost of growing sugarcane in Maharashtra, India, where his farm is. India’s Directorate of Economics and Statistics surveys these costs each year. Its 2020–21 figures put irrigation charges for Maharashtra sugarcane at ₹19,083 per hectare and chemical fertilizer at ₹23,760 per hectare.
His five plots cover 12.06 acres, or 4.88 hectares. At those average costs, a season of irrigation would cost about ₹93,100 and a season of fertilizer about ₹1,15,900.
| Cost | Typical season cost (4.88 ha) | Ruturaj’s estimate | Potential saving |
|---|---|---|---|
| Irrigation | ₹93,100 | 30–50% | ₹27,900–₹46,600 |
| Fertilizer | ₹1,15,900 | 50–70% | ₹58,000–₹81,100 |
| Total | ₹2,09,000 | ₹85,900–₹1,27,700 |
That is roughly ₹86,000 to ₹1.28 lakh for one season, or about $890 to $1,320 at around ₹96 to the US dollar (October 2026). Per acre, it comes to about ₹7,100–₹10,600, or $74–$110.
Two things affect how much of this is cash in hand. The cost survey is from 2020–21, and fertilizer and labour prices have risen since, so today’s figure is likely a little higher. And Maharashtra has given free electricity to farm pumps of up to 7.5 HP since April 2024, so if his pump qualifies, part of the irrigation saving comes back as water and pumping hours rather than rupees. The fertilizer saving is money he did not have to spend either way.
Sugarcane yield outlook before the December harvest
The 17 October advisories put expected yield at 37 to 41 tonnes per acre across the five plots, against a local range of 32 to 48 tonnes per acre. All five plots are expected to be harvested in December 2026. These are model estimates from satellite data, not weighed tonnage. We will update this case study if Ruturaj shares the harvest figures.
What this means for sugarcane growers in Florida, Louisiana and Texas
In the United States, sugarcane is grown in Florida, Louisiana and Texas, and since the mid-2000s it has supplied 40 to 45 percent of the sugar produced in the country. The conditions differ from this farm. Florida’s cane is grown mostly near Lake Okeechobee, Louisiana’s mostly in the Delta and Texas’s in the Rio Grande Valley. The same weekly approach still applies:
- Water: match drip or furrow amounts to crop stage and skip days when the soil is already wet. The Kc values in FAO’s table give a starting point for any region.
- Nitrogen: LSU AgCenter’s rates range from 60–80 lb N per acre for plant cane on light soils to 100–120 lb for stubble on heavy soils. Satellite crop vigour maps help show which blocks need the top or bottom of that range.
- Phosphorus and potassium: follow your soil test, and skip blocks that test high.
- Before harvest: taper water so the crop builds sucrose, without severe stress on soils that hold little water.
Always follow your local extension service and the product label when you apply fertilizer.
How we built this case study
We pulled every advisory sent for the five plots from our records (202 documents, March to October 2026) and Ruturaj’s feedback form. For irrigation, we combined the seven-day plans so that each date used the newest advisory covering it. We then counted zero-water days and compared the total advised water with the same-dose daily routine described above. For fertilizer, we counted how many nutrient recommendations were zero, by month and by plot. To estimate money saved, we applied Ruturaj’s percentages to Maharashtra’s average sugarcane costs from India’s cost-of-cultivation survey. We checked the method against FAO, LSU AgCenter, UF/IFAS and South African Sugarcane Research Institute guidance. The plot names are replaced with numbers.
For the first part of Ruturaj’s story, read drip versus flood irrigation on his five cane blocks. For another grower’s results, see five small sugarcane fields with five different fertilizer answers.
Frequently asked questions about sugarcane irrigation scheduling
How often should sugarcane be irrigated?
It depends on crop stage, soil and weather. On this farm, the drip plans asked for water on roughly 5 to 7 days in 10 across the season. In wet monsoon weeks and during ripening, the plan watered only on alternate days or skipped whole days.
How much water does sugarcane need per day?
Daily use is reference evaporation multiplied by the crop coefficient. FAO gives sugarcane a Kc of 0.40 at the start, 1.25 at mid-season and 0.75 late in the season. On this farm, the advised drip amounts on watering days averaged about 6 mm per plot across the season, and 3.5 mm in mid-October.
What is the best irrigation method for sugarcane?
The advisories recommended drip on every plot, because drip puts water at the root zone with less loss. They also listed the furrow and alternate-furrow amounts for the same day, which were higher.
When should you stop irrigating sugarcane before harvest?
Many growers reduce water in the weeks before harvest, called drying off, to raise sucrose. South African sugarcane research notes that stress at this stage is beneficial and saves water. The right length depends on how much water your soil holds, so reduce gradually on light soils.
How can satellites help schedule irrigation?
Satellites measure canopy greenness (NDVI), leaf water (NDWI) and, with radar, soil moisture. Combined with crop stage and evaporation estimates, these show when a field needs water and when it can skip a day.
What is a good sugarcane fertilizer schedule?
Most nitrogen goes on early, during tillering and the start of grand growth. Phosphorus and potassium follow the soil test. On this farm, the advisories gave nutrients every week from March to May, then cut back as plots reached their ideal ranges, and stopped all nitrogen once the cane began ripening.
Can you skip fertilizer when soil nutrients are in range?
Yes. Both LSU AgCenter and UF/IFAS recommend no phosphorus or potassium when soil tests are high enough. On this farm, 27% of nutrient recommendations were zero for that reason.
Does too much nitrogen harm sugarcane?
It can. LSU AgCenter notes that rates above its recommendations may raise cane tonnage but reduce sugar per ton, and that excess nitrogen can increase brown rust.
Does this work on small farms?
Yes. The smallest plot in this case study is 0.39 acres, and each plot got its own plan, so even neighbouring plots received different fertilizer rates.
How much money can satellite advisories save a sugarcane farmer?
It depends on farm size and local costs. For Ruturaj’s 12 acres, applying his estimates to Maharashtra’s average irrigation and fertilizer costs gives about ₹86,000 to ₹1.28 lakh (roughly $890 to $1,320) for one season, most of it from fertilizer.
Are the savings in this case study measured?
The 30–50% and 50–70% figures are the grower’s own estimates. The skip-day figures (30% to 48% less water than a same-dose daily routine) come from the advisories themselves, not from a water meter.
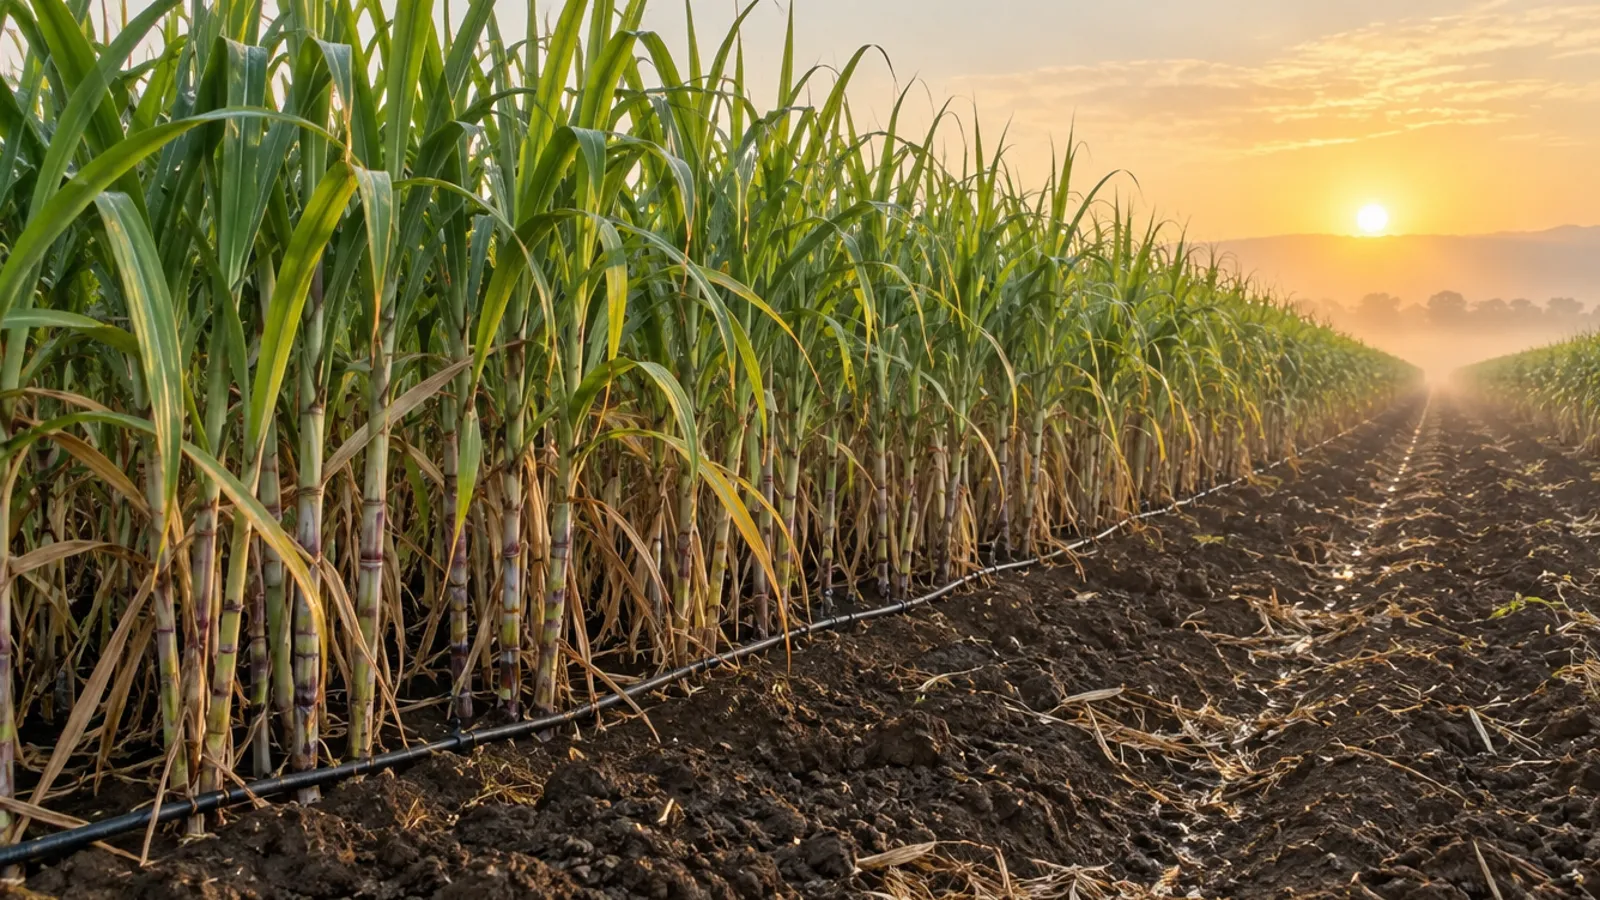
Fine print: reported percentages are the grower’s own estimates and were not metered. Rupee figures apply the grower’s estimates to state average costs and are not his actual bills. Water comparisons are against a modelled same-dose daily routine, not the farm’s past records. Yield figures are satellite-model estimates. Pest and disease scores in the advisories are modelled probabilities, not confirmed infestations. The hero image is an illustration.
Farmonaut crop monitoring
Get a weekly irrigation and fertilizer plan for your own cane
Draw your field once, and Farmonaut sends a satellite-based drip and nutrient plan for it every few days on web, Android or iOS.




Keep reading


Sources
- FAO, Crop Evapotranspiration (Irrigation and Drainage Paper 56), Table 12: single crop coefficients (1998): fao.org
- FAO, Irrigation and Drainage Paper 56, Chapter 3: Meteorological data, Hargreaves ETo equation (1998): fao.org
- LSU AgCenter, Sugarcane Soil Fertility Recommendations for 2026 (Publication 3828): lsuagcenter.com
- UF/IFAS, SS-AGR-228/SC028: Nutritional Requirements and Fertilizer Recommendations for Florida Sugarcane: ask.ifas.ufl.edu
- South African Sugarcane Research Institute, Information Sheet 5.2: Irrigation strategies for water limiting periods (2010): sasri.org.za
- USDA Economic Research Service, Sugar and Sweeteners: Background: ers.usda.gov
- Directorate of Economics and Statistics (via CEIC), Cost of Cultivation: Sugarcane, Maharashtra, operating costs per hectare (2020–21): ceicdata.com
- The Week (PTI), Maharashtra approves funds for free agri pump power supply scheme (Sept 2025): theweek.in
- European Space Agency, Sentinel-2 facts and figures: esa.int
- Copernicus SentiWiki, Sentinel-1 mission: sentiwiki.copernicus.eu
- NASA MODIS Science Team, Gao (1996): NDWI, a normalized difference water index for remote sensing of vegetation liquid water: modis.gsfc.nasa.gov
- European Space Agency, Sentinel-2 mission overview: esa.int
- Farmonaut advisory records for the five plots and the grower’s feedback form (March–October 2026): sat.farmonaut.com
Discussion
Questions, corrections or field experience? Share them below. First-time comments are reviewed before they appear, and your email is never published.
No comments yet. Be the first to add a question or your experience.

 Aerospect
 Delicio
 Payagri
 WB Dev
 Sama Premium
 Prochecker
 Tres Valles
 LACOS Geoinformation
 Pulsar Supernova
 Magrifly
 LatConnect 60
 WebsEdge
 Blickwinkel
 Agricultural Credit Policy Council
 Marei Nursery
 eKGIS
 Mostas Tech
 Andex
 FCF India
 Unifrutti Gulf
 Deluxe Conseil

 Licence holder · Niger · Gold
 Licence holder · Nigeria · Gold + lithium










