

Satellite Sugarcane Crop Advisory: Five Fields Under Three Acres, Five Different Answers

Rohit B Patil has five fields under satellite monitoring in Kolhapur district, Maharashtra. Together they come to 2.71 acres — the smallest holding in this series, averaging just over half an acre a field. Four of them sit inside a 115-metre circle. On the same week, the advisory asked for all five nutrients on one, two on another, and nothing at all on a third.
Two and seven-tenths acres, split five ways. On a holding this size the received wisdom is that precision agriculture has nothing to offer — the fields are too small, they are next to each other, and whatever you do you will do to all of them at once. This account is the clearest available test of that assumption, and the assumption loses.
The grower registered three sugarcane fields and two soybean fields and has received 26 advisories across seven satellite passes. He submitted feedback on 13 July 2026, against four of the five fields, and reported that the report helped optimise his fertiliser application — by an estimated up to 20% — and that it helped him take action on pest, disease or weed issues. This article follows those two threads.
Three of the fields are sugarcane, all at grand growth, all reading pH 6.5 and 0.11% organic carbon, and all within 115 metres of one another. The advisory prescribed all five nutrients on one, two of five on another, and nothing at all on the third — on which every nutrient came back at optimal level and every source line reads zero. Same crop, same stage, same soil reading, same week.
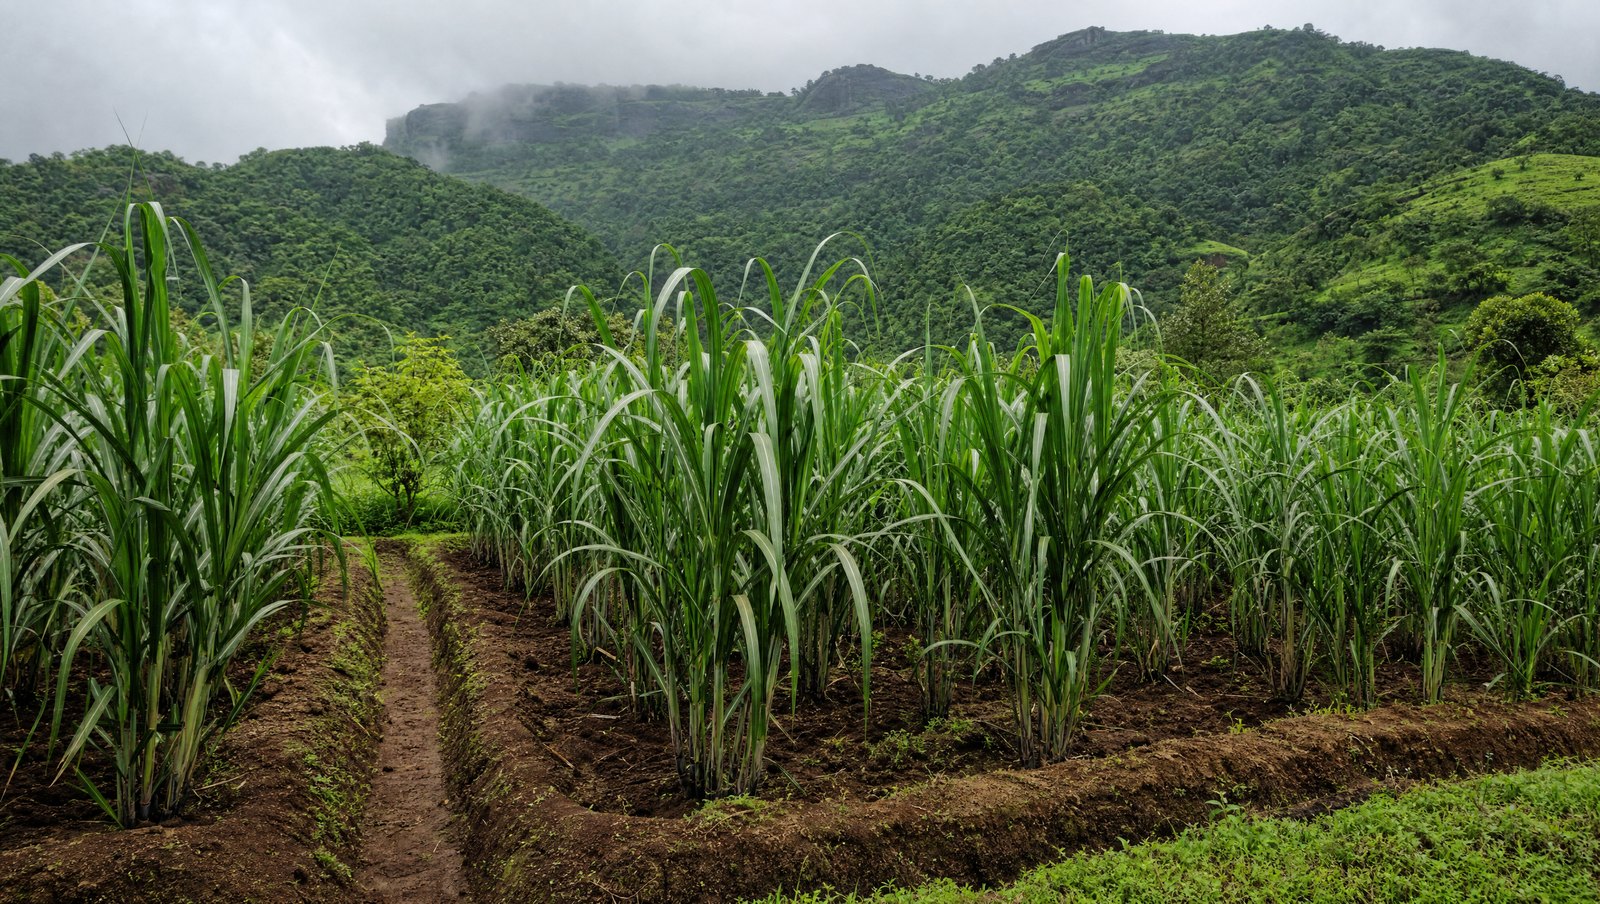

Five fields, half an acre each
The fields run from 0.76 acres down to 0.29. Four of them — all three sugarcane plots and the larger soybean field — are clustered within about 115 metres, close enough to walk between in under two minutes. The fifth, the 0.29-acre soybean plot, is a separate parcel roughly 13 kilometres away.
| Field | Acres | Sown | Stage | N | P | K | S | Zn | Harvest |
|---|---|---|---|---|---|---|---|---|---|
| Sugarcane | 0.49 | 7 Dec 2025 | Grand growth | 10.3 | 24.5 | 20.0 | 10.0 | 1.0 | Dec 26 – Mar 27 |
| Sugarcane | 0.65 | 31 Jan 2026 | Grand growth | 11.1 | 10.0 | 0 | 0 | 0 | Jan – Apr 2027 |
| Sugarcane | 0.51 | 30 Jan 2026 | Grand growth | 0 | 0 | 0 | 0 | 0 | Jan 2027 |
| Soybean | 0.76 | 27 Jun 2026 | Flowering R1–R2 | 0 | 4.8 | 15.3 | 1.4 | 0.1 | Oct 2026 |
| Soybean | 0.30 | 8 Jun 2026 | Beginning bloom | 22.0 | 11.0 | 30.0 | 11.0 | 1.0 | Oct 2026 |
| Portfolio — 2.71 acres | Nutrient counts: 5, 2, 0, 4 and 5 of five | 2 seasons | |||||||
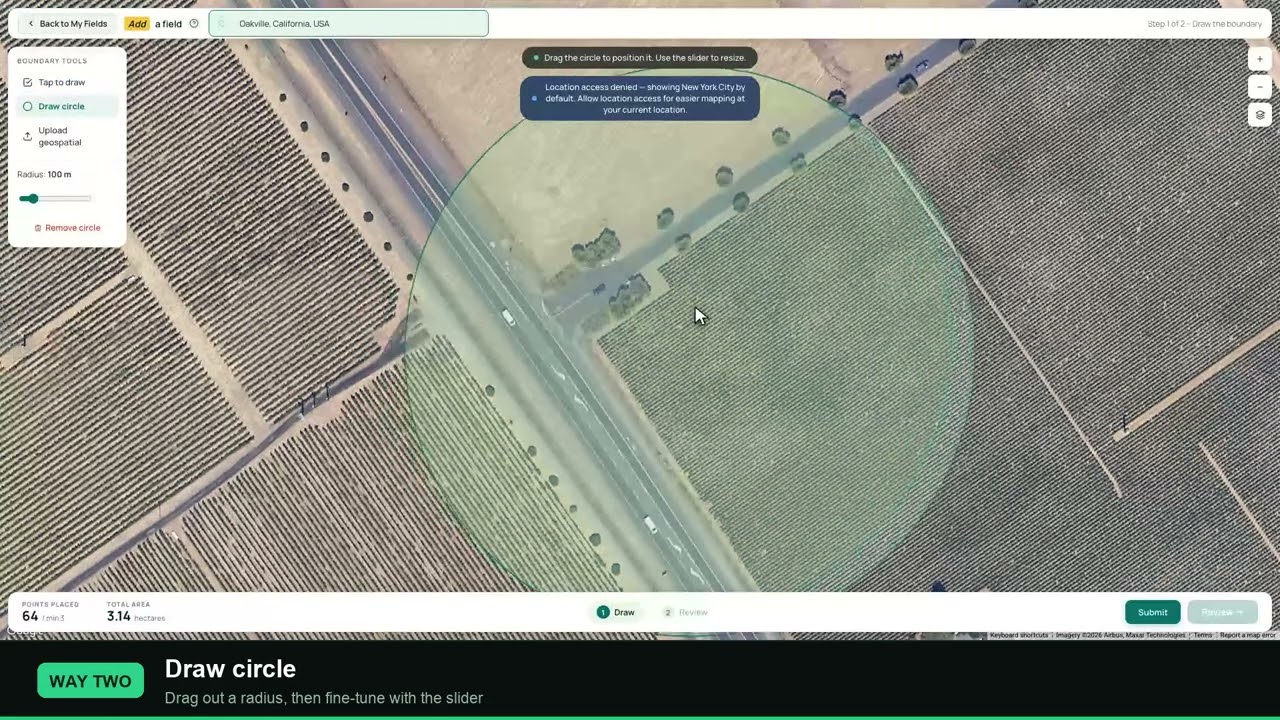
What the satellite sugarcane crop advisory delivers per field
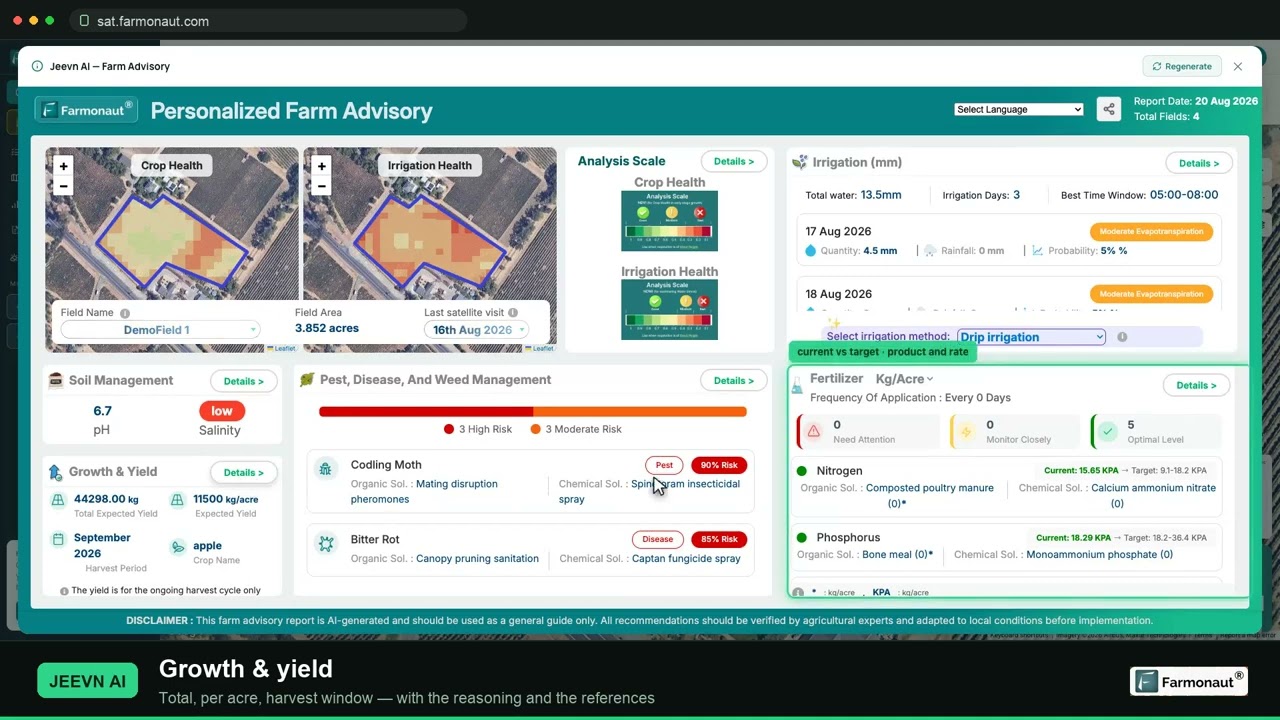
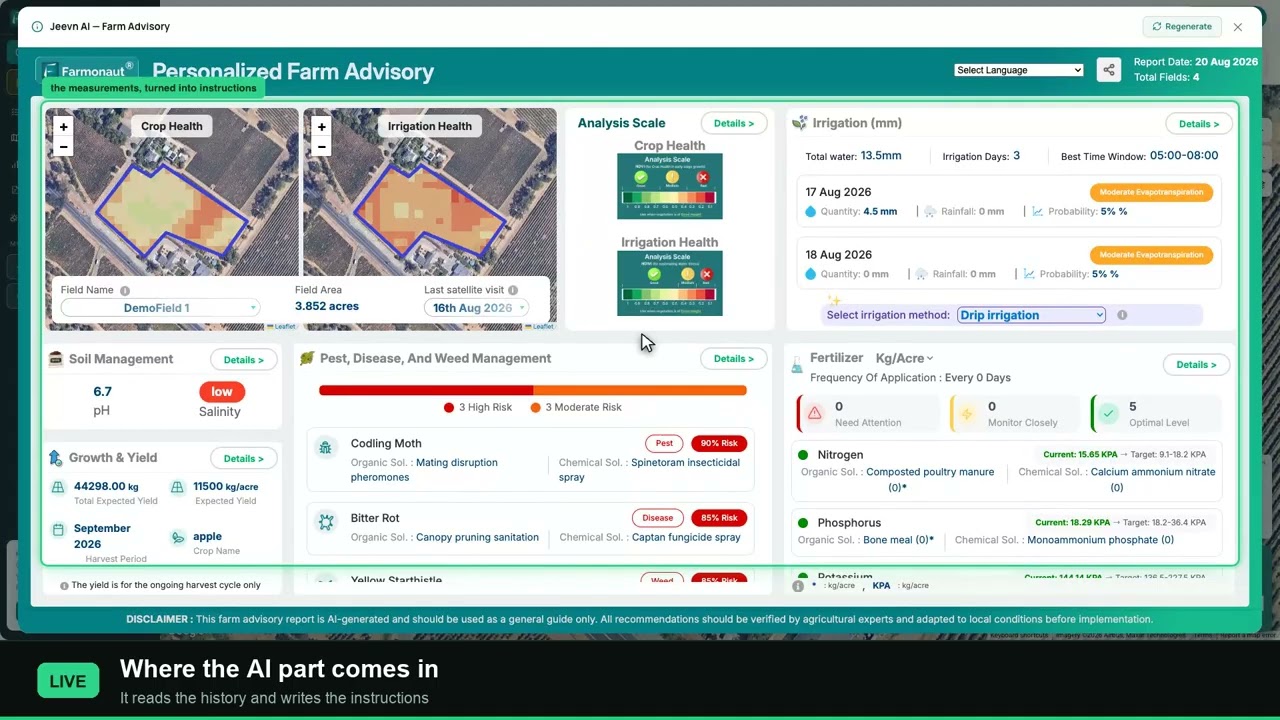
Each field receives its own report per satellite pass: per-nutrient fertiliser rates with an organic and a chemical source for each and an application frequency, pest and disease risk as percentage scores with paired organic and chemical solutions, weed pressure, soil chemistry, an irrigation schedule, and a yield estimate with a harvest window.
At this scale the fertiliser section is where the money is. Half an acre of sugarcane is a small area to fertilise, but the rate is per acre and the bag is bought whole — so the difference between “apply all five” and “apply none” on a 0.51-acre plot is a real decision about a real bag, not a rounding error.
Fertiliser: three sugarcane fields, three prescriptions
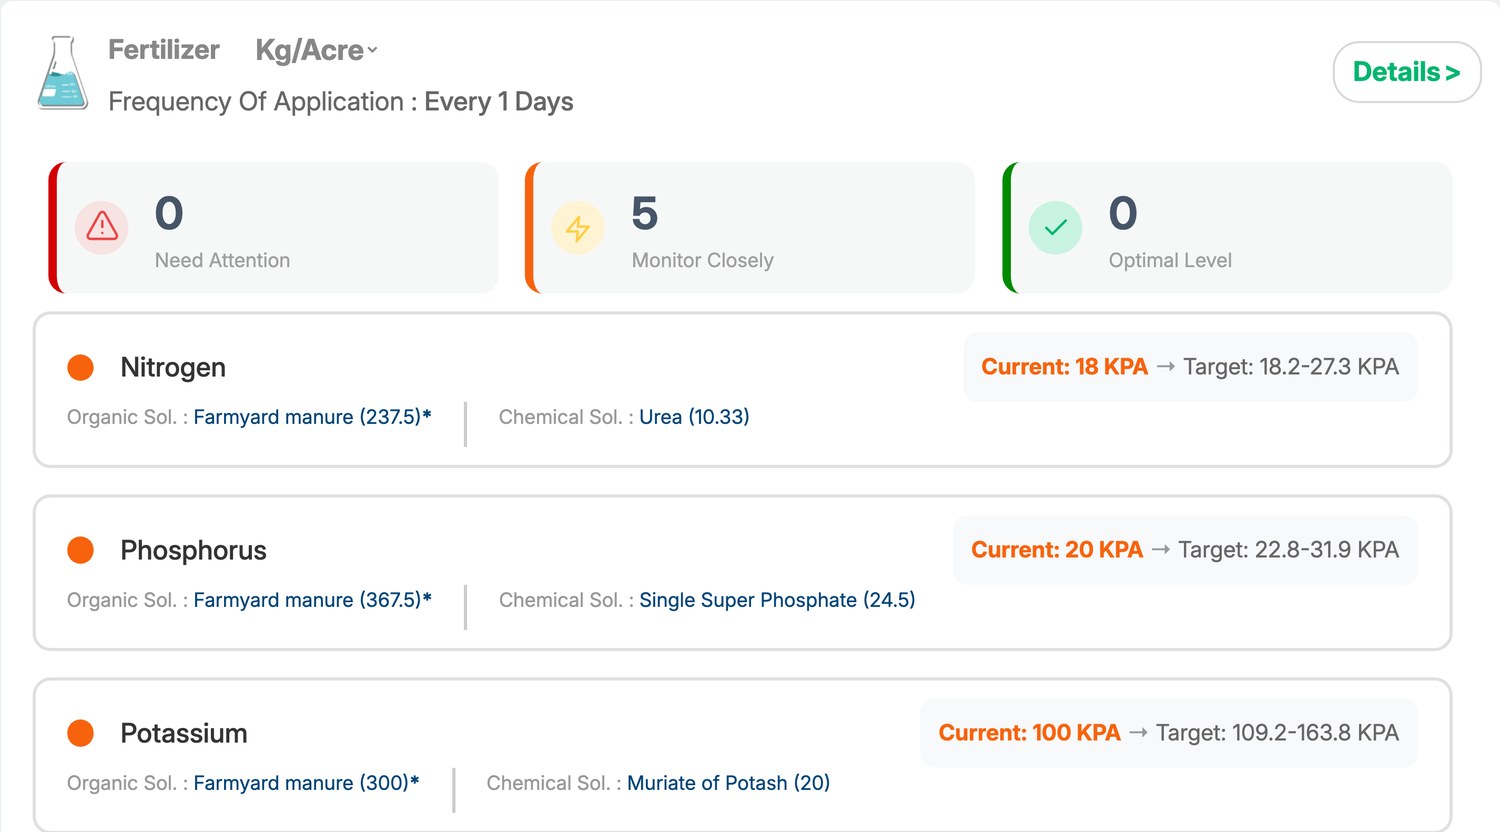
Start with the field that gets everything. The 0.49-acre plot, sown 7 December 2025 — the oldest cane on the holding — was prescribed all five nutrients: 10.3 kg/acre of nitrogen, 24.5 of phosphorus, 20.0 of potassium, 10.0 of sulphur and 1.0 of zinc, at a frequency of every one day. Phosphorus at 24.5 is the largest single figure on the holding.
Now the field that gets nothing. The 0.51-acre plot, sown 30 January 2026 — one day before its neighbour, same crop, same stage — returned five of five nutrients at optimal level. Not four. All five. The card reads 0 Need Attention, 0 Monitor Closely, 5 Optimal Level, and every organic and chemical source line on it reads (0).

Between them sits the 0.65-acre plot, sown 31 January: nitrogen at 11.1 and phosphorus at 10.0, and then potassium, sulphur and zinc all at zero — three of five withheld because those three readings were already where they needed to be.
On a holding of half-acre plots the temptation is to mix one tank and walk it round every field, because that is faster than mixing three. This account’s three sugarcane plots needed five, two and zero nutrients in the same week — so one tank means two of the three fields get the wrong thing, and one of them gets a full application it did not need at all.
The two soybean fields diverge the same way. The 0.76-acre field at flowering was prescribed almost nothing — nitrogen zero, phosphorus 4.8, potassium 15.3, sulphur 1.4, zinc 0.1 — the smallest doses anywhere in this series. The 0.30-acre field at beginning bloom, read three weeks earlier, carried three nutrients at high criticality and was prescribed 22.0 of nitrogen, 30.0 of potassium and 11.0 of sulphur.
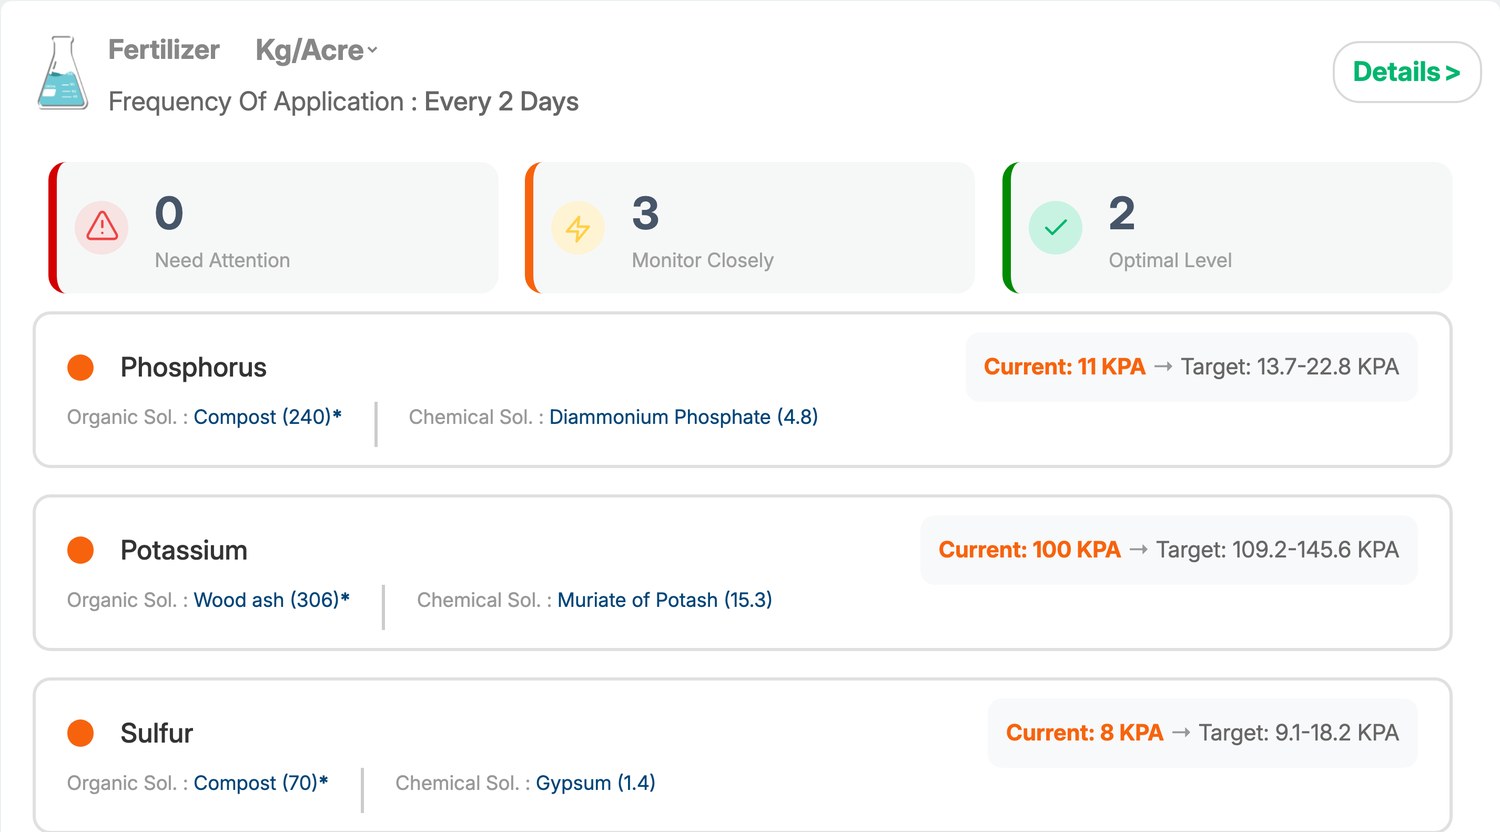
The card reads 0 Need Attention, 0 Monitor Closely, 5 Optimal Level. That is the platform telling a grower to spend nothing, and it is the line most likely to be overridden by habit.

Pest and disease: a virus at 95% and its vector at 90%
This is the other thing the grower credited, and the soybean field carries the sharpest example in the entire series.
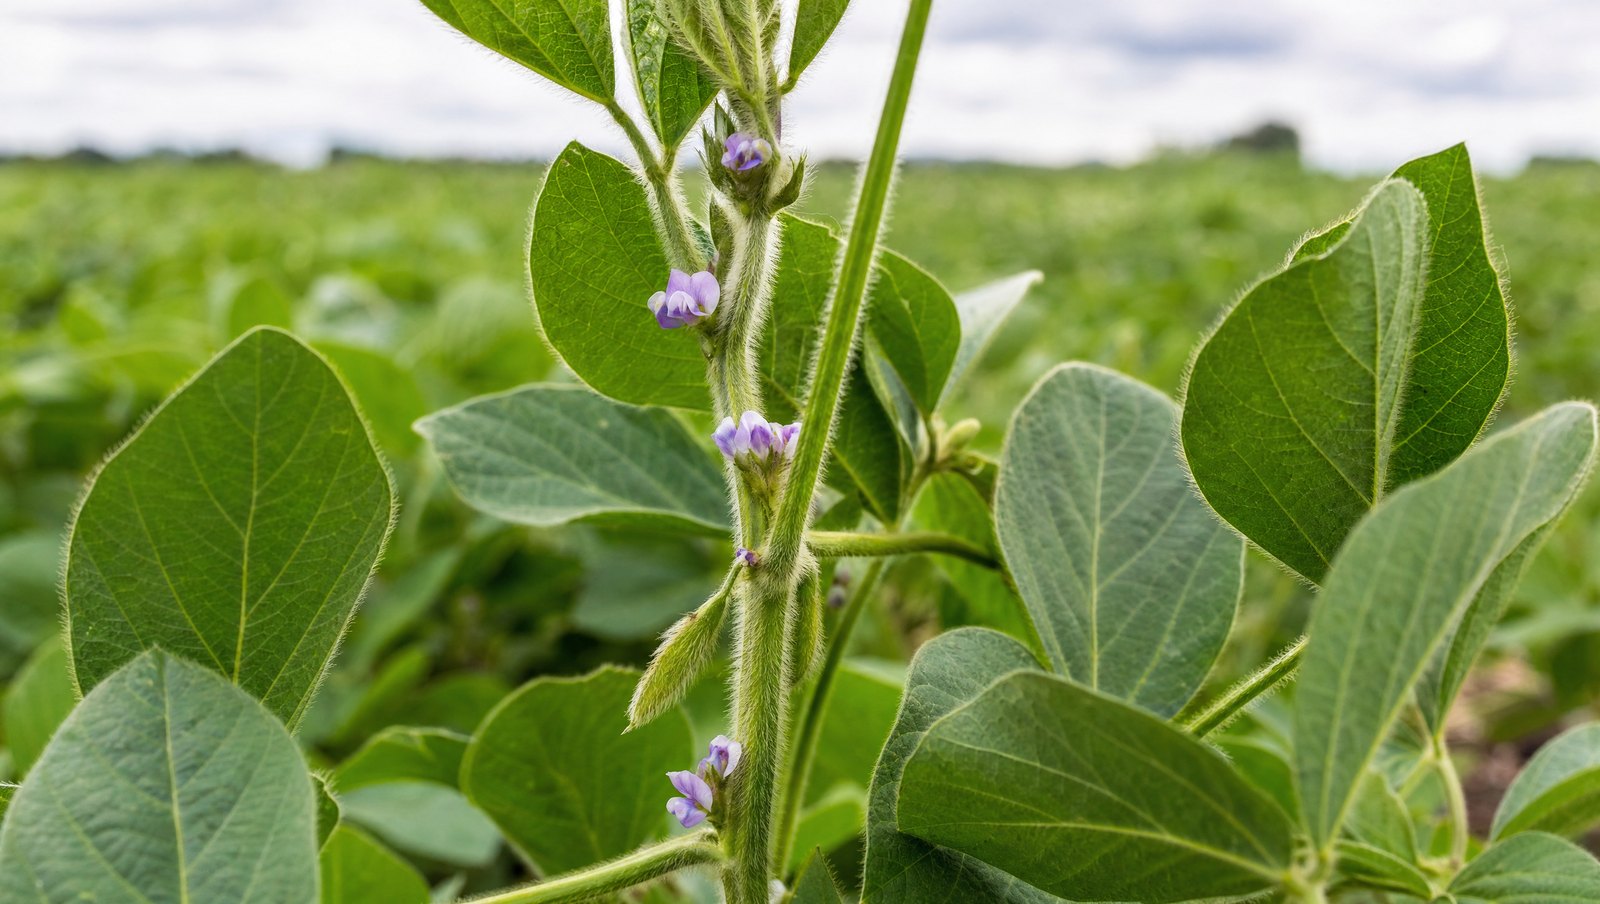
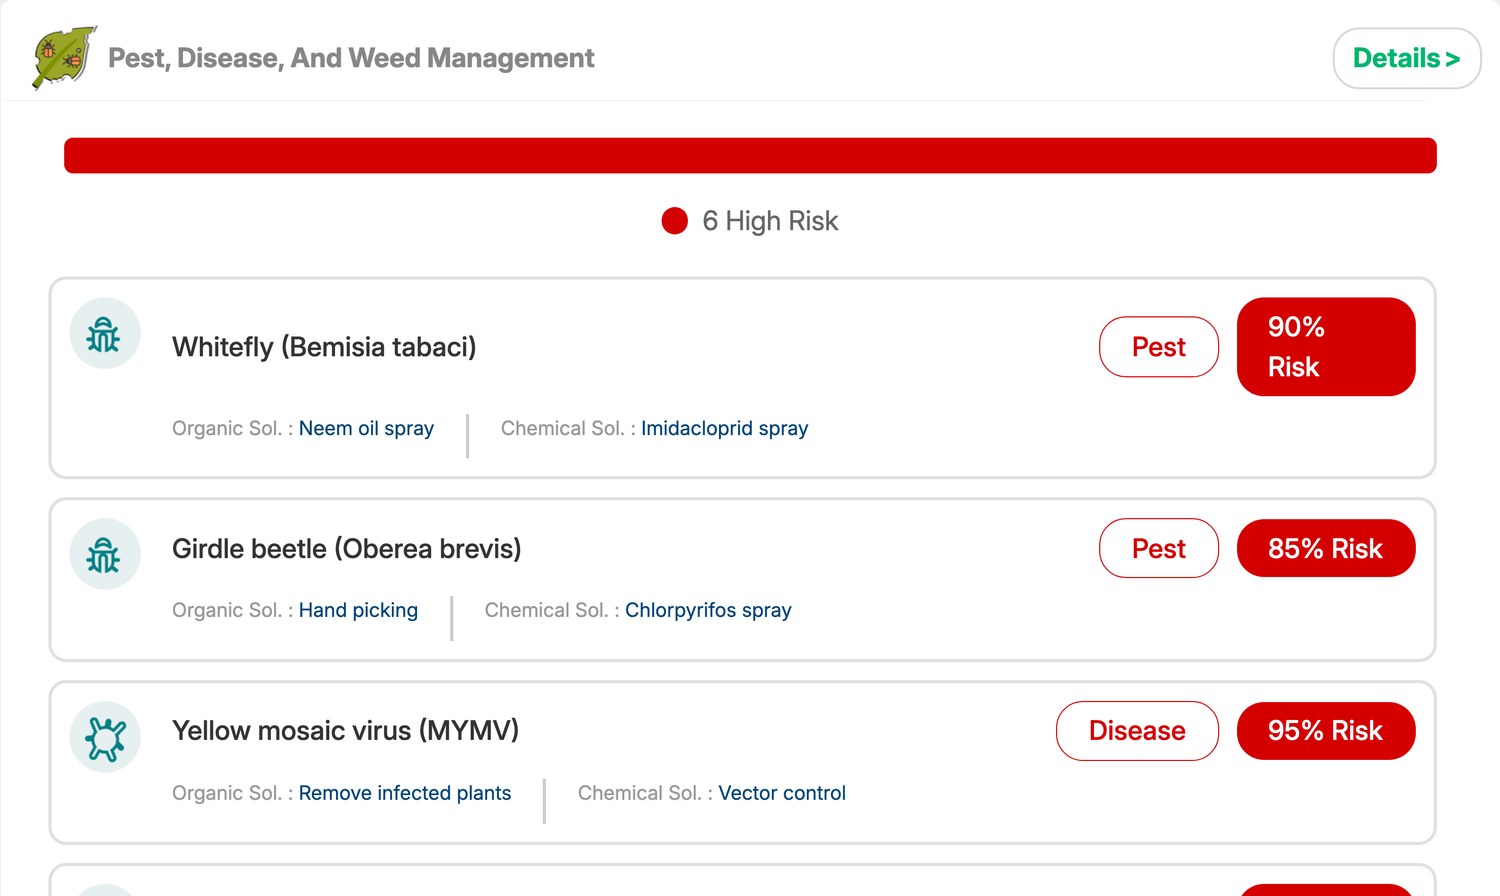
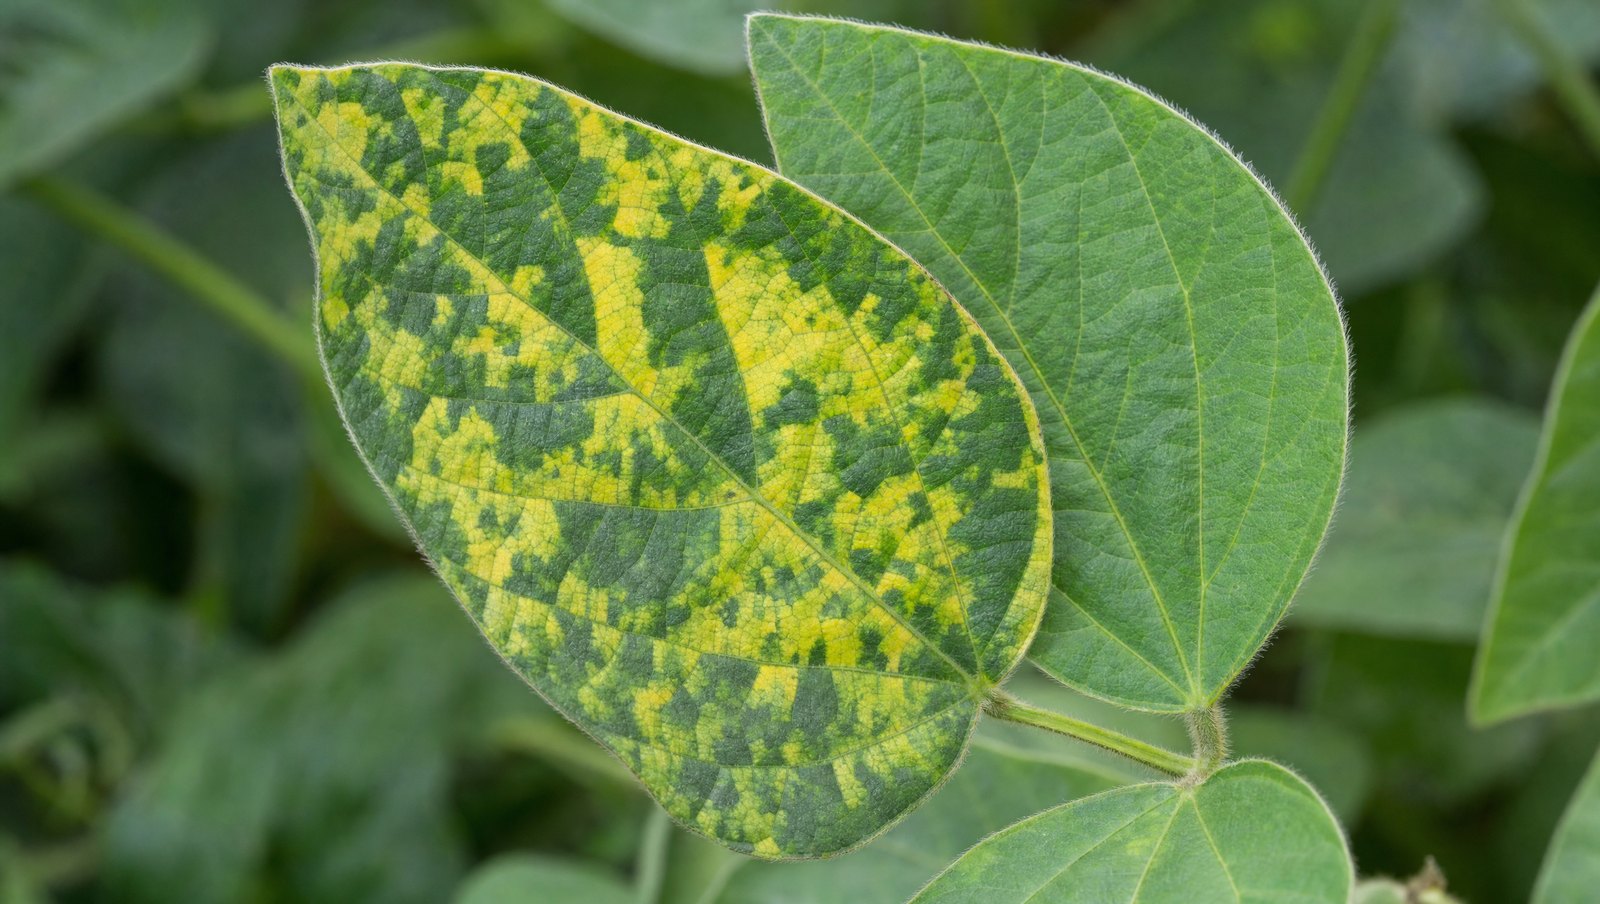
On the 0.76-acre soybean field the advisory raised yellow mosaic virus (MYMV) at 95% — the highest single score across every account in this series — and whitefly (Bemisia tabaci) at 90% directly beneath it. Those two entries are not independent: whitefly is the vector that transmits MYMV, and the virus cannot spread without it.
The stated solutions follow from that correctly. For the virus: remove infected plants as the organic route and vector control as the chemical route — not a spray aimed at the virus, which would do nothing. For the whitefly: neem oil, or imidacloprid. A model that scored the virus without scoring its vector would have produced a warning with no available action.
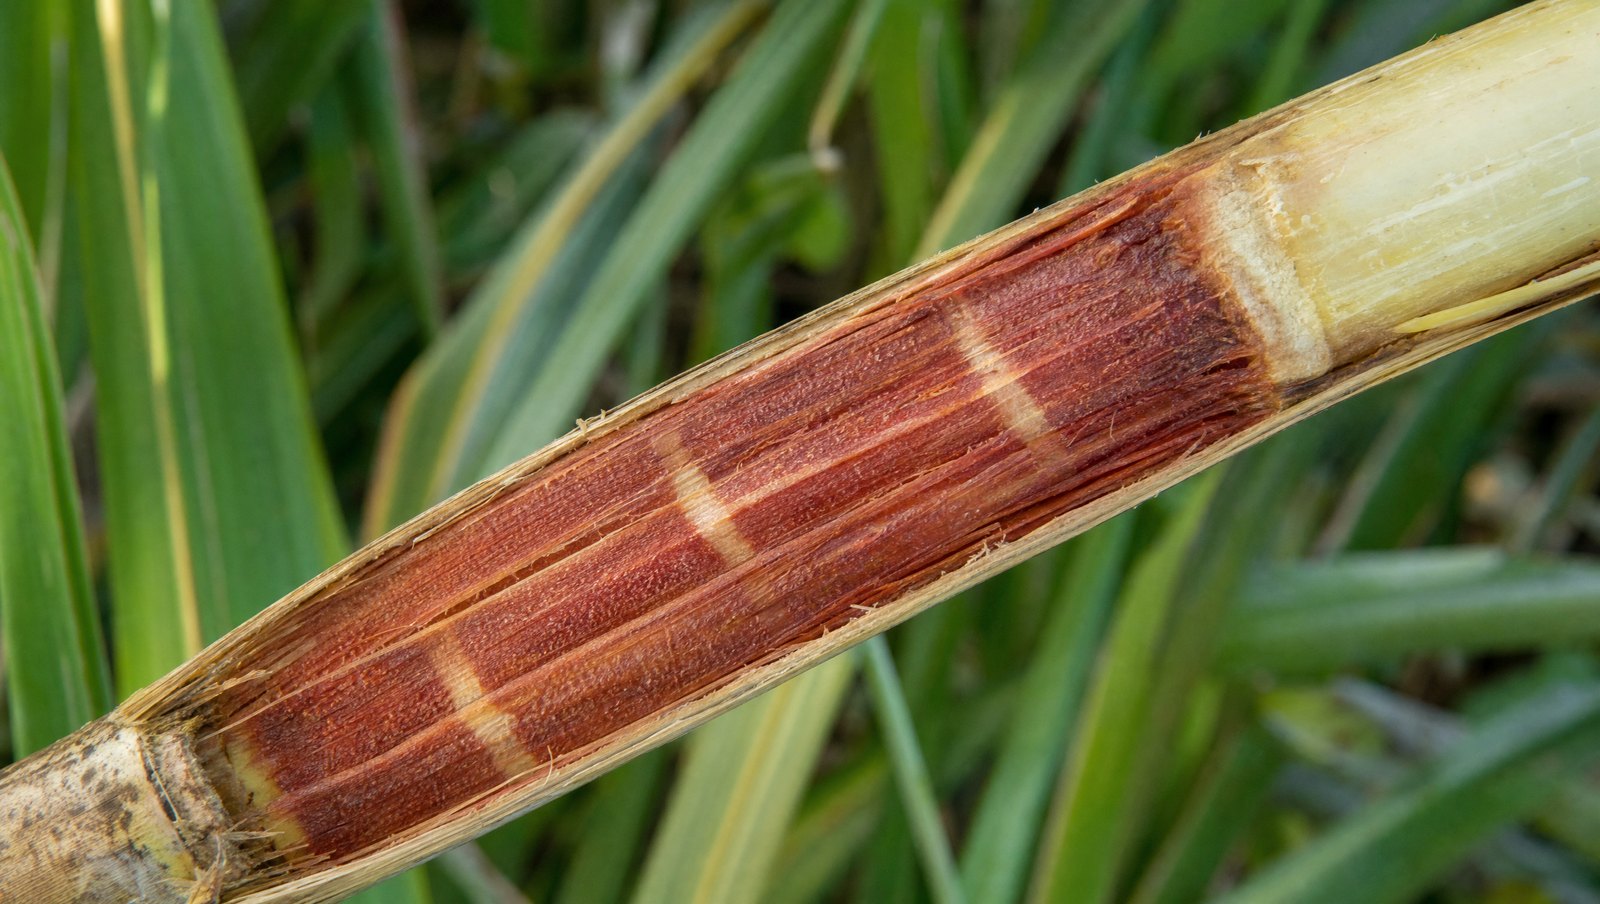
On the sugarcane the leading threat is red rot, scored at 90%, 90% and 95% across the three fields. Red rot is the disease that has historically forced whole variety replacements across the Indian cane belt; it rots the stalk internally and there is no rescue for an affected clump. The organic options named are a Trichoderma viride drench and, on the oldest field, resistant varieties — which is a planting decision rather than a spray, and the correct long-run answer.
The borer differs by field, and it differs correctly. The two fields sown in January carry top shoot borer at 90%; the oldest field, sown in December, carries internode borer at 90% instead. Top shoot borer attacks the growing point of younger cane; internode borer attacks the formed internodes of older cane. Two months of age difference between plots, and the advisory names a different insect.
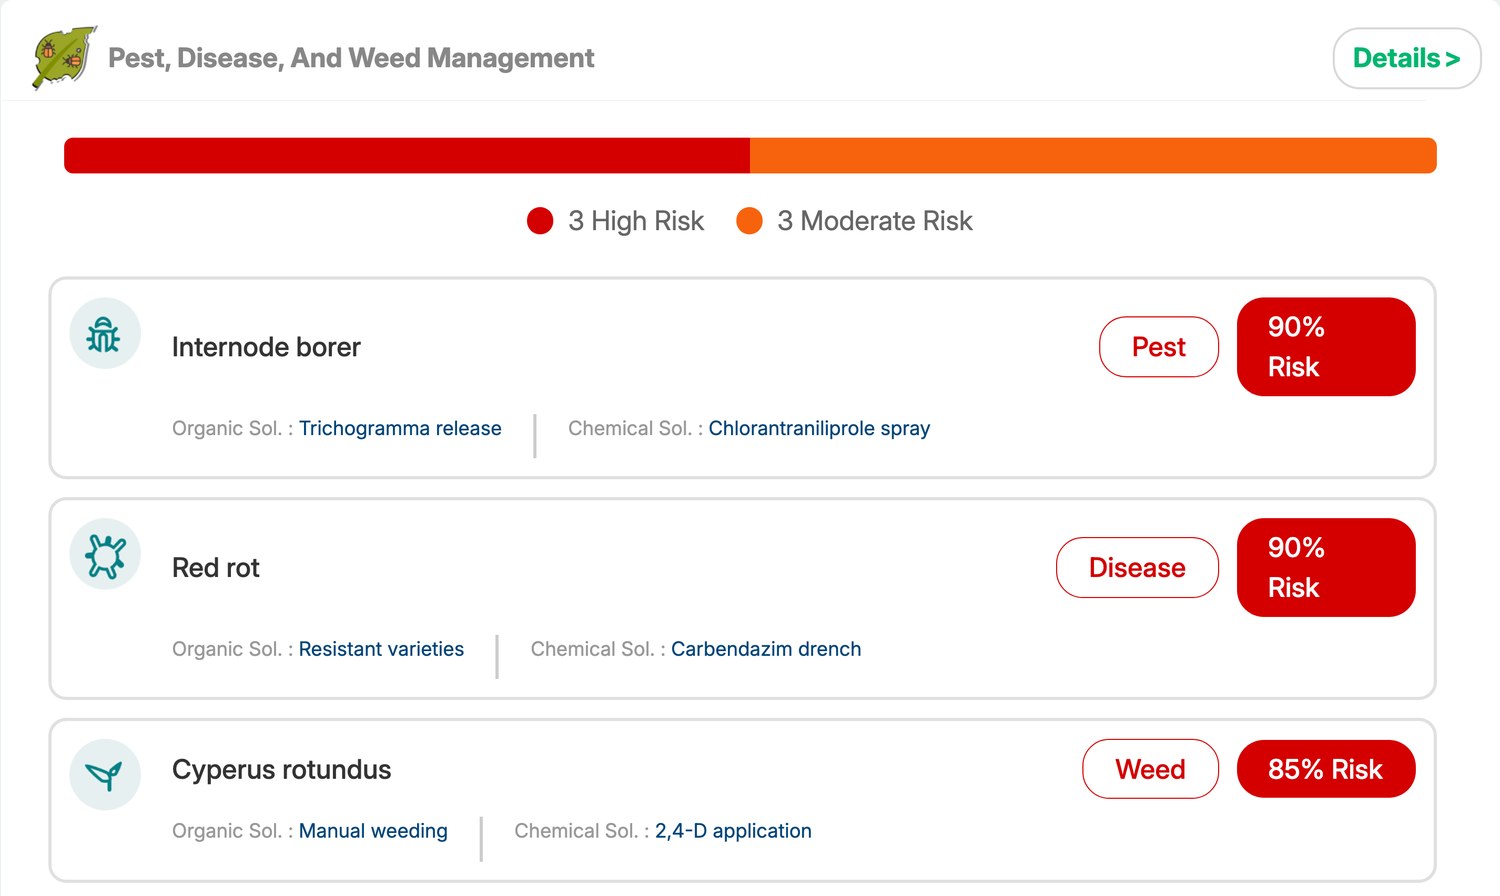
White grub sits behind the borers at 75–85% on all three cane fields, with Metarhizium anisopliae as the organic option. Weed pressure is uniform and regionally exact: Cyperus rotundus at 85% on every cane field and Echinochloa crus-galli at 70–80% behind it. The distant soybean plot carries Parthenium hysterophorus at 60% instead — a different parcel, a different weed flora.

What the numbers add up to
| Mechanism in the advisory | What it delivers on these five fields |
|---|---|
| Nutrient set per field, not per crop | 5, 2 and 0 nutrients across three sugarcane plots at the same stage |
| Optimal-level readings suppress the prescription | One 0.51-acre plot told to apply nothing at all |
| Both an organic and a chemical source named per nutrient | FYM quantities given beside urea, SSP, MOP, gypsum and zinc sulphate |
| Virus and vector scored together | MYMV 95% with whitefly 90%, and removal-plus-vector-control as the action |
| Borer resolved by plant age | Internode borer on December cane; top shoot borer on January cane |
| Biological controls named first | Trichogramma, Metarhizium and Trichoderma before any chemical |
Three cane plots inside 115 metres, at the same stage, on the same soil. Five nutrients, two nutrients, and none.
On a 2.71-acre holding the absolute rupee figures are small — but the fraction is not. Withholding a full five-nutrient application from one of three sugarcane plots is a third of that season’s cane fertiliser bill, and it requires no equipment, no conversion and no additional labour.
Grower-reported outcomes, as submitted
The cards below reproduce Rohit B Patil’s answers to our in-app feedback questionnaire for the advisory dated 13 July 2026, submitted against four of his five fields, exactly as recorded.
The percentage is the grower’s own estimate from a structured form rather than an invoiced figure. What the advisory data shows independently is that the fertiliser guidance was genuinely resolved to the field: across five plots the nutrient count prescribed was five, two, zero, four and five — which is not a pattern any farm-level plan could produce.
Why sub-acre fields still diverge
The obvious objection to all of this is that fields 50 metres apart on the same soil should not need different fertiliser, and that the divergence must be noise. Two things argue against that reading.
The first is cropping history. These are not three identical plots — they are three plots planted on different dates, from different seed cane, following different previous crops and different previous applications. The 0.51-acre plot that needs nothing is the plot that was most recently and most adequately fed; the 0.49-acre plot that needs everything has been carrying a crop since early December and has drawn its reserves down.
The second is the direction of the errors. The advisory’s differences line up with plant age and stage rather than scattering randomly: the oldest cane needs the most, the youngest-fed needs the least, the borer species tracks the age of the stalk, and the soybean read three weeks earlier in its cycle carries the high-criticality flags. Noise does not usually organise itself that neatly.
The soil readings are common ground and they are the shared constraint: pH 6.5 and organic carbon between 0.10% and 0.11%, flagged low on every field, salinity low throughout. In a high-rainfall Western Ghats monsoon, carbon that low means nutrients move quickly — which is the agronomic reason the fertigation frequencies on these fields are set at every one to three days rather than as single seasonal doses.
Kolhapur is a high-rainfall district where cane is grown on soils with very low organic carbon, and surplus nutrient does not stay in the profile — it moves. An unnecessary five-nutrient application on a plot already reading optimal is not a neutral cost; it is fertiliser leaving the field, which is the same money twice: once at the shop and once in the water.
Soil chemistry in these advisories is modelled from satellite indices and regional soil characteristics, not measured from a laboratory sample. It is best read as a per-field ranking and a direction of travel — which plot needs more and which needs less — with a laboratory test as the confirmation before a large application on a field you have not tested.

Why per-field beats per-farm on 2.71 acres
The yield estimates make the point about non-comparability at the smallest scale in this series: 28,000, 25,000 and 22,000 kg/acre across the three cane plots, and 300 and 420 kg/acre on the two soybean fields. Cane and soybean differ by two orders of magnitude — but note that the three cane plots differ from each other by 27%, on the same crop at the same stage within 115 metres.
The harvest dates diverge too: December 2026 to March 2027 on the oldest plot, January 2027 on one, January to April 2027 on another, and October 2026 for both soybean fields. Five fields, four harvest windows, 2.71 acres.
Underneath sits a per-pixel read of each field boundary, resolved through crop coefficients and regional pest models. Twenty-six advisories over seven acquisition dates on five sub-acre plots is roughly five reports per field — and the fields that most needed telling apart were the ones closest together.
Running this on your own smallholding
- Map each plot separately even at half an acre. Three cane plots inside 115 metres needed five, two and zero nutrients in the same week.
- Read the optimal-level count first. A card showing 5 Optimal Level and 0 Need Attention is the platform telling you to spend nothing — that is the highest-return line in the report.
- Record the real sowing date per plot. Two months of age difference changed which borer the advisory named and how much phosphorus it asked for.
- Score the vector, not just the disease. On soybean, yellow mosaic at 95% is only actionable because whitefly is scored at 90% beside it.
- Take the biological options seriously at this scale. Trichogramma release and Metarhizium are usually cheaper than the chemical route on half an acre, and they are named first for that reason.
Explore the platform at sat.farmonaut.com, read more about our satellite and AI-based farm advisory in the JEEVN AI overview, or talk to our team about monitoring a smallholding. JEEVN AI is a paid product; plan detail is on the platform.
Half an acre is still a field
Map each plot, set its crop, stage and sowing date, and get per-field nutrient and pest guidance from satellite passes over your own ground.
Frequently asked questions
What is a satellite sugarcane crop advisory and what does it deliver?
It is a per-field report built from satellite passes over your own boundary, giving per-nutrient fertiliser rates with an organic and a chemical source and an application frequency, pest and disease risk as percentage scores with paired solutions, weed pressure, soil chemistry, an irrigation schedule and a yield estimate with a harvest window. On this holding five sub-acre fields each received their own, producing 26 advisories over seven acquisition dates.
Is satellite monitoring worth it on under three acres?
On this holding it produced five different fertiliser answers where a farm-level plan would have produced one — including one 0.51-acre plot told to apply nothing at all. The absolute rupee figures are small at this scale, but withholding a full application from one of three cane plots is roughly a third of that crop’s fertiliser bill for the season.
How can two plots 50 metres apart need different fertiliser?
Because they carry different cropping histories. These three sugarcane plots were planted on different dates, from different seed cane, after different previous crops and applications. The plot prescribed nothing was the most recently and adequately fed; the plot prescribed all five nutrients has carried a crop since early December and has drawn its reserves down.
What does it mean when the card shows 5 Optimal Level?
That every one of the five nutrients came back at optimal level for that crop and stage, so nothing is prescribed — every organic and chemical source line on the card reads zero. It is the cheapest instruction the platform issues, and on this holding one field in five received it.
Why does the advisory name whitefly alongside yellow mosaic virus?
Because whitefly is the vector that transmits it. The advisory scored yellow mosaic virus at 95% and whitefly at 90% on the same soybean field, and its stated action for the virus is to remove infected plants and control the vector — not to spray the virus, which would achieve nothing. Scoring the disease without its vector would produce a warning with no available action.
Why do the three sugarcane fields get different borers?
Because the borers attack different parts of the plant at different ages. The two plots sown in January carry top shoot borer at 90% — it attacks the growing point of younger cane. The plot sown in December carries internode borer at 90% instead, which attacks the formed internodes of older cane. Two months of age difference between plots, and a different insect.
Is the soil chemistry in these advisories a laboratory result?
No — it is modelled from satellite indices together with regional soil characteristics, and is best read as a per-field ranking and a direction of travel rather than a substitute for a soil test. Before a large application on an untested field, confirm with a laboratory sample; the advisory’s strength is telling you which of your plots differ from each other, and by how much, every few days.
Glossary
- Grand growth
- The main stalk-elongation phase in sugarcane, when most of the cane’s length and weight is laid down. The stage all three cane plots were at, and the period of peak nutrient demand.
- Red rot
- A fungal disease that rots the internal tissue of the cane stalk, showing reddish discolouration with paler crosswise bands. There is no rescue for an affected clump, so management is preventive and variety-based.
- Yellow mosaic virus (MYMV)
- A whitefly-transmitted virus of soybean and other legumes that causes bright yellow mottling and severe yield loss. Not treatable once a plant is infected; managed by removing infected plants and controlling the vector.
- Trichogramma
- A tiny parasitic wasp released as a biological control against borer eggs in sugarcane. Named first in this advisory’s organic column, ahead of the chemical option.
- Optimal level
- The advisory’s verdict when a nutrient reading needs no correction for the current crop and stage. A card showing all five at optimal level prescribes nothing.
Case-study basis: JEEVN AI field advisories for a single Farmonaut account, taking each field’s most recent advisory as of the time of writing — three sugarcane fields and one soybean field from the satellite passes of 27 July and 1 August 2026, and a second soybean field from its latest available pass of 7 July 2026 — plus the account’s in-app feedback submission dated 13 July 2026, which was recorded against four of the five fields. Crops, region, field count and area are reported from the account’s own records on the platform; the account holder is named as recorded on his Farmonaut account and precise field locations are withheld. Distances between fields are computed from the field boundaries recorded on the platform. The reported percentage is the grower’s own estimate from a structured feedback form, not an invoiced measurement. All nutrient, pest, soil and yield figures are read directly from the advisories. Soil pH and organic carbon are modelled from satellite indices and regional soil characteristics rather than measured from laboratory samples. Pest, disease and weed percentages are modelled probabilities, not confirmed infestations. Yield figures are estimates, not guarantees. Imagery: the five platform screenshots are genuine captures of this account’s own advisory data; the five wider field photographs are AI-generated illustrative imagery, each labelled as such in its caption, and do not depict the grower or his fields. JEEVN AI is a paid product.
Discussion
Questions, corrections or field experience? Share them below. First-time comments are reviewed before they appear, and your email is never published.
No comments yet. Be the first to add a question or your experience.

 Kalustyan
 Tucor
Tucor Saraswati Agro
 Geno
Geno Hayleys Agriculture
 Linx Agritech
 Adinet
 Save Your Soils
 Grandstream Algérie
 XOS Realty
 Geospatial Lab Africa
 Agro La Gándara
 HIPSAC
 ZOL Zimbabwe
 Juligerm
 MISE Maroc
 NWNS
NWNS
