

Customer case study · Corn
Corn Harvest Timing From Satellite: An Illinois Case Study
On six northeastern Illinois corn fields, NDVI held near 0.82–0.90 into early September, then fell to 0.30 by 26 September and 0.20 by mid-October, the signal for maturity and drydown that set an October harvest window. The modelled yield stayed near 230 bushels per acre.
Key takeaways
- Seven corn fields, about 286 acres in northeastern Illinois and central Iowa, received 388 satellite advisories from May to October 2026.
- The Illinois canopy’s NDVI fell from 0.82 on 11 September to 0.30 on 26 September and 0.20 by mid-October, marking maturity and drydown.
- The advisories set an October harvest window, in line with Iowa State’s 2 to 4 weeks of field drydown from black layer to 15% moisture.
- Gibberella rot risk averaged 50% in September; tar spot and insect scores eased in October.
- 84.7% of planned field-days had no irrigation; July, at silking, got most of the planned water.
In this article
- The farm and the brief
- Why corn harvest timing matters in the Corn Belt
- How satellite monitoring tracks corn to harvest
- The season's NDVI curve, from emergence to harvest
- Reading corn harvest timing from the curve
- Disease and pest risk by stage
- Water: most days planned dry
- Nutrition, soil and the yield estimate
- What other corn growers can take from it
- FAQ
Corn harvest timing showed up clearly in the satellite data for seven Corn Belt fields this season. On six fields in northeastern Illinois, the crop-health index (NDVI) held at about 0.82 to 0.90 from early August to 11 September, then fell to about 0.30 by 26 September and 0.20 by mid-October. That drop marked the end of grain fill and the start of field drydown, and the advisories set an October harvest window. The modelled yield estimate stayed near 230 bushels per acre through September.
This is a follow-up. We first wrote about this grower in our corn yield calculator and satellite monitoring case study. This time we follow one full season, from emergence to harvest, through 388 satellite advisories sent between May and October 2026 to the six Illinois fields and one Iowa field. All figures come from the advisory records. Risk scores are modelled probabilities, not confirmed outbreaks. Water figures are planned amounts, not metered use. Yields are model estimates, not scale weights.
The farm and the brief
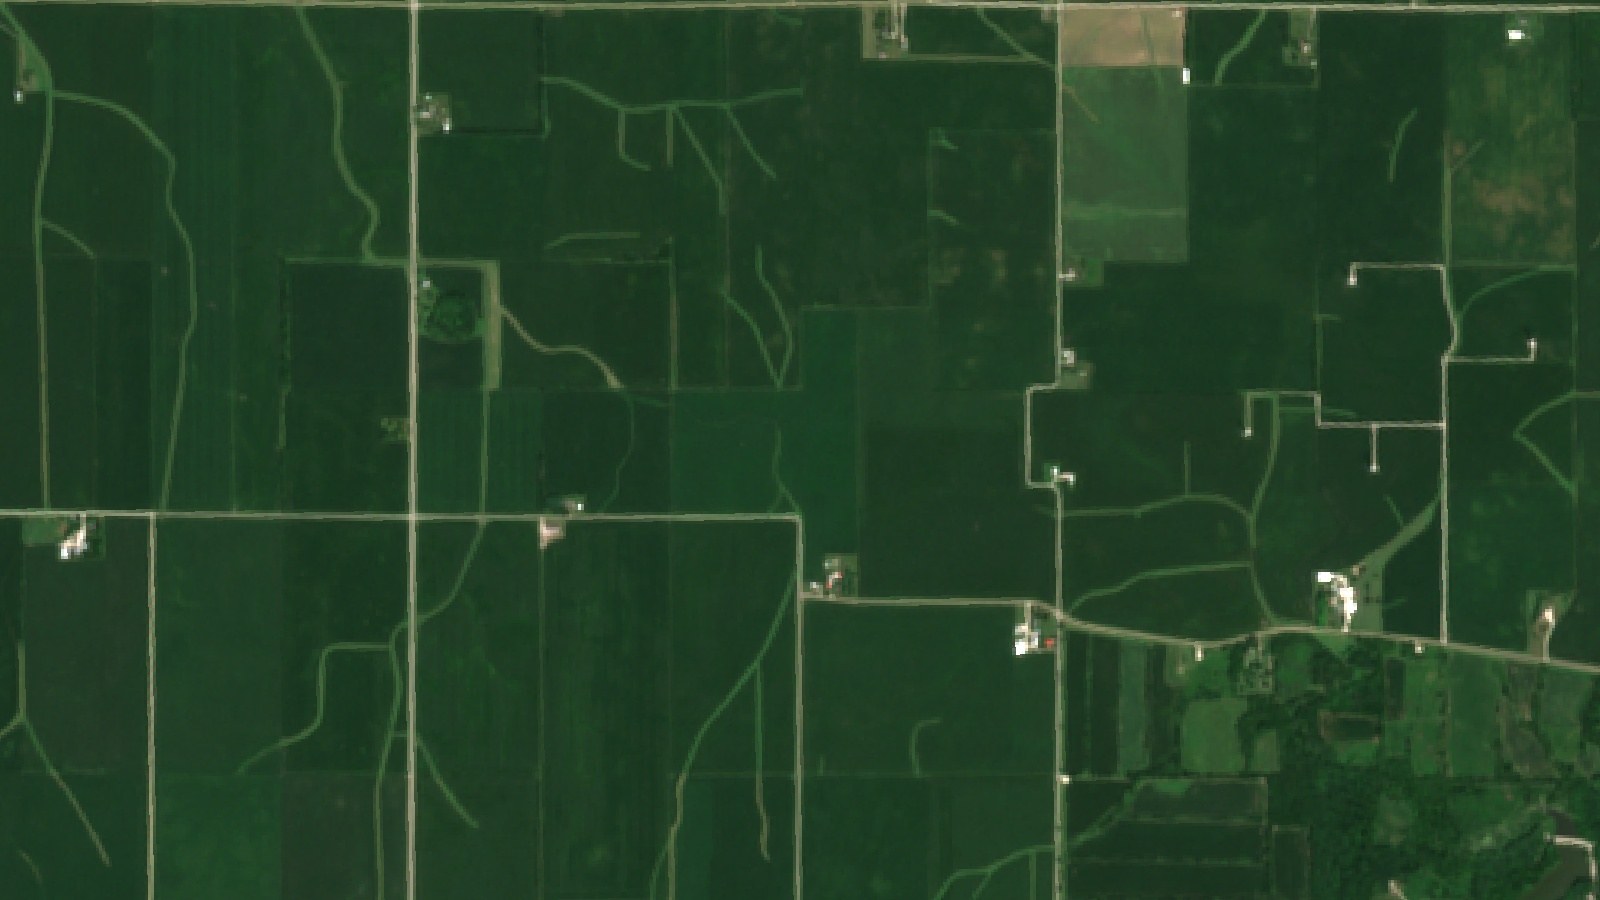
The Illinois grower farms six corn fields of about 31 to 52 acres each, about 251 acres (101 ha) in total, in northeastern Illinois. A second account adds one corn field of about 35 acres (14 ha) in central Iowa. Together that is about 286 acres (116 ha) of corn. Each field was drawn once in the Farmonaut app. The Illinois fields have received advisories every few days since June 2025, and the seven fields together have received 855 advisories so far.
Where the fields are
Illinois and Iowa shaded; markers show the approximate area only
The grower’s brief was simple. Watch every field without walking each one, know when the crop is safe to leave and when it is ready to cut, and get early warning of the ear and stalk rots that can make a late harvest costly. The same grower also runs an apple orchard in Ontario, but this case study covers only the corn.
| Item | Detail |
|---|---|
| Region | Northeastern Illinois and central Iowa, US Corn Belt |
| Crop | Field corn (grain) |
| Fields | 6 in Illinois, 1 in Iowa |
| Field sizes | About 31 to 52 acres each |
| Total area | About 286 acres (116 ha) |
| Season covered | May to October 2026 |
| Advisories | 388 in the season (349 Illinois, 39 Iowa) |
| Harvest window | October, as set by the advisories |
| Soil (modelled) | pH about 6.5, low salinity |
Why corn harvest timing matters in the Corn Belt
Illinois and Iowa grow more corn than any other states. In its Crop Production report of October 2026, USDA NASS forecast Iowa’s corn at 219 bushels per acre on 12.8 million harvested acres and Illinois at 208 bushels per acre on 10.95 million acres, against a national average of 181.2 bushels per acre. The 2025 final yields were 214 bushels per acre in Illinois and 210 in Iowa.
Chart
Corn yield forecast by state
Bushels per acre, selected Corn Belt states, forecast as of 1 October 2026
At those yields, a few days either side of the right harvest date add up. Harvest too early and the grain needs costly drying. Harvest too late and fields with poor stalk quality become more likely to lodge. Price matters too. NASS put the August 2026 price received for corn at $4.55 a bushel in Illinois and $4.44 in Iowa, and the October WASDE projected a season-average farm price of $4.70 for the 2026/27 crop. For state-by-state context, see our guide to average corn yield and farm income per acre by state, and our page on how much a bushel of corn is worth.

▶ How satellite and AI tools are used on corn fields across the United States · 11:16
How satellite monitoring tracks corn to harvest
Each advisory starts with fresh satellite images of the field. The Sentinel-2 satellites carry a camera with a revisit time of five days with its two satellites and 10-metre detail in the visible and near-infrared bands. From these bands the system works out NDVI, which compares red and near-infrared light reflected by the land surface to show how much green leaf is present. A full, green corn canopy reads high. A dry, senesced crop or bare stubble reads low.
Infographic
How each field advisory is built in 4 steps
- 1Satellite passSentinel-2 images each field every few days; Sentinel-1 radar covers cloudy dates.
- 2Read the canopyNDVI and moisture indices show how green and how wet the crop is, field by field.
- 3Add weather and stageThe weather outlook and growth stage set water need, disease risk and harvest month.
- 4Field planIrrigation, risk scores, nutrients with organic options, and a yield estimate.
When cloud hides a field, the system switches to radar. Sentinel-1 radar can image the ground by day or night, whatever the weather, so 106 of the 349 Illinois advisories this season came from radar passes on cloudy dates.
The images are combined with the weather outlook, the crop’s growth stage and the field’s soil model. The result is one advisory per field with five parts: an irrigation plan for the next week, pest and disease risk scores, weed risk, a fertilizer plan with organic options, and a yield estimate with an expected harvest month.
The season’s NDVI curve, from emergence to harvest
The Illinois fields greened up late in June. The median NDVI across the six fields was 0.20 on 18 June, 0.39 on 3 July and 0.65 on 13 July. It reached about 0.89 in August and held near that level into early September. On 6 September the median was 0.84, and on 11 September 0.82. By 26 September it had fallen to 0.30, then to 0.25 on 6 October and 0.20 from 13 October.
Chart
Crop-health index (NDVI) through the season
Median of six Illinois corn fields, 2026
The Iowa field ran a few weeks ahead. Its NDVI was already 0.68 by 19 June and peaked at 0.90 in mid-July. It read about 0.80 in early September, 0.27 on 2 October and 0.20 by 19 October.
The growth-stage labels in the advisories tracked the Illinois crop well through midsummer. We use only the dates where the labels fit the canopy.
| Dates | Stage or signal | What the advisories focused on |
|---|---|---|
| Early June | Emergence, early leaves (VE to V6) | Rootworm, cutworm and early weed risk |
| 3 to 5 July | V12 to V15 | Fast canopy growth, rising water need, nitrogen top-up |
| 8 to 13 July | Tasseling (VT) | Highest planned water of the season |
| By 18 July | Silking (R1) | Leaf disease watch: gray leaf spot, northern corn leaf blight |
| August | NDVI at its peak, about 0.89 | Grain fill, Gibberella and tar spot watch |
| Mid to late September | NDVI falls from 0.82 to 0.30 | Maturity and drydown, stalk-rot checks |
| October | NDVI about 0.20 | Harvest window, residue and weed plans |
▶ What NDVI values from −1 to +1 mean on a real field · 2:33
Reading corn harvest timing from the curve
The sharp fall in NDVI after 11 September is the key signal. It tells the grower the leaves are drying and grain fill is ending. The University of Wisconsin corn growth guide puts black layer, or physiological maturity (R6), about 50 to 60 days after silking (R1), when kernels reach their maximum dry weight at about 30 to 35% moisture. With silking by 18 July, that points to early to mid-September, the same window in which the satellite saw the canopy collapse.
Black layer is not harvest day. Iowa State University Extension says the black layer marks the end of dry matter accumulation, that corn at maturity holds about 30% moisture, and that ideal harvest moistures for field corn range from 15 to 20%. Drydown usually runs at 0.4 to 0.8% moisture loss per day, so it can take 2 to 4 weeks for grain to reach 15%. Two to four weeks after mid-September lands in October, which is exactly the harvest window the advisories set.
The satellite does not measure kernel moisture. What it gives is a reliable date for the start of drydown on every field at once. From that date, a grower can check kernels for black layer, take moisture samples on the fields that turned first, and use a tool such as the Iowa State Corn DryDown Calculator, which projects grain moisture 5 and 10 days ahead from local weather. The advisories for the three Illinois fields still being watched in late October showed NDVI flat at 0.20 to 0.21 from 11 to 21 October, which fits harvested or nearly harvested ground.
Disease and pest risk by stage
Across the season the advisories scored many threats. The ones scored most often were tar spot (282 times), corn earworm (278), European corn borer (260), western corn rootworm (185), Gibberella ear and stalk rot (168) and gray leaf spot (150). Each score is a modelled probability built from the field’s canopy, moisture and weather data. It tells the grower where and when to look first, not what is already in the field.
Gibberella ear and stalk rot
Gibberella was the main late-season disease concern. Its average score rose to 57% in August and stayed at 50% in September, while the grain was filling and drying. That is the period when stalk strength matters most. Purdue Extension suggests a push or pinch test on 20 plants in at least five random areas of a field, and if 10% or more of the stalks fail, considering the field for early harvest to avoid lodging. On these fields, the September NDVI drop gave the grower a date to start those checks. By October, with the crop mature, the score eased to 41% and the advisory shifted to residue management.
Tar spot
Tar spot is now a familiar disease in Illinois. A University of Illinois farmdoc daily article says the disease thrives in cool, humid weather with long spells of wet leaves, and puts Illinois yield losses from tar spot in 2024 at about 3%. The Crop Protection Network describes the signs as small, raised black spots on both sides of the leaf. On these fields the tar spot score averaged 52% in August and 44% in September, then fell to 26% in October as the leaves died back. The advisory gave both organic and conventional options. Always follow the product label and local rules.
European corn borer and corn earworm
Insect scores were steadier. European corn borer averaged 37% to 39% from July to September and corn earworm 43% to 50%. Late in the season the advisories pointed to residue. They noted that corn borer larvae overwinter in stalks, so shredding stalks after harvest was the organic option offered. The weed card added waterhemp and giant ragweed as the main risks for fall burndown and cover-crop planning.
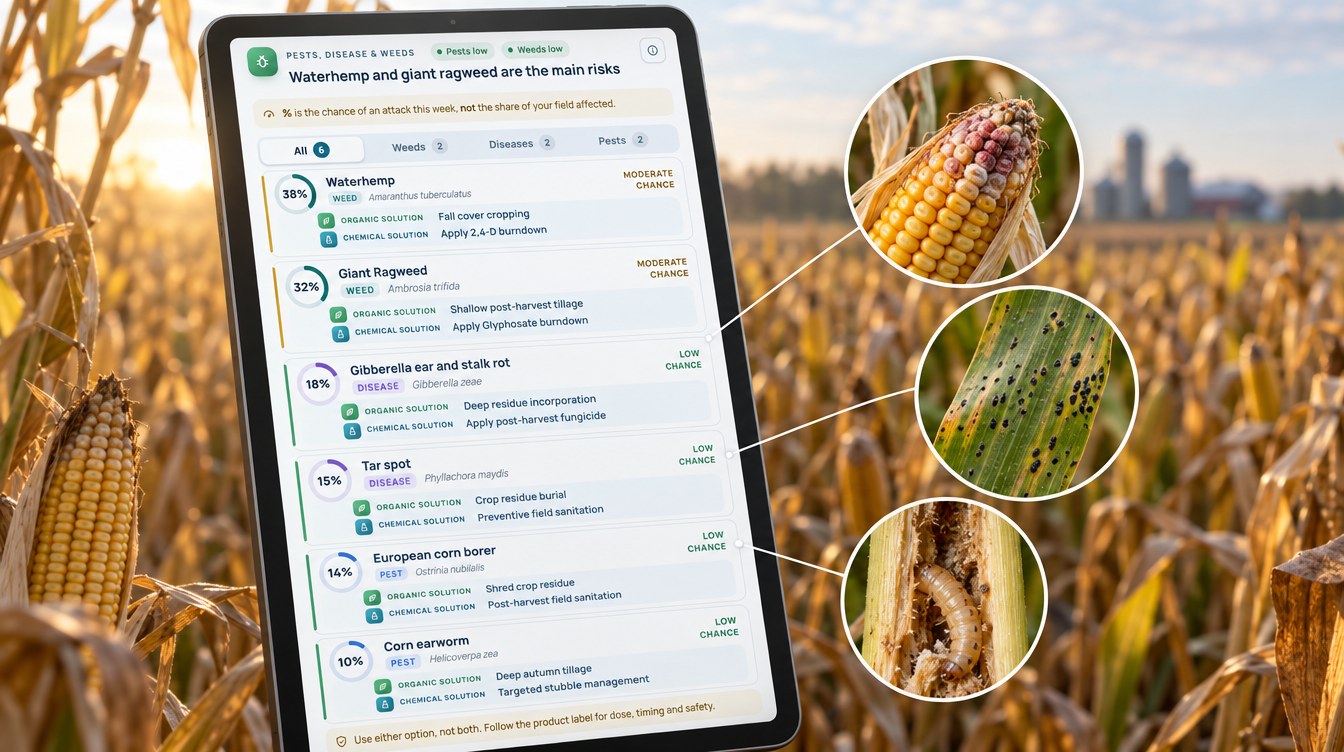
Chart
Modelled risk before and at harvest
Average risk score across the seven fields, %, 2026
Water: most days planned dry
The irrigation part of each advisory plans an amount for each of the next several days. When advisories overlapped, we kept the newest plan for each field and day. That left 1,149 field-days of planned irrigation from May to October. On 973 of them, or 84.7%, the advisory planned no water at all. The method it ranked first was a sprinkler or center pivot.
Chart
Rainfall vs planned irrigation by month
Inches per month; NOAA normal rainfall vs advisory plan per Illinois field, 2026
The plan followed the crop’s water curve. The planned amount was highest in July, at tasseling and silking, when the Illinois fields averaged 2.4 mm (about 0.09 in) a day and 61% of days were planned dry. In August 90% of days were dry, and from September onward every day was, because a maturing crop no longer needs water.
Rainfall explains much of the rest. NOAA’s 1991–2020 normals for Chicago O’Hare, a long-term weather station in northern Illinois, give 4.49 in (114 mm) of rain in May, 4.10 in June, 3.71 in July, 4.25 in August and 3.19 in September, about 19.7 in (501 mm) for May to September. The plan only asked for extra water around silking, when the crop’s demand is highest.
Planned water compared with a daily routine
To compare, we worked out what each field would have received if it had been given its own average watering dose on every planned day. Against that same-dose routine, the advisory plan used 75% to 96% less water per field, and about 84% less across all seven fields. Over the season each Illinois field’s plan came to about 4.0 to 7.6 inches (102 to 193 mm), and the Iowa field’s to under 1 inch. This is a comparison of plans, not a metered saving, but it shows how little extra water the crop needed outside silking this summer.
Chart
Share of days planned with no irrigation
Six Illinois fields, by month, %, 2026
Nutrition, soil and the yield estimate
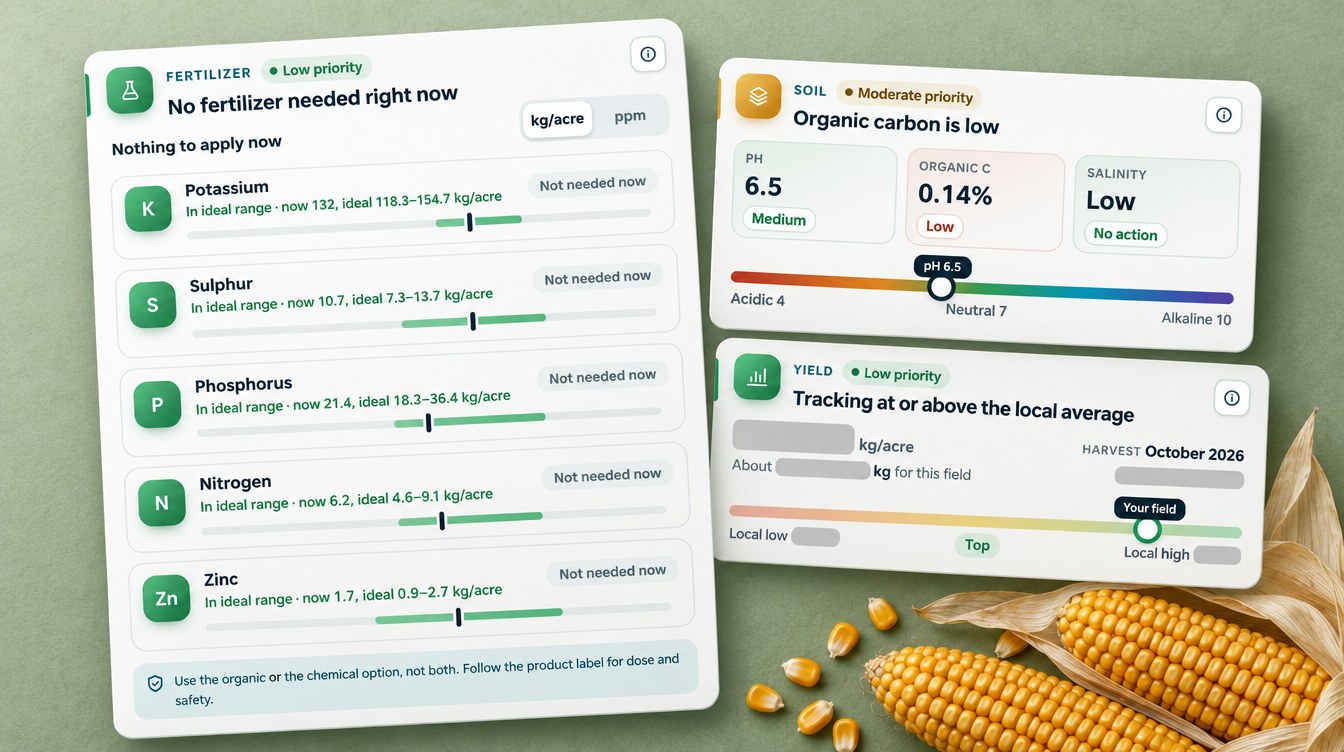
The fertilizer part of each advisory compares the field’s modelled nutrient levels with the ideal range for the current growth stage, then gives a rate for each nutrient that is short. In the season the advisories listed 1,940 nutrient lines, and every one came with an organic source as well as a conventional fertilizer. Only 98 lines asked for an actual application, and 73 of those fell in July, around the fast-growth and tasseling stages. From August the plan was simply “nothing to apply now”.
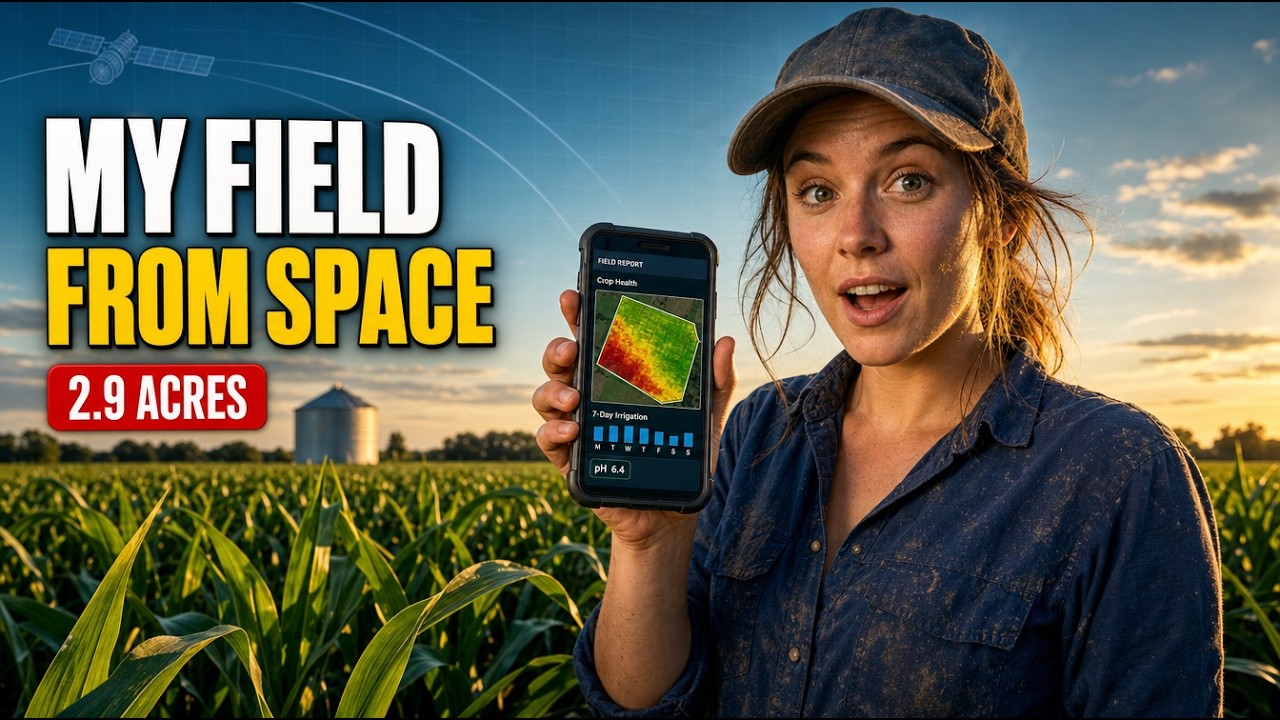
▶ How to read a satellite farm advisory, including the yield estimate · 9:13
The soil section rated the fields at about pH 6.5 with low salinity, and flagged organic carbon as low. That is a prompt to compare with a lab soil test, since the satellite reading is a model of the topsoil, not a sample.
The yield card is the part most growers ask about. From 1 September to 11 October, the Illinois estimates stayed between 5,600 and 6,200 kg per acre. At the standard of 56 pounds (25.4 kg) per bushel, that is about 220 to 244 bushels per acre, with a median near 230. The Iowa field’s estimates worked out at about 232 to 238 bushels per acre. These are modelled estimates set against a local band of about 170 to 250 bushels per acre, and they sit above the NASS state forecasts. Treat them as a guide for planning storage, trucking and marketing, and check them against your yield monitor.
What other corn growers can take from it
Three lessons stand out from this season.
- Use the NDVI drop as your harvest-planning date. On these fields the canopy fell from about 0.82 to 0.30 in two weeks in late September. That is the day to start kernel and moisture checks, not the day to cut.
- Rank fields for stalk checks. Fields that turn first and carry a high Gibberella score are the ones to push-test first and harvest first.
- Plan residue work with the risk scores. Corn borer, Gibberella and tar spot all carry over on residue. The October advisories turned the risk scores into a residue and rotation plan for next season.
If you farm corn yourself, the calculator below works out what your crop is worth at harvest, after drying, with your own acres, yield, price and moisture. You can then try the Farmonaut Satellite + AI Farm Monitoring System on your own fields.
Try the numbers for your own farm below.
Calculator
What is your corn crop worth at harvest after drying?
Enter your own acres, yield, price, harvest moisture, drying cost and other costs.
- Gross value of the crop: $90,000
- Drying cost: $3,600
- Return per acre: $64
- Break-even yield: 185.2 bu/acre
Example values only, not a benchmark or forecast. Yield is in standard bushels (56 lb at 15.5% moisture, South Dakota State University Extension); the 15.5% base is fixed in the formula. Drying cost is charged per bushel for each point of moisture above 15.5%; shrink is not included. For reference, USDA NASS put the August 2026 corn price received at $4.55 a bushel in Illinois. Drying and other costs are your own figures.
FAQ
Can satellites tell me when to harvest corn?
They can tell you when the crop starts to mature. NDVI falls sharply as the leaves dry down after grain fill. On these Illinois fields that drop came in mid to late September. You still need to check kernels for black layer and measure grain moisture before you harvest.
What NDVI value means corn is ready to harvest?
There is no single cut-off. In this case study a full canopy read about 0.82 to 0.90, mature and drying corn about 0.30, and harvested or nearly harvested fields about 0.20. The change over time matters more than any one value.
What moisture should corn be at harvest?
Iowa State University Extension puts ideal harvest moistures for field corn at 15 to 20%. Corn at black layer holds about 30% moisture and loses roughly 0.4 to 0.8% a day in the field, depending on the weather.
How accurate is a satellite corn yield estimate?
It is a model, not a measurement. In this case study the September estimates worked out at about 220 to 244 bushels per acre in Illinois. Use the estimate for planning and compare it with your yield monitor and scale tickets.
Does satellite monitoring work through cloud?
Yes, with radar. In this season 106 of the 349 Illinois advisories used Sentinel-1 radar images on dates when cloud blocked the optical camera.
Farmonaut corn monitoring
See when your corn turns, field by field
Draw your fields once, and Farmonaut sends a satellite-based irrigation, nutrient, risk and yield plan for each one every few days on web, Android or iOS.




Keep reading


Sources
- Farmonaut advisory records for six Illinois corn fields and one Iowa corn field (2025–2026): sat.farmonaut.com
- USDA NASS, Crop Production, October 2026: release.nass.usda.gov
- USDA NASS, Agricultural Prices, September 2026 (August prices): release.nass.usda.gov
- USDA, World Agricultural Supply and Demand Estimates (WASDE-676), October 2026: usda.gov
- NOAA NCEI, U.S. Climate Normals 1991–2020, Chicago O’Hare Intl Airport (USW00094846): ncei.noaa.gov
- Iowa State University Extension, How fast can corn dry down?: crops.extension.iastate.edu
- Iowa State University Extension, The Corn DryDown Calculator: a tool to guide harvest timing: crops.extension.iastate.edu
- University of Wisconsin, Corn growth and development poster (J. Lauer): corn.agronomy.wisc.edu
- Purdue Extension, Identify stalk and ear rots now to prioritize harvest decisions (2025): extension.purdue.edu
- University of Illinois farmdoc daily, Tar spot on the move in Illinois (2025): farmdocdaily.illinois.edu
- Crop Protection Network, Tar spot of corn: cropprotectionnetwork.org
- South Dakota State University Extension, Understanding corn moisture content, shrinkage and drying: extension.sdstate.edu
- ESA, Sentinel-2 facts and figures: esa.int
- Copernicus SentiWiki, Sentinel-1 mission: sentiwiki.copernicus.eu
- NASA Earth Observatory, Measuring vegetation (NDVI and EVI): science.nasa.gov
Discussion
Questions, corrections or field experience? Share them below. First-time comments are reviewed before they appear, and your email is never published.
No comments yet. Be the first to add a question or your experience.

 XOS Realty
 Geospatial Lab Africa
 KhetiBuddy
 Agro La Gándara
 Global Agrifood
 HIPSAC
 ZOL Zimbabwe
 Juligerm
 AdBio
 MISE Maroc
 NWNS
 Red August Group
 Farm Inc
 WeMe Global
 Agrotoken
 Blue BearX
 Insignito
 Croptimum
 DnCubed
 Field Capacity
 Indosistim Teknologi

 Licence holder · Niger · Gold
 Licence holder · Nigeria · Gold + lithium










