

Customer case study · Wine grapes
Satellite Vineyard Monitoring: A Victoria Pinot Case Study
Satellite vineyard monitoring planned no water on 49.5% of block-days across six Pinot Noir blocks in central Victoria, about half the water of a same-dose daily routine, and tracked mildew, botrytis and moth risk stage by stage.
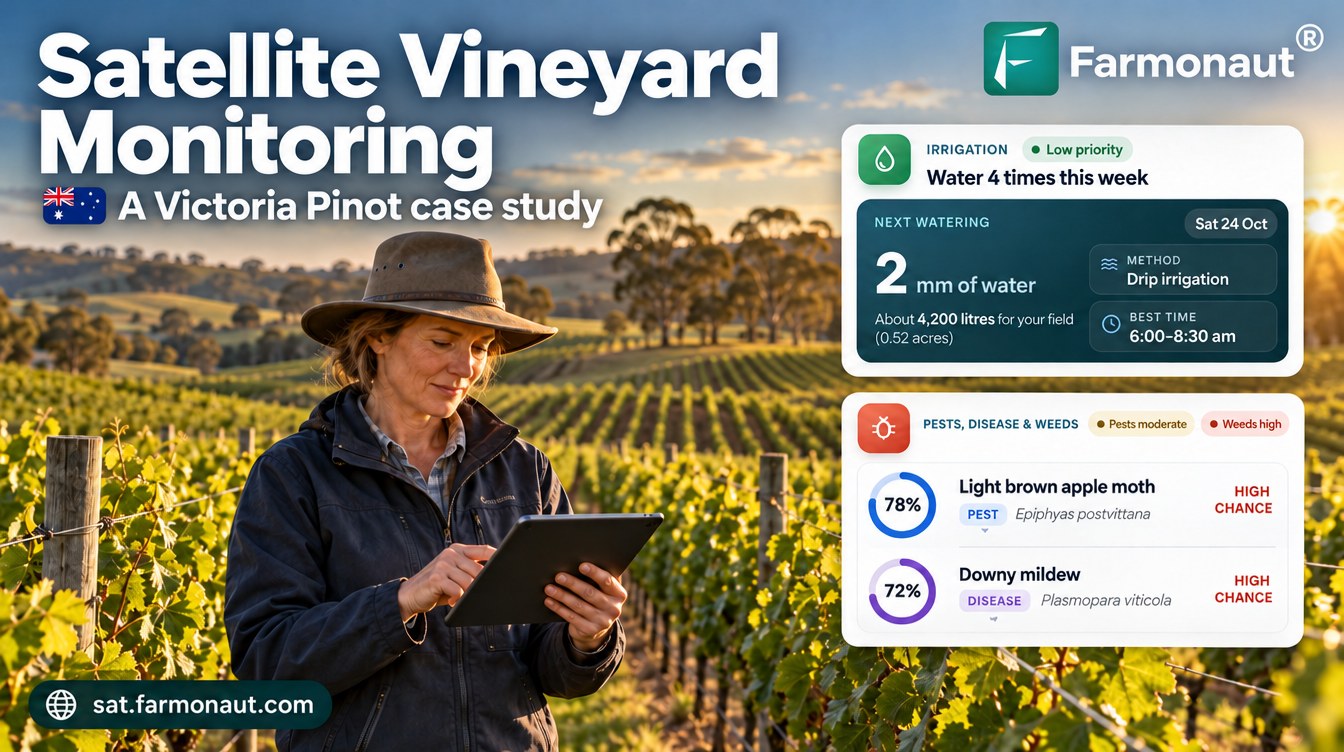
Key takeaways
- A cool-climate grower in central Victoria received 781 satellite advisories for six wine-grape blocks (12.2 acres) from January 2025 to October 2026.
- In the 2025–26 season, 897 of 1,812 planned block-days (49.5%) had no irrigation, about 50% less water than a same-dose daily routine.
- Powdery mildew risk averaged 95% at fruit set in January; botrytis peaked at 96% at harvest in March.
- Every one of 1,965 nutrient recommendations included an organic source option.
- Radar images kept advisories coming on 16 cloudy dates.
In this article
- The vineyard and the brief
- Why cool-climate Victorian Pinot is worth protecting
- How satellite vineyard monitoring works on these blocks
- A full season in advisories
- Disease and pest risk through the season
- Water: half the days planned dry
- Nutrition and soil
- Spring on more Australian vineyards
- What other vineyard managers can take from it
- FAQ
Satellite vineyard monitoring gave a cool-climate Pinot Noir grower in central Victoria a fresh irrigation plan, a disease-risk score and a nutrient plan for each of six blocks every few days. Across the 2025–26 season the advisories planned no water on 49.5% of block-days, which cut the planned water by about half compared with giving the same dose every day. Risk scores for powdery mildew, downy mildew, botrytis and light brown apple moth rose and fell with the vines’ growth stages.
This case study walks through 781 advisories sent to the grower from January 2025 to October 2026. It shows what the satellite saw, what each advisory recommended, and how other vineyard managers can use the same data. All figures come from the grower’s advisory records. Risk scores are modelled probabilities, not confirmed outbreaks, and the water figures are planned amounts, not metered use.
The vineyard and the brief
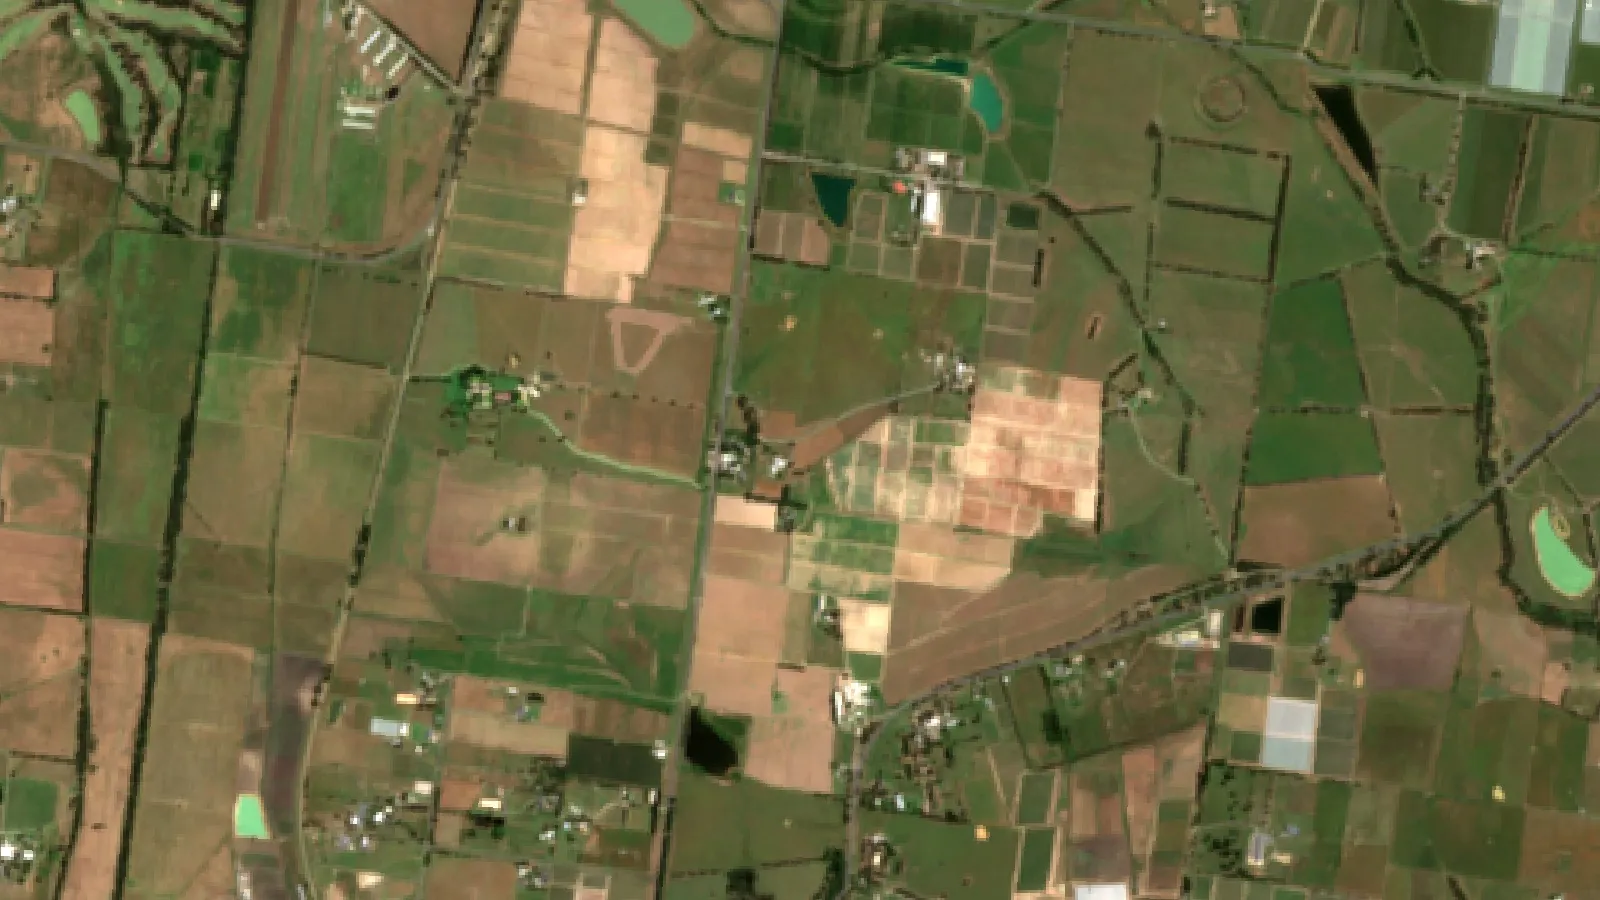
The grower farms six small blocks of wine grapes, mostly Pinot Noir, on cool, elevated country in central Victoria. The blocks range from about 0.2 to 2.4 hectares (0.5 to 6 acres) and add up to about 4.9 hectares (12.2 acres). Each block was drawn once in the Farmonaut app in January 2025, and the advisories have arrived every few days since then.
Where the vineyard is
Victoria shaded; marker shows the approximate area only
Small blocks in a cool region bring a particular set of jobs. Spring and early summer bring disease pressure. A thin-skinned variety like Pinot Noir is sensitive to bunch rot. Water needs swing widely between a dry summer and a wet winter. The grower wanted one place to see crop vigour, irrigation needs and pest and disease risk for every block without walking each row first.
| Item | Detail |
|---|---|
| Region | Central Victoria, Australia (cool climate) |
| Crop | Wine grapes, mainly Pinot Noir |
| Blocks | 6 blocks, about 4.9 ha (12.2 acres) in total |
| Block sizes | About 0.2 to 2.4 ha each |
| Irrigation | Drip |
| Monitoring period | January 2025 to October 2026 |
| Advisories | 781 in total, 394 in the 2025–26 season |
| Soil (modelled) | pH 6.1 to 6.3, low salinity, organic carbon rated low |
Why cool-climate Victorian Pinot is worth protecting
Every tonne a cool-climate grower saves from disease or poor timing carries a high price. Wine Australia’s National Vintage Report 2026 puts Victoria’s estimated crush at 191,765 tonnes, down 31 per cent on 2025 and 31 per cent below its 10-year average. In the same report, Pinot Noir bought from the Mornington Peninsula averaged $4,755 a tonne and from the Yarra Valley $2,869 a tonne, against $531 a tonne from the warm, irrigated Murray Darling–Swan Hill region.
Chart
Pinot Noir: average purchase price per tonne
AUD per tonne, selected regions, 2026 vintage
Prices like these are why small cool-climate growers watch each block closely. A few weeks of missed mildew or bunch rot on a hectare of Pinot can cost more than a season of monitoring.
How satellite vineyard monitoring works on these blocks
Each advisory starts with fresh satellite images of the block. The Sentinel-2 satellites carry a camera with a revisit time of five days with its two satellites and 10-metre detail in the visible and near-infrared bands. From these bands the system works out vegetation indices such as NDVI, which compares red and near-infrared light reflected by the land surface to show how much green leaf is present.
Infographic
How each block advisory is built in 4 steps
- 1Satellite passSentinel-2 images each block every few days; Sentinel-1 radar covers cloudy dates.
- 2Read the canopyNDVI and moisture indices show vigour and wetness block by block.
- 3Add weather and stageThe weather outlook and growth stage set water need and disease risk.
- 4Block planIrrigation, risk scores, nutrients with organic options, and a yield estimate.
When cloud hides a block, the system switches to radar. Sentinel-1 radar can image the ground by day or night, whatever the weather, so the grower still received an advisory on 16 cloudy dates that a camera alone would have missed.
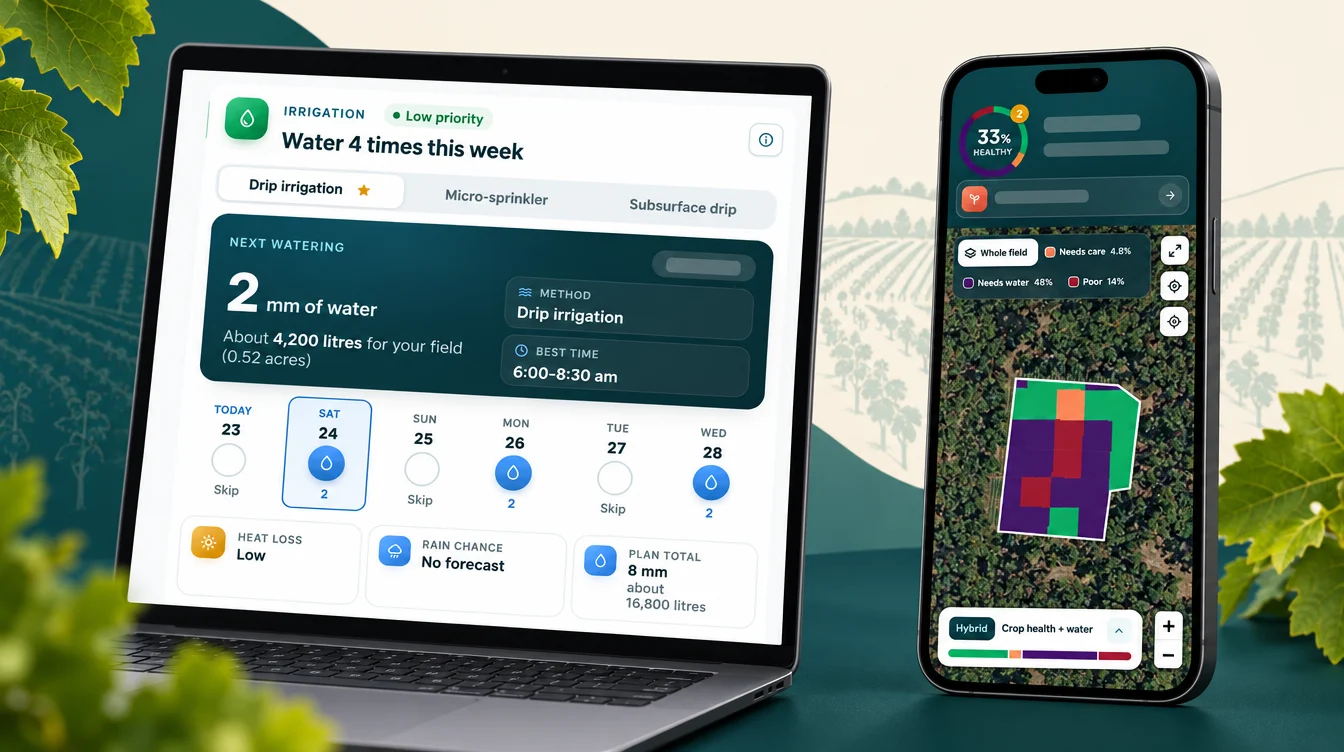
The images are combined with the weather outlook, the block’s growth stage and the crop’s known water and nutrient needs. The result is one advisory per block with five parts: an irrigation plan for the next week, pest and disease risk scores, weed risk, a fertilizer plan with organic options, and a yield estimate.
A full season in advisories
The 2025–26 season gives the clearest picture. From September 2025 to July 2026 the six blocks received 394 advisories. The growth stage in each advisory followed the vines through the year.
| Months | Main stage reported | What the advisories focused on |
|---|---|---|
| Sep to Oct | Budburst | Early shoot growth, first mildew watch |
| Nov to Dec | Flowering | Powdery and downy mildew risk, moth activity |
| Jan | Fruit set | Peak powdery mildew risk, rising water need |
| Feb | Veraison | Highest planned water, bunch rot watch |
| Mar to Apr | Harvest | Botrytis and moth risk at their peak |
| May | Post-harvest | Water cut back, post-harvest nutrition |
| Jun to Jul | Dormancy | Almost no irrigation planned |
Because each block gets its own advisory, a block that ran ahead or behind showed up straight away. In spring 2026, for example, one small block’s NDVI jumped from 0.22 on 11 October to 0.83 five days later as its canopy and the green cover between the rows filled in. The other blocks were already near that level.

▶ How a Farmonaut satellite farm advisory is read, section by section · 9:13
Disease and pest risk through the season
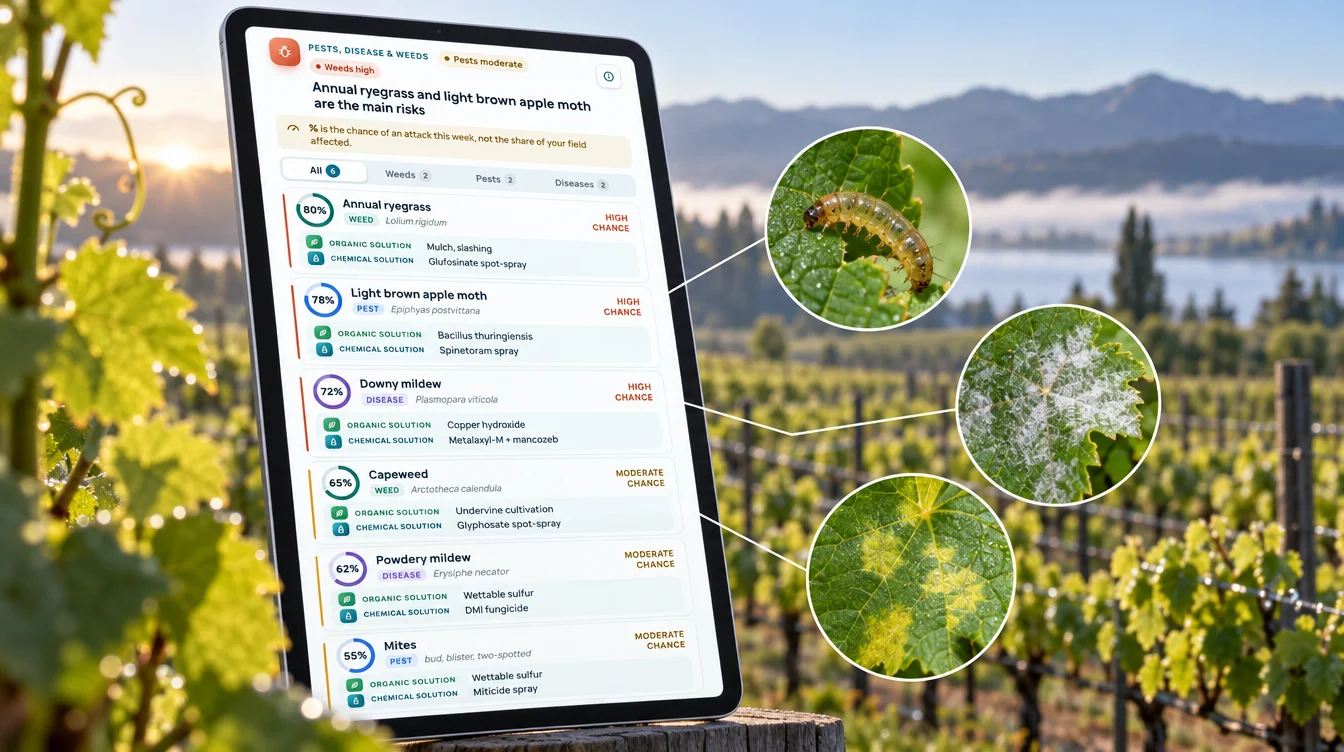
Wine Australia names powdery mildew, downy mildew and botrytis bunch rot as the top three disease concerns in Australian vineyards. These three, plus light brown apple moth, were the threats the advisories scored most often for this grower. Each score is a modelled probability built from the block’s canopy, moisture and weather data, and it tells the grower where and when to look first.

▶ Protecting grapevines from bud break to harvest · 6:35
From December 2025 to July 2026, the monthly average scores moved with the season. Mildew scores were highest around flowering and fruit set. Botrytis and moth scores climbed towards harvest and then fell away in winter.
Powdery mildew
The powdery mildew score averaged 91% in December and 95% in January, then dropped to 56% by April. That timing matches the AWRI’s advice that the critical time for powdery mildew falls just before flowering through to fruit set. The advisories gave both organic and conventional control options. Always follow the product label and local rules.
Downy mildew
Downy mildew scores were lower but steady, averaging 71% in December and 81% in January. The AWRI says the primary infections start when the temperature stays at 10°C or more with at least 10 mm of rain over 24 hours, and vines are most at risk from three to six weeks after budburst until berries are pea-sized. Its management guide suggests a rain gauge and a max/min thermometer to check those conditions. The advisory’s weather outlook helps the grower see those nights coming.
Botrytis and light brown apple moth
The botrytis score peaked at 96% in March, at harvest, and the light brown apple moth score stayed between 87% and 94% from December to April. The two belong together. Wine Australia explains that the moth’s biggest impact is the increased risk of infection by botrytis and other bunch-rotting fungi, and that it tends to be more of a problem in cooler wine regions and in tight-bunched, thin-skinned varieties. Pinot Noir in central Victoria fits both. The UC IPM program also notes that feeding damage on berries can let rot organisms in later in the season.
Phomopsis cane and leaf spot
Phomopsis was the fifth most-scored threat on these blocks. Agriculture Victoria notes that the disease is favoured by wet spring weather, and is widespread in many of Victoria’s wetter, cooler regions. Its leaf spots show up three to four weeks after rain, so a spring risk score gives the grower a head start on checking the lower leaves.
Over the full 21 months, light brown apple moth was the threat scored most often (637 times), followed by powdery mildew (503), mealybug (450), botrytis (425), phomopsis cane and leaf spot (268) and downy mildew (193).
Chart
Modelled risk by month, 2025–26 season
Average risk score across six blocks, %
Water: half the days planned dry
The irrigation part of each advisory plans a drip amount for each of the next several days. When advisories overlapped, we kept the newest plan for each block and day. That left 1,812 block-days of planned irrigation in the 2025–26 season. On 897 of them, or 49.5%, the advisory planned no water at all.
Chart
Rainfall vs planned drip by month
mm per month; BoM long-term mean vs advisory plan per block, 2025–26
The plan follows the vines’ changing water use. The FAO irrigation guide gives wine grapes a crop coefficient of 0.30 at the start of the season, 0.70 in mid-season and 0.45 at the end, so a vine in full canopy uses more than twice as much water as one just out of budburst. The advisories followed that curve. The planned daily amount averaged 1.6 to 2.4 mm from October to January, peaked at 3.1 mm in February during veraison, and fell to almost nothing in winter.
Local rainfall explains much of the pattern. At the Bureau of Meteorology’s Macedon Forestry station in central Victoria, mean rainfall runs from about 48 mm in January to 86 mm in August, and 853 mm a year (records 1873–2026). The advisory plan put most water on the vines in the drier summer months and almost none in the wet winter.
Dry days were not spread evenly. In February, the hottest month, only 24% of days were planned dry. In June, 87% were, and in July almost every day was.
Planned water compared with a daily routine
To compare, we worked out what each block would have received if it had been given its own average watering dose every day of the season. Against that same-dose routine, the advisory plan used 46% to 52% less water per block, and about 50% less across all six blocks. In the megalitres Australian growers use, each block’s plan came to about 4.5 to 4.9 ML per hectare for the season, against 8.7 to 9.8 ML/ha with a same-dose daily routine. This is a comparison of plans, not a metered saving, but it shows how much of the season’s water depends on timing.
Chart
Season water per block: plan vs daily routine
Planned ML per hectare, Sep 2025–Jul 2026
Nutrition and soil
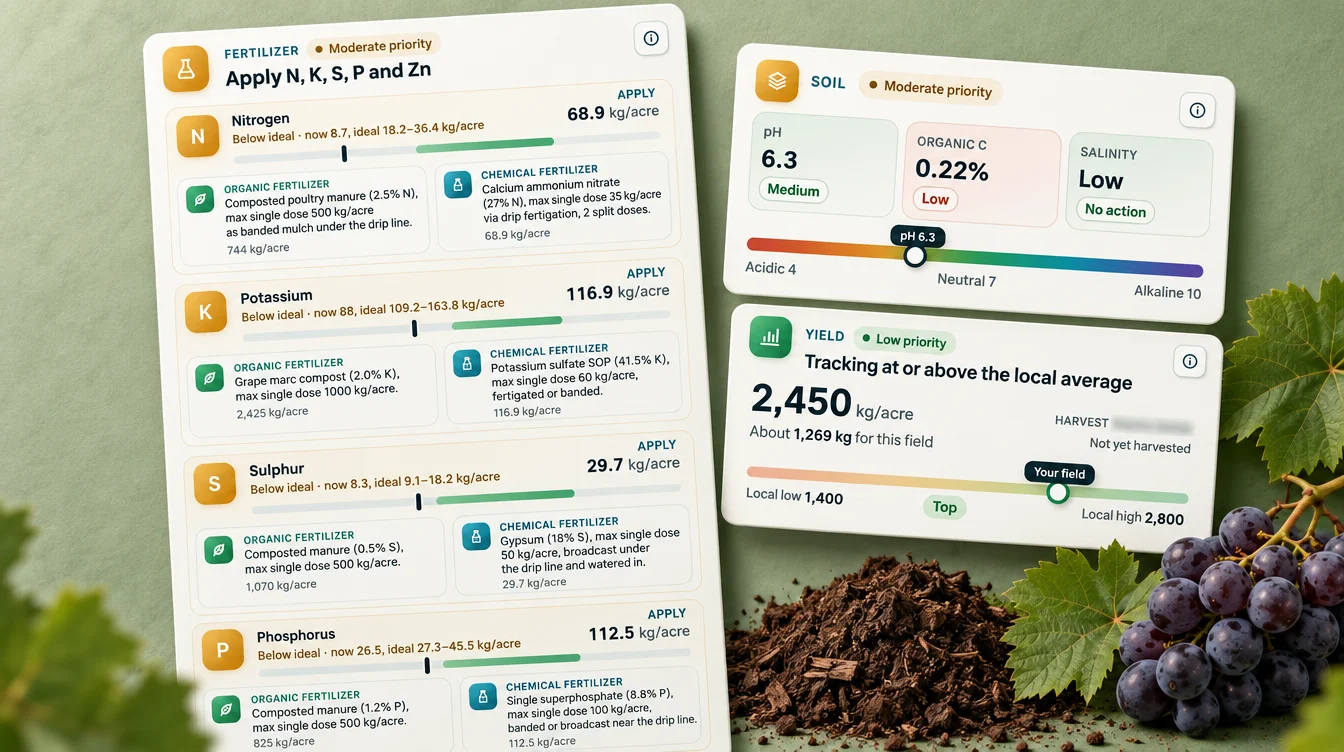
The fertilizer part of each advisory compares the block’s modelled nutrient levels with the ideal range for the current growth stage, then gives a rate for each nutrient that is short. In the 2025–26 season the advisories gave 1,965 nutrient recommendations, and every one of them came with an organic source as well as a conventional fertilizer.
The soil section rated the blocks at pH 6.1 to 6.3 with low salinity and low organic carbon. A low organic carbon rating is the reason the advisories leaned on compost-based options: they feed the vines and build soil at the same time. The yield card put the blocks at roughly 6 to 8 tonnes per hectare for the coming vintage, a modelled estimate rather than a forecast.
Spring on more Australian vineyards
The same system now watches more vineyards across Australia. In spring 2026 a research vineyard team added five larger blocks in New South Wales and South Australia, about 32 hectares (79 acres) in total. Their first advisories, from late September to October, reported shoot growth, inflorescence emergence and early flowering, with mildew risk scores of 50% to 80% and light brown apple moth scores of 55% to 76%.
One New South Wales block showed why frequent images help. Its NDVI read 0.71 in late September, dipped to 0.22–0.26 in early October and was back at 0.61 by 15 October. A short dip and recovery like this is something a grower can check on the ground within days, instead of finding it weeks later.

▶ Why radar satellites can see crops through cloud · 2:37
What other vineyard managers can take from it
Three lessons stand out from this grower’s 21 months of data.
Chart
Share of days planned with no irrigation
All six blocks, by month, %
- Watch risk by stage, not by calendar. Mildew scores peaked at flowering and fruit set, while botrytis and moth scores peaked at harvest. A block that runs ahead needs attention sooner.
- Plan water around the canopy. The plan followed the crop’s water curve and left half the season’s block-days dry, mostly after harvest and in winter.
- Keep organic options on the table. Every nutrient recommendation came with an organic source, which suits growers working on soil carbon.
If you run your own vineyard, the calculator below estimates how many megalitres planned dry days could save on your blocks, and what that water is worth at your own price per megalitre. You can then compare vineyard management software options, or try the Farmonaut Satellite + AI Farm Monitoring System on your own blocks.
Try the numbers for your own farm below.
Calculator
How much water could planned dry days save in your vineyard?
Enter your own block size, daily drip dose, season length and the share of days you leave dry.
- Water with a same-dose daily routine: 18.0 ML
- Water with planned dry days: 12.6 ML
- Saving per hectare: 1,080 m³/ha
- Value of water not applied: $1,620
Example values only, not a benchmark or forecast. Enter your own water price per megalitre. 1 mm of water over 1 hectare is 10 cubic metres, and 1 megalitre is 1,000 cubic metres (fixed in the formula).
FAQ
What is satellite vineyard monitoring?
It uses regular satellite images of each vineyard block to track canopy vigour, moisture and change over time. Farmonaut turns those images, plus weather data and the vines’ growth stage, into a plan for irrigation, nutrition and pest and disease risk for each block.
Can a satellite see downy mildew or powdery mildew?
Not directly. A satellite sees changes in the canopy, not the fungus. The advisory combines canopy data with weather conditions and the growth stage to score the risk, and the grower confirms any problem in the block.
How often does a vineyard get a new advisory?
In this case study each block received an advisory about every five days, in line with the Sentinel-2 revisit time. Radar images filled the gaps on cloudy dates.
Does it work on small vineyard blocks?
Yes. The smallest block in this case study is about 0.2 hectares (half an acre), and it received its own advisories through the whole season.
How much water can a vineyard save with an irrigation plan?
It depends on the site and season. In this case study the advisory plan was about 50% lower than giving each block the same dose every day, but that is a planned figure, not a metered one. Use the calculator above with your own numbers.
Farmonaut vineyard monitoring
Get a block-by-block plan for your vineyard
Draw your blocks once, and Farmonaut sends a satellite-based irrigation, nutrient and disease-risk plan for each one every few days on web, Android or iOS.




Keep reading


Sources
- Farmonaut advisory records for a central Victoria vineyard (2025–2026): sat.farmonaut.com
- ESA, Sentinel-2 facts and figures: esa.int
- Copernicus SentiWiki, Sentinel-1 mission: sentiwiki.copernicus.eu
- NASA Earth Observatory, Measuring vegetation (NDVI and EVI): science.nasa.gov
- FAO, Irrigation and Drainage Paper 56, Chapter 6 crop coefficients (1998): fao.org
- Wine Australia, Pest and disease management: wineaustralia.com
- Wine Australia, Light brown apple moth: wineaustralia.com
- AWRI, Viti-note: Characteristics of powdery mildew: awri.com.au
- AWRI, Viti-note: Characteristics of downy mildew: awri.com.au
- AWRI, Viti-note: Downy mildew management: awri.com.au
- UC IPM, Light brown apple moth in grapes: ipm.ucanr.edu
- Wine Australia, National Vintage Report 2026 (full report with regional appendix): wineaustralia.com
- Agriculture Victoria, Phomopsis cane and leaf spot of grapevines: agriculture.vic.gov.au
- Bureau of Meteorology, Climate statistics for Macedon Forestry (087036): bom.gov.au
Discussion
Questions, corrections or field experience? Share them below. First-time comments are reviewed before they appear, and your email is never published.
No comments yet. Be the first to add a question or your experience.

 Messina Beej
 Dirks Bros Farms
 Red August Group
 Farm Inc
 WeMe Global
 Agrotoken
 Blue BearX
 Insignito
 Croptimum
 DnCubed
 Field Capacity
 Indosistim Teknologi
 Liquify Digital
 CU Foods
 BeyondTech Global
 Rouge VC
 AgroGreen Dynamics
 AgroRisk

 Licence holder · Niger · Gold










