

Corn · State data and profit guide
Average Corn Yield Per Acre by State: What It Earns
The 2025 US average was 186.5 bushels per harvested acre, from 214 in Illinois to 135 in Texas among 16 major states (USDA NASS). That is about US$765 of grain per harvested acre before costs. USDA ERS estimates a loss of US$118 per planted acre after all costs listed.
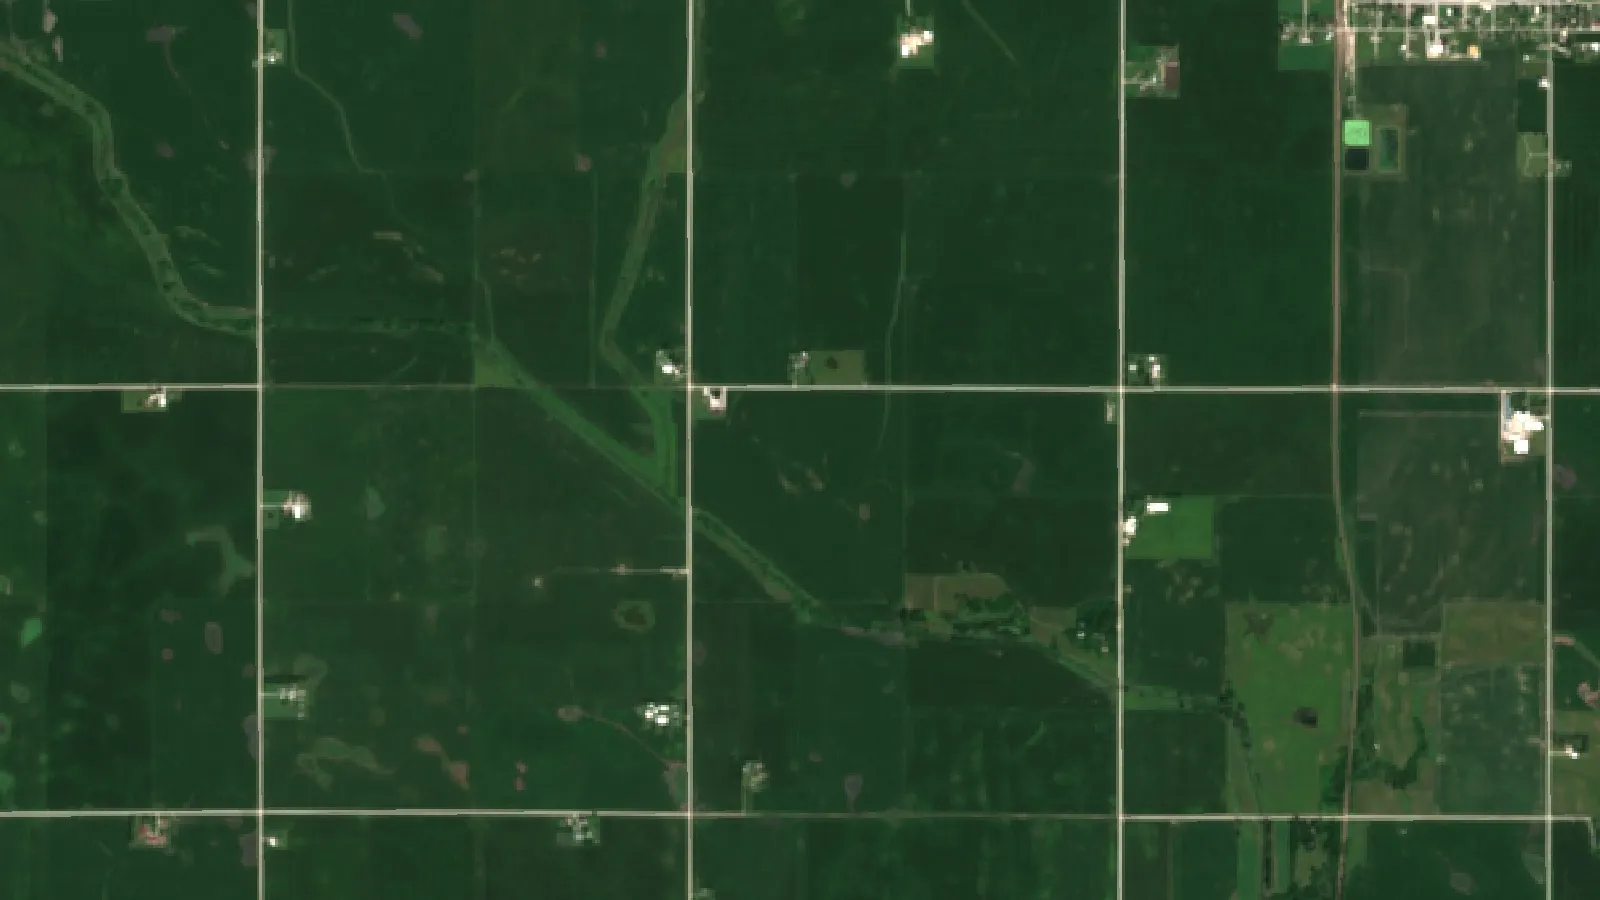
Key takeaways
- US corn averaged a record 186.5 bushels per harvested acre in 2025; Illinois had 214, Iowa 210, Nebraska 194 and Kansas 145 (USDA NASS, January 2026).
- Yield times the 2025 season-average price gives gross grain value per harvested acre: US$888 in Illinois, US$861 in Iowa, US$580 in Kansas (calculated from NASS data).
- USDA ERS puts 2025 corn at US$327 per planted acre above operating costs but US$118 below all costs listed, which include land and unpaid labor.
- University of Illinois budgets project US$50 to US$60 an acre above all costs for 2026 corn in northern and central Illinois, with a break-even near US$5 a bushel for the 2027 crop.
- Corn silage averaged 21.8 tons per harvested acre in 2025, from 17 tons in New York and South Dakota to 31 in Idaho among the 12 states in the table.
In this article
- Average corn yield per acre by state
- Why corn yields differ from state to state
- How much do farmers make per acre of corn?
- Average farm income per acre in the USA: gross value by state
- Profit per acre of corn in Illinois
- Corn silage yield per acre by state
- Work out your own corn profit per acre
- Using state averages on your own farm
- How we checked the numbers
- FAQ
Among the 16 states in the table below, the average corn yield per acre in 2025 ranged from 214 bushels in Illinois and 210 in Iowa to 135 in Texas and 145 in Kansas, against a US average of 186.5 bushels per harvested acre (USDA NASS, January 2026). At the season-average price of US$4.10 a bushel, that is about US$765 of grain per harvested acre before any costs. After all costs, including land and the owner’s own labor, USDA’s Economic Research Service estimates that the average US corn acre had a negative return of US$118 per planted acre in 2025.
So how much do farmers make per acre of corn? It depends on yield, price, land cost and who owns the land. This page gives the state yields, the gross value of the crop in each state, the cost side from USDA and the University of Illinois, and a calculator for your own numbers.
Average corn yield per acre by state
The table lists the 2025 crop in 16 states and the United States, from the USDA National Agricultural Statistics Service (NASS) Crop Production 2025 Summary and Crop Values 2025 Summary. Yield is bushels per harvested acre, not per planted acre. The last column is yield times the season-average price, so it is the value of the grain before costs. NASS marks the 2025 prices as preliminary, and the September 2026 WASDE now estimates the 2025/26 national average at US$4.15. The 2025 national yield was a record, 7.2 bushels above 2024 (NASS, January 2026).
| State | 2025 yield (bu/ac) | 2024 yield (bu/ac) | 2025 price (US$/bu) | Grain value (US$/ac) |
|---|---|---|---|---|
| Illinois | 214 | 217 | 4.15 | 888 |
| Iowa | 210 | 211 | 4.10 | 861 |
| Indiana | 204 | 198 | 4.30 | 877 |
| Minnesota | 201 | 174 | 3.95 | 794 |
| Nebraska | 194 | 188 | 4.10 | 795 |
| Wisconsin | 188 | 174 | 4.05 | 761 |
| Georgia | 187 | 163 | 4.90 | 916 |
| Ohio | 185 | 177 | 4.25 | 786 |
| Missouri | 185 | 183 | 4.15 | 768 |
| California | 173 | 182 | 4.70 | 813 |
| South Dakota | 171 | 164 | 3.80 | 650 |
| North Dakota | 158 | 149 | 3.80 | 600 |
| Alabama | 152 | 112 | 4.40 | 669 |
| Kansas | 145 | 129 | 4.00 | 580 |
| North Carolina | 144 | 87 | 4.75 | 684 |
| Texas | 135 | 112 | 4.60 | 621 |
| United States | 186.5 | 179.3 | 4.10 | 765 |
Three things stand out. First, the top Corn Belt states lead on yield (Illinois, Iowa, Indiana and Minnesota all above 200 bushels), but the Southeast was not uniformly low. Georgia reported 187 bushels, level with the US average, while Alabama (152) and North Carolina (144) were well below it. Second, Georgia’s higher price put its grain value above Iowa’s. Third, some states swing a lot from year to year: North Carolina went from 87 bushels in 2024 to 144 in 2025, and Alabama from 112 to 152.
Chart
Corn yield per harvested acre, 2025
Bushels per acre, seven large producing states and the US average
Why corn yields differ from state to state
NASS reports the numbers but not the causes, so treat the reasons below as agronomy, not as a ranking of states. Rainfall and heat in the grain-fill period, soil depth and water-holding capacity, hybrid choice, nitrogen management and the share of irrigated land all move a state average. ERS’s corn cost data (base survey of 2021) put about 10% of US corn acres as irrigated and 90% as dryland in its 2025 estimates (USDA ERS).
Planting date is not the whole story at state scale. Purdue’s Bob Nielsen notes that early planting favors higher yields but does not guarantee them, that statewide averages for planting progress and yield in Indiana are not strongly related, and that planting date is one of many yield factors (Purdue Extension). The year-to-year swings in the table show how much one season can change a state average: Minnesota gained 27 bushels, Alabama 40 and North Carolina 57 between 2024 and 2025.
Two other points help when you compare your own yield with a state number. A state average includes every grower, from the best fields to the poorest, so your best fields should beat it. ERS reports yield per planted acre from its own farm survey (198 bushels in 2025), while NASS reports yield per harvested acre (186.5). The two use different methods and bases, so do not mix them in one comparison.

▶ How satellite NDVI maps show crop stress on a corn farm before it is visible on foot. · 4:09
How much do farmers make per acre of corn?
USDA’s Economic Research Service (ERS) publishes national and regional cost and return estimates for corn. Its 2025 figures are marked ‘base survey of 2021’ in the data file, so they are estimates, not a new 2025 survey. For 2025 it puts the value of corn production at US$782 per planted acre, from 198 bushels at US$3.93 a bushel. Operating costs were US$456, so the crop covered its operating costs with US$327 to spare. But when ERS adds machinery replacement, overhead, taxes and insurance, and charges for the farmer’s own land and unpaid labor, the total reaches US$901 and the result is a loss of US$118 an acre (USDA ERS Commodity Costs and Returns, updated 1 October 2026).
Chart
US corn net returns per planted acre
US$ per planted acre, two ways of counting costs
The reading that matters depends on who you are. An owner with no debt who does the work may not pay the land and labor charges in cash, so that farm’s true result lies between the two numbers: machinery replacement, taxes and insurance still have to be paid. A tenant who pays cash rent, or an owner who could rent the land out, looks at the second.
| Cost line | US$ per planted acre |
|---|---|
| Fertilizer | 172 |
| Seed | 113 |
| Chemicals | 49 |
| Repairs | 49 |
| Custom services | 37 |
| Fuel and electricity | 27 |
| Interest, water | 9 |
| Operating costs | 456 |
| Machinery recovery | 171 |
| Land (opportunity cost) | 190 |
| Other overhead and labor | 83 |
| Total costs listed | 901 |
The table shows the US total for 2025 (USDA ERS, base survey of 2021). Fertilizer and seed together are 63% of operating costs. The last overhead row adds general farm overhead, hired labor, unpaid labor, taxes and insurance; lines may not add exactly because of rounding.
The line chart shows how fast the picture changed. In 2021 and 2022 high prices left a profit even after all listed costs. In 2023 the margin shrank to US$12, and in 2024 and 2025 it turned negative at about US$120 an acre, because corn fell to roughly US$4 a bushel while costs stayed near US$900.
The range chart below splits the 2025 results by ERS farm region. Every region had a positive return over operating costs, but only the figure over all costs listed shows the real squeeze. The Northern Great Plains came closest to break-even (a loss of US$12), while the Northern Crescent lost US$185.
Chart
2025 corn returns by ERS farm region
US$ per planted acre
Average farm income per acre in the USA: gross value by state
Searchers often want “income per acre” by state. USDA does not publish a net farm income per acre figure for corn by state. What it does publish is yield, price and total value of production, and from those you can work out gross receipts per harvested acre, as in the table above. Farm income is what is left after costs, and costs differ more by farm than by state: cash rent, fertilizer bought early or late, and how much machinery is owned all vary.
Chart
Grain value per harvested acre, 2025
US$ per harvested acre before costs (yield times season-average price), selected states
The chart ranks eight states by grain value per harvested acre. Illinois, Indiana and Iowa are all above US$850. Kansas and South Dakota are far lower because their yields were below the US average and their prices were no higher than Iowa’s.
Profit per acre of corn in Illinois
For profit in one Corn Belt state, a useful public source is the University of Illinois farmdoc team, which builds Illinois crop budgets using records from the Illinois Farm Business Farm Management Association, a group of more than 4,900 farms. Their September 2026 update projects 2026 corn returns above all costs, including cash rent, of US$50 to US$60 an acre in northern and central Illinois, at a budget price of US$4.95 a bushel. For southern Illinois the projection is about break-even (farmdoc daily, 1 September 2026).
For the 2027 crop, at US$5.00 a bushel and trend yields, the same budgets show US$28 to US$36 an acre for northern and central Illinois and a loss of US$61 for southern Illinois. Break-even prices are just below US$5 a bushel in northern and central Illinois and US$5.39 in the south. These are budget projections, not results, and the authors warn that a fall in price could quickly turn marginal profits negative.
Two more facts from the same September 2026 farmdoc article help to put a single year in context. A move of US$0.50 in the corn price shifts returns by more than US$100 an acre in Illinois, because yields are high. And net returns for a 50-50 corn-soybean rotation on high-productivity central Illinois land have averaged US$100 an acre since 2000, which is well above recent years. Soybeans out-earned corn in 10 of the 13 crop years from 2013 to 2025 in a separate farmdoc analysis of central Illinois high-productivity farms (farmdoc daily, 2 June 2026).
The August 2026 farmdoc analysis adds that when prices sit near or below their long-run plateaus of about US$4.50 for corn and US$11.00 for soybeans, soybeans tend to be more profitable than corn in Illinois (farmdoc daily, 4 August 2026).
Prices are moving. USDA’s September 2026 WASDE forecasts the 2026/27 season-average price received by US corn producers at US$4.80 a bushel and the national yield at 178.5 bushels per acre. Both are forecasts, not results, and the report revises them each month.
Corn silage yield per acre by state
Dairy and beef farms often cut the whole plant for silage. NASS reports silage in tons per harvested acre, and the national average was 21.8 tons in 2025, up from 20.2 in 2024. The table shows selected states for 2025, sorted by yield.
| State | Yield 2025 (tons/ac) | Acres cut 2025 (1,000) |
|---|---|---|
| Idaho | 31 | 280 |
| California | 27 | 365 |
| Iowa | 25 | 250 |
| Minnesota | 23 | 360 |
| Michigan | 22.5 | 350 |
| Ohio | 22 | 200 |
| Wisconsin | 22 | 885 |
| Texas | 22 | 265 |
| Nebraska | 21 | 210 |
| Pennsylvania | 20 | 315 |
| New York | 17 | 500 |
| South Dakota | 17 | 390 |
| United States | 21.8 | 6,208 |
To compare silage with grain, University of Nebraska-Lincoln research values standing silage at 7.65 times the corn price per bushel, per ton at 65% moisture, which does not depend on the price level. At US$4.10 corn that is about US$31 a ton in the field, or roughly US$684 an acre at the 2025 US yield of 21.8 tons. That is a rough comparison, since NASS does not state the moisture of its silage tons. It is below the grain value of US$765, but the buyer of standing silage also pays for harvest, hauling and packing, and the grower skips combining and hauling grain (UNL BeefWatch).
Work out your own corn profit per acre
The state numbers above are averages. Enter your own yield, price and costs to see your break-even.
Try the numbers for your own farm below.
Calculator
What is your corn profit per acre?
Enter your own yield, price and costs per acre.
- Revenue per acre: $855
- Total cost per acre: $900
- Return over operating costs: $400
- Break-even price: 4.74 US$/bu
- Break-even yield: 200 bu/ac
- Whole-farm result: -$22,500
Example values only, not a benchmark or a forecast; the price is an example, so use today’s price. The cost defaults are rounded from USDA ERS 2025 US corn costs per planted acre: operating costs US$456, machinery, overhead and labor US$255, land US$190 (ERS, updated 1 October 2026). Use your own cash rent or land cost. Enter yield and costs on the same acre basis (planted or harvested).
Using state averages on your own farm
A state average is a useful yardstick, not a target. Compare your five-year average yield with your state’s and your county’s, and then compare costs, not just yield. For example, a field that makes 20 bushels more but costs US$60 more in nitrogen only pays at a price above US$3 a bushel, and the calculator shows that quickly.
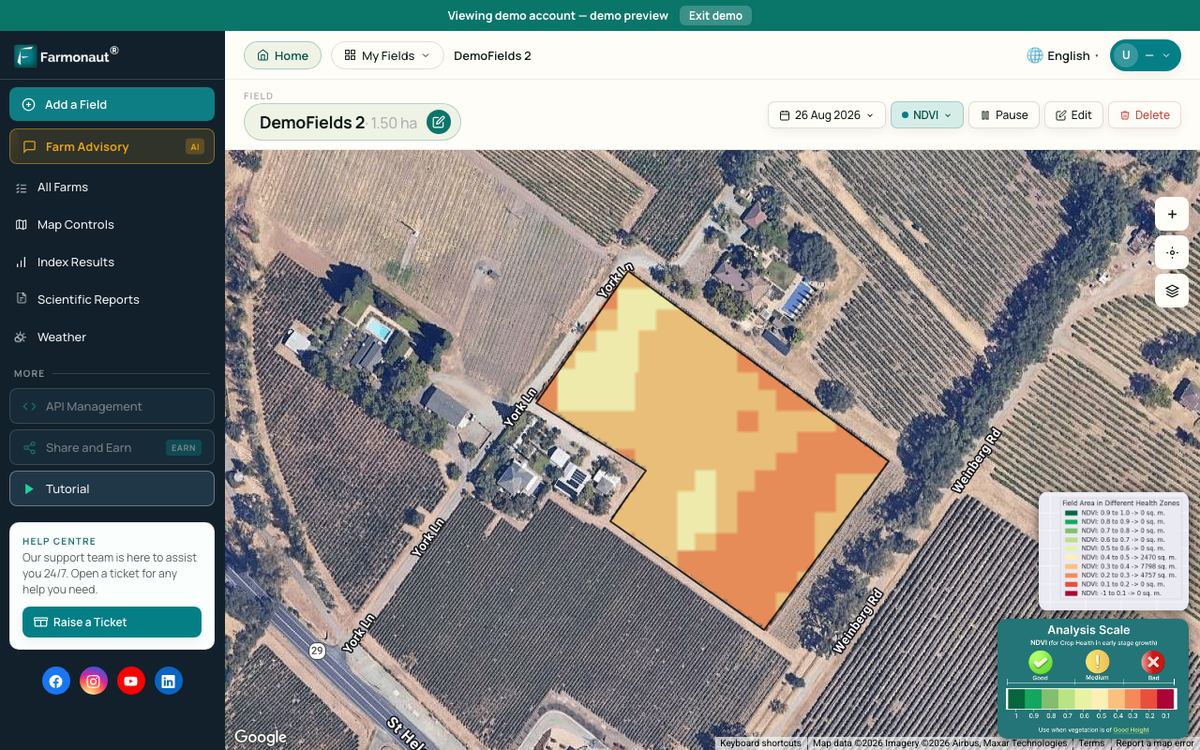
Fields on the same farm often differ by more than farms differ from each other. Satellite images show those differences during the season, which helps you look at the weak zones sooner. Farmonaut Satellite + AI Farm Monitoring System maps vegetation health for each field from satellite images. It shows where crop vigor differs, not the cause, and it does not replace a yield monitor or soil sampling.
Crop insurance and input choices are financial decisions. Check labels, local rules and your lender’s terms, and get professional advice for your own farm.

▶ How to read a satellite farm advisory that caught a maize yield drop. · 9:13
How we checked the numbers
Yields, prices and production values come from the NASS Crop Production 2025 Summary (January 2026) and Crop Values 2025 Summary (February 2026). Costs and returns come from the ERS Commodity Costs and Returns data file for corn, updated 1 October 2026. Illinois profit projections come from farmdoc daily. Forecasts come from the September 2026 WASDE. Grain value is yield times price for each state, calculated by us. Prices are USDA season-average prices received by farmers, not dealer asks.
Related pages on our site: home page, product traceability, fleet management, carbon footprinting, crop loan and insurance, large-scale farm management, agribusiness finance, weather API docs, satellite data API and the apps. For crop-specific advice, see our maize yield strategies guide.
FAQ
What is the average corn yield per acre in the US?
The 2025 US average was 186.5 bushels per harvested acre, a record and 7.2 bushels above 2024 (USDA NASS, January 2026). USDA’s September 2026 forecast for the 2026 crop is 178.5 bushels, which may change.
Which state has the highest average corn yield per acre?
Among all states in the NASS summary, Washington reported the highest 2025 yield at 251 bushels, on about 110,000 harvested acres. Among the large producers, Illinois led with 214, then Iowa with 210.
How much does a farmer make per acre of corn?
The gross value of 2025 corn was about US$782 a planted acre (ERS). After operating costs the margin was US$327; after all listed costs including land and unpaid labor it was a loss of US$118. Your result depends on rent, yield and price.
What is the average farm income per acre in the USA?
USDA does not publish one all-crop farm income per acre figure. For corn, ERS estimates net returns per planted acre (a loss of US$118 after all costs listed in 2025), or you can take gross value per acre from NASS (yield times price) and subtract your own costs.
How much corn silage per acre can I expect?
The US average was 21.8 tons per harvested acre in 2025. State averages ranged from 17 tons in New York and South Dakota to 31 tons in Idaho among the states listed above (NASS).
Does corn pay more than soybeans?
In central Illinois farm records, soybeans returned more than corn in 10 of the 13 years from 2013 to 2025, by an average US$53 an acre. Corn did better in 2020 to 2022, when prices were high (farmdoc daily).
Farmonaut crop monitoring
See your own fields from space
Farmonaut Satellite + AI Farm Monitoring System shows how vigor varies across each of your fields during the season.



Keep reading


Sources
- USDA NASS, Crop Production 2025 Summary (January 2026): esmis.nal.usda.gov
- USDA NASS, Crop Values 2025 Summary (February 2026): nass.usda.gov
- USDA ERS, Commodity Costs and Returns (updated 1 October 2026): ers.usda.gov
- USDA ERS, corn costs and returns data file (CSV): ers.usda.gov
- farmdoc daily, Illinois Crop Budgets for 2027 (1 September 2026): farmdocdaily.illinois.edu
- farmdoc daily, Historical Corn versus Soybean Returns in Illinois (2 June 2026): farmdocdaily.illinois.edu
- farmdoc daily, Historic Corn and Soybean Profitability and 2027 Planting (4 August 2026): farmdocdaily.illinois.edu
- USDA, World Agricultural Supply and Demand Estimates, September 2026: usda.gov
- University of Nebraska-Lincoln, Is That Corn Crop Worth More as Silage or Grain?: beef.unl.edu
- Purdue University Extension, The Planting Date Conundrum for Corn: agry.purdue.edu
Discussion
Questions, corrections or field experience? Share them below. First-time comments are reviewed before they appear, and your email is never published.
No comments yet. Be the first to add a question or your experience.

 Etherspace Network
 Teledarbas
 Wild Oak Farm
 SFX
 BACF Africa
 Doodlakine
 Exurbia Geospatial
 FieldZero
 Indico Company
 Kubota
 FFBS
 Jontra
 Tucor

 Licence holder · Niger · Gold
 Licence holder · Nigeria · Gold + lithium
 Client · Tanzania · Gold
 Client · Somalia · Gold
 Client & affiliate partner · Ghana · Gold










