

Canada · Commodity map guide
Canada Mineral Deposits Map: Where Each Metal Is Mined
Gold comes mainly from Ontario and Quebec, copper from British Columbia, potash only from Saskatchewan. Here is each commodity by province, with NRCan production figures and the official maps.
Key takeaways
- Canadian mineral shipments were about C$61.7 billion in 2025 (preliminary, before coal); gold alone was about C$20.8 billion (NRCan, 2026).
- Ontario (74.9 t) and Quebec (57.5 t) produced most of Canada’s 186.9 t of gold in 2025 (NRCan, preliminary).
- British Columbia produced about 69% of Canadian copper, 347,075 of 499,896 tonnes (NRCan, 2025 preliminary).
- All reported potash, 24.8 Mt of muriate of potash, comes from Saskatchewan; uranium comes from the Athabasca Basin (NRCan, Cameco).
- Start with NRCan Map 900A for operating mines and the provincial survey portals for deposits and drill data.
In this article
- Canada mineral deposits map: the short version by commodity
- Gold: Ontario and Quebec lead
- Copper: British Columbia dominates
- Where is nickel mined in Canada
- Where is potash mined in Canada
- Uranium: the Athabasca Basin
- Where is iron ore mined in Canada
- Diamonds: the Northwest Territories
- Critical minerals on the Canadian map
- Official Canadian mineral maps and databases
- How to use the NRCan production statistics
- Reading the map for exploration
- What to watch on the Canadian map next
- Frequently asked questions
Canada mines almost every major metal, but each one sits in a small number of places. Gold comes mainly from Ontario and Quebec, copper from British Columbia, nickel from Ontario, Quebec, Newfoundland and Labrador and Manitoba, potash only from Saskatchewan, and diamonds from the Northwest Territories. Natural Resources Canada (NRCan) puts the value of 2025 mineral shipments at about C$61.7 billion before coal, and gold alone is about C$20.8 billion of that (NRCan, Mineral production in Canada, 2025 preliminary). This page puts each commodity on the map by province or territory, shows where to find the official maps, and tells you which statistics to trust.
Figures marked “preliminary” come from the 2025 table that NRCan published with Statistics Canada in February 2026. They can be revised. Money is in Canadian dollars (C$) unless a line says US$.
Canada mineral deposits map: the short version by commodity
If you only need to know where to look, this table is the answer. The quantities are NRCan’s preliminary 2025 production (shipments for potash and diamonds are quoted in the sections below). “Camps” are the best-known mining districts, not a full list of mines.
Chart
Value of Canadian shipments by commodity
C$ billion, 2025 preliminary
| Commodity | Where it is mined | Best-known camps | Canada total, 2025 preliminary |
|---|---|---|---|
| Gold | Ontario, Quebec, Nunavut, British Columbia, Manitoba | Timmins, Red Lake, Hemlo, Abitibi, Meadowbank | 186.9 tonnes |
| Copper | British Columbia (69%), Ontario, Quebec, Newfoundland and Labrador, Manitoba | Highland Valley, Sudbury, Flin Flon belt | 499,896 tonnes |
| Nickel | Quebec, Ontario, Newfoundland and Labrador, Manitoba | Sudbury, Voisey’s Bay, Raglan, Thompson | 155,252 tonnes |
| Iron ore | Quebec and Labrador (Labrador Trough), Nunavut | Fermont, Labrador City, Mary River | 70.2 million tonnes of concentrate |
| Potash | Saskatchewan only | Saskatoon and Esterhazy areas of the Williston Basin | 24.8 million tonnes of muriate of potash |
| Uranium | Northern Saskatchewan | Athabasca Basin: Cigar Lake, McArthur River | Confidential in the NRCan table |
| Diamonds | Northwest Territories (plus small output elsewhere) | Lac de Gras, Gahcho Kue | 14.1 million carats |
| Zinc | Ontario, Manitoba, Quebec, Yukon | Timmins area, Flin Flon belt | 73,312 tonnes |
| Cobalt | Newfoundland and Labrador, Quebec, Ontario, Manitoba | By-product of nickel mines | 4,616 tonnes |
| Lithium | Quebec, Manitoba | Abitibi region, Bernic Lake | 4.47 million kilograms |
The provinces are not equal. Ontario, Quebec and British Columbia account for most metal output, and Saskatchewan leads the non-metals because of potash. NRCan’s table lists each commodity by province and territory, and it is the best single source for “who mines what” (NRCan, Minerals and metals statistics: production).
Gold: Ontario and Quebec lead
Gold is Canada’s most valuable mined metal. In 2025 preliminary data Ontario produced about 74.9 tonnes, Quebec 57.5 tonnes, Nunavut 22.6 tonnes and British Columbia 22.0 tonnes, out of 186.9 tonnes for the country. Manitoba added 5.7 tonnes. Saskatchewan and Yukon figures are held back by NRCan to protect company data.
Chart
Gold production by province and territory
Tonnes, 2025 preliminary
Most of this gold is in greenstone belts: strips of very old volcanic and sedimentary rock, hundreds of millions to billions of years old, that were folded and cut by faults. Hot water moved along those faults and left gold in quartz veins and altered rock. In Ontario the main camps are Timmins, Kirkland Lake, Red Lake, Hemlo and Detour Lake. Our guide to gold deposits in Ontario lists the mines and owners camp by camp.
Quebec’s gold sits in the Abitibi belt, the Quebec side of the same geological province that holds Timmins. Agnico Eagle runs several mines there, including Canadian Malartic and LaRonde. In Nunavut, gold comes from the Meadowbank and Meliadine mines near Baker Lake and Rankin Inlet, both operated by Agnico Eagle. British Columbia’s 22.0 tonnes come from both gold-focused mines, such as Brucejack, and copper mines that recover gold as a by-product.
For a world view of the same ore styles, see our global gold deposits map.
Copper: British Columbia dominates
Copper is dominated by one province. British Columbia produced about 347,000 tonnes in 2025 (preliminary), roughly 69% of the national 499,896 tonnes. Ontario was second at about 93,000 tonnes, followed by Quebec (28,000), Newfoundland and Labrador (20,000) and Manitoba (11,000).
Chart
Copper production by province
Thousand tonnes, 2025 preliminary
British Columbia’s copper comes from porphyry deposits, large bodies of low-grade ore (often 0.2% to 0.5% copper) where intrusive rock cooled and fed hot fluids into the surrounding rock. The best-known operations are Highland Valley (Teck), Gibraltar (Taseko) and Red Chris (Newmont-operated). Ontario’s copper comes largely together with nickel around Sudbury. Quebec and Manitoba produce it from volcanogenic massive sulphide deposits, which formed on ancient sea floors and often carry zinc and gold as well. The Flin Flon and Snow Lake belt in Manitoba (Flin Flon sits on the Saskatchewan border) is the best-known example.
Copper is one of the six priority critical minerals named by the federal government, so the map of copper projects is changing quickly. For the world picture compare our posts on DRC copper mines.
Where is nickel mined in Canada
Nickel has four main homes. In 2025 preliminary data Quebec produced about 59,500 tonnes, Ontario 44,800, Newfoundland and Labrador 37,600 and Manitoba 13,400, for a national total of 155,252 tonnes worth about C$3.4 billion. The USGS lists Canada at an estimated 140,000 tonnes in 2025 on its own basis, out of about 3.9 million tonnes worldwide, and reserves of 2.2 million tonnes (USGS, Mineral Commodity Summaries). The two series differ (USGS 140,000 t estimate against NRCan 155,252 t preliminary) because each agency uses its own method and revisions.
Chart
Nickel production by province
Thousand tonnes
- Sudbury, Ontario: a basin created by a meteorite impact about 1.85 billion years ago, with nickel-copper sulphides at its rim. Mining here has run for well over a century (The Northern Miner). Vale and Glencore both hold operations in the area.
- Voisey’s Bay, Newfoundland and Labrador: a high-grade nickel-copper-cobalt deposit in northern Labrador. Vale reports a 90% interest in Voisey’s Bay Mines (Vale, Form 20-F).
- Raglan, Nunavik, Quebec: a nickel mine in the far north of Quebec, supplied by air and sea.
- Thompson, Manitoba: Vale Base Metals has announced a consortium to invest in the Thompson complex, with closing expected by the end of 2026 (Mining Technology).
Cobalt is mostly recovered from the same ores. NRCan lists 4,616 tonnes for 2025 (preliminary), with Newfoundland and Labrador at 2,309 tonnes and Quebec at 1,478 tonnes.
Where is potash mined in Canada
Potash is the shortest answer in this article: Saskatchewan. All of Canada’s potash production in the NRCan table, 24.8 million tonnes of muriate of potash worth about C$9.5 billion in 2025 (preliminary), is reported in that province. The ore is a salt bed in the Williston Basin, a deep sedimentary basin that spreads across Saskatchewan, Manitoba and the northern United States. The USGS lists Canada at an estimated 15 million tonnes of potassium oxide equivalent in 2025 out of 49 million tonnes worldwide, with reserves of 1.1 billion tonnes (USGS, Mineral Commodity Summaries).
Potash is mined underground in shafts, or by solution mining where hot water dissolves the salt. It is mainly used as fertilizer. Potash is on Canada’s critical minerals list, and a new supplier is coming: BHP’s Jansen project in Saskatchewan is under development (Johnson Shoyama Graduate School of Public Policy).
Uranium: the Athabasca Basin
All Canadian uranium production comes from the Athabasca Basin in northern Saskatchewan. Uranium sits in “unconformity-related” deposits, where rich ore lies near the contact between a flat-lying sandstone and the older rock beneath. Grades here are far higher than at most mines elsewhere, which is why Canada remains a leading producer. NRCan hides the uranium line in its public table because only a few companies report from the province, so company reports are the best public numbers.
Cameco, the operator, reported the following for 2025 on a 100% basis: Cigar Lake produced 19.1 million pounds of U3O8 and McArthur River/Key Lake 15.1 million pounds. Cameco’s own share across its operations was 21.0 million pounds, down from 23.4 million pounds in 2024, because of delays moving into new mining areas at McArthur River (World Nuclear News). Mind the basis when you compare mines: 100% output and the owner’s share are different numbers. For other regions, see our list of African uranium mines.
Where is iron ore mined in Canada
Iron ore is concentrated in the Labrador Trough, a long belt of iron-rich sedimentary rock along the border of Quebec and Labrador. Quebec reported about 41.9 million tonnes of concentrate in 2025 (preliminary) of the national 70.2 million tonnes, worth about C$6.3 billion. The rest comes from Labrador and from Nunavut, where the figures are held back for confidentiality.
The mines cluster around Fermont in Quebec and Labrador City in Labrador. Champion Iron operates Bloom Lake near Fermont, and several other large mines work the same belt. A railway takes ore to the port of Sept-Iles (Mining Association of Canada). The USGS puts Canada’s 2025 estimate at 69 million tonnes of crude ore (41 million tonnes of contained iron), against a world total of about 2.6 billion tonnes (USGS, Mineral Commodity Summaries).
Diamonds: the Northwest Territories
Almost all Canadian diamonds come from the Northwest Territories, north-east of Yellowknife around Lac de Gras. The NRCan table shows national output of 14.1 million carats in 2025 (preliminary), and the Northwest Territories value of shipments was about C$1.25 billion. The diamonds sit in kimberlite pipes, narrow vertical bodies of volcanic rock that carried diamonds up from the mantle and are now buried beneath lakes.
The map is shrinking. Rio Tinto’s Diavik mine stopped production in March 2026 after its economic reserves ran out, with closure work running to 2029 (BNN Bloomberg). Gahcho Kue, operated by De Beers and Mountain Province, is still running, and local reporting puts its planned end at about 2030 to 2031 (Cabin Radio). Diamond projects are therefore best read as a map of past and current kimberlite fields, not of future mines.
Critical minerals on the Canadian map
The federal critical minerals list names 34 minerals, including aluminum, copper, cobalt, graphite, lithium, nickel, potash, rare earth elements, uranium and zinc. High-purity iron, phosphorous and silicon metal were added in 2024 (Natural Resources Canada). The federal Critical Minerals Strategy names six of them as priorities: lithium, graphite, nickel, cobalt, copper and rare earth elements.
Where each one is produced today:
- Lithium: 4.47 million kilograms in 2025 (preliminary), reported for Quebec and Manitoba (Manitoba 572,626 kilograms). Lithium here comes from spodumene, a lithium-bearing mineral found in pegmatite dykes.
- Graphite: Quebec, with the figure held back for confidentiality.
- Platinum group metals: 24.2 million grams, mainly from Ontario (15.4 million grams) and Quebec (8.3 million grams), as by-products of nickel-copper mining.
- Zinc: Ontario (42,124 tonnes), Manitoba (25,857 tonnes), Quebec and Yukon.
- Rare earths and tungsten: mostly at exploration and development stage, so they appear in provincial geoscience databases rather than in the production table.
Exploration is where the map is moving. Canada-wide exploration and deposit appraisal spending reached C$4.40 billion in 2025 (preliminary), with Ontario, Quebec and Saskatchewan taking 62.5% of it, as we set out in mineral exploration spending in Canada.
Official Canadian mineral maps and databases
Several different maps answer different questions. Pick by what you need.
- NRCan Map 900A, Principal mineral areas, producing mines, and oil and gas fields in Canada. An annual national map at 1:6,000,000 scale with a mine index giving each mine’s owner, type, location and main products, plus insets on metallurgical works and planned openings and closings (NRCan, Map 900A). This is the closest thing to a single Canadian commodity map.
- NRCan production statistics. Tables of quantity and value by commodity, province and territory, updated each year with Statistics Canada (NRCan statistics page).
- Provincial and territorial geological surveys. Mineral deposits, drill holes, assessment reports and geology maps are held by each jurisdiction. Ontario’s survey publishes through GeologyOntario, Quebec through SIGEOM, British Columbia through MapPlace and its MINFILE database, Saskatchewan through its mineral exploration and mining pages, Yukon through the Yukon Geological Survey, and the Northwest Territories through the NWT Geoscience Office.
The national map shows what is operating. The provincial databases show the much larger set of mineral occurrences: small showings, old mines and drilled prospects. If you are choosing ground rather than studying production, use the provincial layer. For the rules on staking by province see mineral claims in Canada by district.
How to use the NRCan production statistics
The production table has quirks that trip up first-time users. These five habits avoid most mistakes.
- Check the vintage. Values marked “p” are preliminary and can be revised the next February. Compare like with like: the 2024 gold total was 185,555 kilograms and the 2025 preliminary total is 186,923 kilograms.
- Read the units. Gold and silver are in kilograms, copper and nickel in tonnes, diamonds in carats, lithium in kilograms, platinum group metals in grams, and values are in thousands of dollars.
- Know that “x” means confidential. This hides uranium, much of Saskatchewan’s gold and several by-product metals. Do not read “x” as zero.
- Distinguish quantity produced from shipped. The table reports both, and they differ when stockpiles move.
- Remember the table is mine output, not smelter output. A province can mine copper that is refined elsewhere.
Reading the map for exploration
Production maps point to where the geology works, not to where the next mine will be. The same few settings recur: greenstone belts for gold and zinc, Sudbury-type intrusions for nickel, porphyry belts in British Columbia for copper, and sandstone-basement contacts in the Athabasca for uranium. Explorers use that pattern to screen ground before they spend on drilling.
Satellite imagery fits into that screening step. Sentinel-2 and thermal data can map iron-rich weathering, clay alteration and fault patterns across an entire claim block, so a licence holder can see which parts of a property resemble known camps before sending crews to the field. Farmonaut produces this kind of satellite screen for licence boundaries; the result is an exploration target map, not a resource estimate.
For a hands-on view, these two videos from our channel show an Ontario gold map and how to read a mining GIS map.
Calculator
What is a tonne of gold ore worth?
Enter your own grade, recovery, price and exchange rate.
- Recovered gold (troy ounces): 57.9
- Value of all ore in US$: $231,485
- Value of all ore in C$: $324,079
Example values only, not a benchmark. Contained gold = grade / 31.1035 troy ounces per tonne. The price is an input: example, use today’s price. Amounts in US$ and C$.
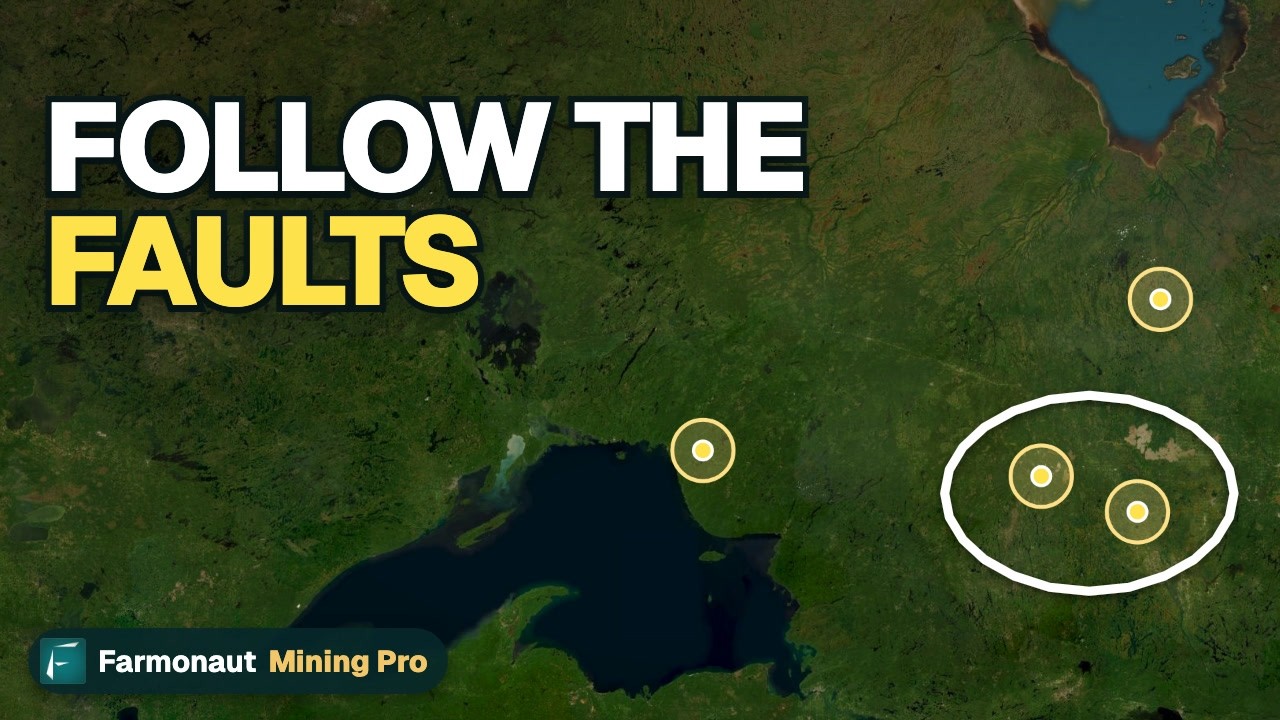
▶ Ontario makes about 40% of Canada’s gold: the map and the main belts. · 2:53
What to watch on the Canadian map next
Three trends will change the maps above. First, ownership keeps moving: mine names and operators change through mergers, so check a company’s latest filing before quoting an owner. Second, closures are real: Diavik has finished, while Vale Base Metals plans to sell 81.1% of its Thompson complex to a consortium, with closing expected by the end of 2026. Third, new supply is being built for critical minerals such as potash and uranium, where Jansen and expanded Athabasca output are in the news. Use NRCan’s annual tables to track the changes and provincial databases to see the early-stage projects behind them.
Canada is only one part of the world picture. Our world gold deposits map shows how the Canadian belts fit into the global pattern.
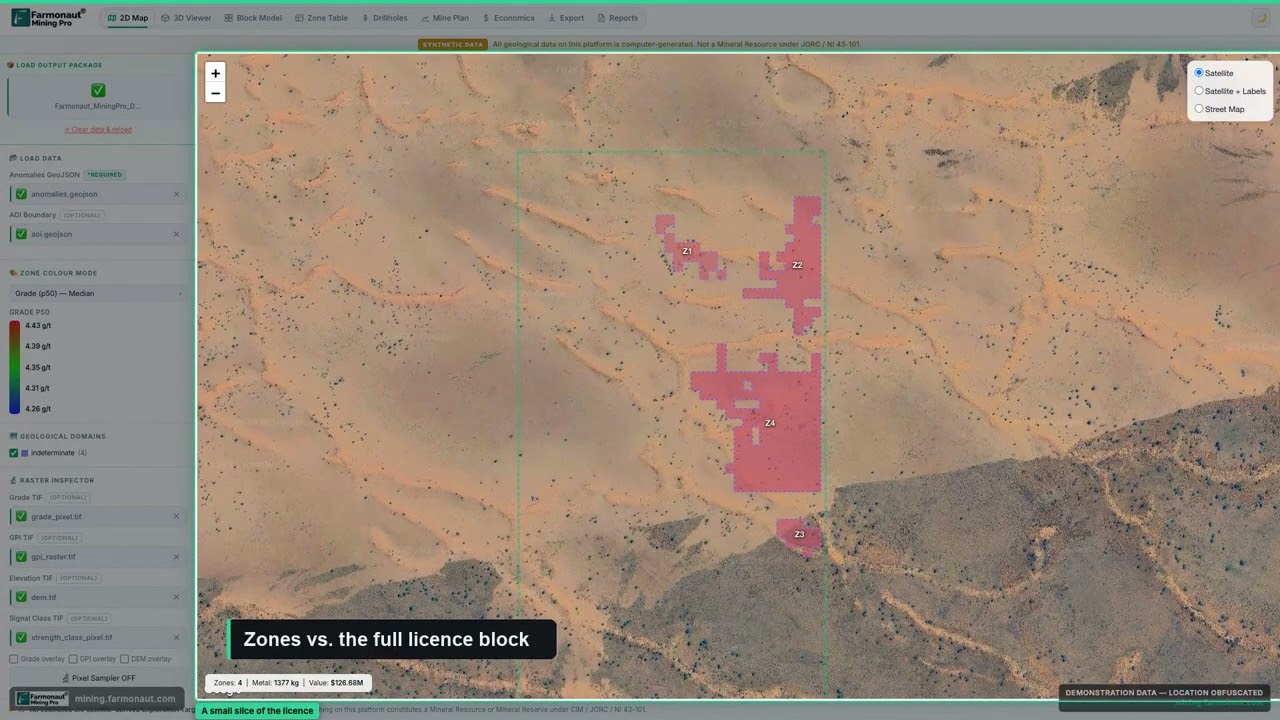
▶ How to read a mining GIS map with licence boundaries and anomaly zones. · 5:38
Frequently asked questions
Where can I find an official map of mineral deposits in Canada?
Start with NRCan’s Map 900A for operating mines and the provincial geological survey portals for deposits and drill data. Each province and territory keeps its own database, so there is no single national deposit layer.
Which province has the most mineral production in Canada?
By value of shipments in the 2025 preliminary table, Ontario (C$14.2 billion) and Quebec (C$13.3 billion) lead, with Saskatchewan next (its total is confidential in the table, but potash alone is C$9.5 billion). The national total excluding coal was about C$61.7 billion.
Where is gold mined in Canada?
Mostly in Ontario and Quebec, with Nunavut and British Columbia next. Ontario produced about 74.9 tonnes of the national 186.9 tonnes in 2025 (preliminary).
Where is copper mined in Canada?
British Columbia produces about 69% of Canadian copper, followed by Ontario, Quebec, Newfoundland and Labrador and Manitoba.
Where is nickel mined in Canada?
In Quebec (Raglan), Ontario (Sudbury), Newfoundland and Labrador (Voisey’s Bay) and Manitoba (Thompson).
Does Canada mine potash outside Saskatchewan?
Not in the NRCan production table. All reported potash output, 24.8 million tonnes of muriate of potash in 2025 (preliminary), comes from Saskatchewan.
Where is uranium mined in Canada?
In the Athabasca Basin of northern Saskatchewan. Cigar Lake and McArthur River/Key Lake produced 19.1 and 15.1 million pounds of U3O8 in 2025 on a 100% basis, according to Cameco.
Where are Canada’s diamond mines?
In the Northwest Territories near Lac de Gras. Diavik has closed; Gahcho Kue is still operating.
What are Canada’s critical minerals?
The federal list has 34 minerals, including copper, nickel, cobalt, lithium, graphite, potash, uranium, zinc and rare earth elements.
Is there a map of mineral claims for Canada?
Claims are registered by each province or territory, not nationally. Our guide to mineral claims in Canada compares the systems.
How often do the production statistics update?
NRCan and Statistics Canada release the annual tables each February, with preliminary figures for the latest year and revisions to earlier years.
This page is for information only. It is not investment advice. Confirm claim and licence rules with the relevant provincial or territorial regulator.
Farmonaut mining
Map your own project area from space
Send a licence boundary and get a satellite screen of alteration and structure as exploration targets.

Mining Pro sample view, synthetic data
Keep reading
Sources
- NRCan, Mineral production in Canada, 2025 (preliminary): sead.nrcan-rncan.gc.ca
- NRCan, Mineral production in Canada, 2024: sead.nrcan-rncan.gc.ca
- NRCan, Minerals and metals statistics: production: mmsd.nrcan-rncan.gc.ca
- NRCan, Map 900A Principal mineral areas, producing mines: natural-resources.canada.ca
- USGS, Mineral Commodity Summaries 2026: Nickel: pubs.usgs.gov
- USGS, Mineral Commodity Summaries 2026: Potash: pubs.usgs.gov
- USGS, Mineral Commodity Summaries 2026: Iron ore: pubs.usgs.gov
- World Nuclear News, Cameco and Kazatomprom 2025 production: world-nuclear-news.org
- Vale, Form 20-F (2025): sec.gov
- BNN Bloomberg, Diavik marks last day of production: bnnbloomberg.ca
- Cabin Radio, Diavik closing, Gahcho Kue: cabinradio.ca
- The Northern Miner, Sudbury: the basin that built a mining nation: northernminer.com
- Natural Resources Canada, updated critical minerals list: canada.ca
- Mining Technology, Vale Base Metals consortium for Thompson: mining-technology.com
- Mining Association of Canada, Quebec iron ore profile: mining.ca
- GeologyOntario portal: geologyontario.mndm.gov.on.ca
- Quebec SIGEOM: mrnf.gouv.qc.ca
- Saskatchewan, Mineral exploration and mining: saskatchewan.ca
- Yukon Geological Survey: geology.gov.yk.ca
- NWT Geoscience Office: nwtgeoscience.ca
- Johnson Shoyama School of Public Policy, Saskatchewan potash and BHP: schoolofpublicpolicy.sk.ca
Discussion
Questions, corrections or field experience? Share them below. First-time comments are reviewed before they appear, and your email is never published.
No comments yet. Be the first to add a question or your experience.

 G.I.T.T.
 Jaunita Erss Ltd
 Almosi SARL
 SRK Consulting
 Berks Gold Limited
 Mwerezi Minerals Company Limited
 Mining SARL
 SenGold Invest SAS
 Sean Mining Limited
 NTS Group (Pty) Ltd
 Mine4Africa
 Lithspo Minerals Limited
 Tintina Mining Group
 Dalgety Minerals Pty Ltd
 Vortex Minerals Pty Ltd

 Licence holder · Nigeria · Gold + lithium










