

US mining · State guide
US Mining Map: Active Mines by State and Sources
Nevada ranks first for US nonfuel mineral production at an estimated US$12.6 billion for 2025, ahead of Arizona and Texas. See the leading states, their major operating mines and the official maps that list active mines.
Key takeaways
- Nevada ranks first at an estimated US$12.6 billion of nonfuel minerals in 2025, then Arizona (US$10.4 billion) and Texas (US$10.2 billion) (USGS, 2026).
- Nevada mines about 64% of US gold and Arizona about 70% of US copper (USGS, 2025 estimates).
- MSHA’s Mines Data Set lists every mine’s status, owner and commodity; USGS MRDS has not been systematically updated since 2011.
- Value rankings mix quarries with metal mines, so filter by commodity before you map.
- Alaska leads in silver and zinc output from a few large mines such as Red Dog (Alaska DGGS, 2026).
In this article
- Which US states produce the most minerals by value
- Nevada: the gold state, with copper and lithium growing
- Arizona: the copper centre of the US
- Alaska: zinc, silver and gold from remote mines
- Utah: Bingham Canyon and the Great Basin
- Minnesota and Michigan: the iron ore belts
- Montana and California: two states people search for
- Where US metals are mined: gold, copper, silver, zinc and iron
- How to find active mines on official maps and databases
- Build your own active-mine map in five steps
- What satellite imagery adds to a mining map
- Estimate a mine's yearly output value
- Frequently asked questions
The US mining map has a clear centre of gravity in the West. In the USGS Mineral Commodity Summaries 2026, Nevada ranks first for the value of nonfuel mineral production at an estimated US$12.6 billion for 2025, followed by Arizona (US$10.4 billion), Texas (US$10.2 billion) and Alaska (US$6.41 billion). This guide ranks the leading states, names the major operating mines in each, and shows which official maps and databases list active mines, so you can build a working map for any state yourself.
One warning before the list: “active mine” means different things in different datasets. A federal safety register counts a quarry as readily as a gold mine, a USGS deposit database counts historic pits, and a state directory may leave out part-time operations. The sections below explain what each source includes, so you pick the right one for your question.
Which US states produce the most minerals by value
The USGS estimated the value of US nonfuel mineral production at US$112 billion in 2025, using data available through 17 December 2025. Nine states topped US$3 billion of publishable value and another 14 passed US$1.5 billion (USGS, Mineral Commodity Summaries 2026). “Nonfuel” means everything dug out of the ground except coal, oil and gas, so crushed stone, cement and sand and gravel sit beside gold and copper.
Chart
Value of nonfuel mineral production, top 8 states
US$ million, 2025 preliminary estimate
That mix is the first thing to understand about any US mining map. Texas ranks third by value, but its leading products are cement, lime, sand and gravel and crushed stone. Nevada, Arizona and Alaska rank high because of metals. A map built only from value rankings will therefore mix quarries and metal mines unless you filter by commodity.
| Rank | State | Value, 2025 estimate (US$ million) | Share of US total | Leading commodities (USGS) |
|---|---|---|---|---|
| 1 | Nevada | 12,600 | 11.26% | Copper, diatomite, gold, construction sand and gravel, silver |
| 2 | Arizona | 10,400 | 9.28% | Cement, copper, molybdenum concentrates, sand and gravel, crushed stone |
| 3 | Texas | 10,200 | 9.12% | Cement, lime, sand and gravel, crushed stone |
| 4 | Alaska | 6,410 | 5.73% | Gold, lead, sand and gravel, silver, zinc |
| 5 | California | 5,860 | 5.24% | Boron minerals, cement, gold, sand and gravel, crushed stone |
| 6 | Florida | 3,020 | 2.70% | Cement, phosphate rock, sand and gravel, crushed stone |
| 7 | Utah | 3,930 | 3.51% | Cement, copper, gold, salt, sand and gravel |
| 8 | Missouri | 3,420 | 3.06% | Cement, lead, lime, industrial sand, crushed stone |
| 9 | Minnesota | 3,160 | 2.83% | Iron ore, lime, sand and gravel, crushed stone |
| 10 | Michigan | 2,870 | 2.57% | Cement, iron ore, salt, sand and gravel, crushed stone |
Source for the table: USGS Mineral Commodity Summaries 2026, table 3. Values are rounded and preliminary. USGS ranks states on totals that include figures withheld to protect company data, while the published values for some states (Florida and Minnesota, for example) are partial, which is why Florida shows a lower figure than Utah despite its higher rank.
Montana, the state many readers search for, ranks 29th at US$1.15 billion, with cement, copper, molybdenum concentrates, palladium metal and sand and gravel as its main products. We return to it below.
Nevada: the gold state, with copper and lithium growing
Nevada produced 3,479,748 troy ounces of gold in 2024, worth US$8.29 billion, according to the Nevada Division of Minerals, which also credits the state with about 70% of US gold output (Nevada Division of Minerals, May 2026 update). The USGS puts Nevada’s share of the 2025 US total at about 64%. The two figures cover different years and different counting methods, so quote the one that matches your year.
Chart
Nevada mineral production, selected commodities, 2024
Value in US$ million; aggregates (US$311M) and geothermal energy (US$324M) are not shown
The same Nevada summary lists 5.7 million ounces of silver, 144.9 million pounds of copper, 7.68 million pounds of lithium compounds shipped, and more than 14,000 people employed in mining at an average yearly pay of US$121,000.
Major operating mines and projects in Nevada
- Nevada Gold Mines: a joint venture in which Newmont holds a 38.5% interest (Newmont operating statistics). The Division’s list of projects to watch names Goldrush and Fourmile, Twin Creeks and Turquoise Ridge, and the Phoenix copper project.
- Robinson (KGHM): a copper operation on the Division’s watch list.
- Other gold projects: AngloGold Ashanti’s Arthur project, Centerra’s Goldfield, Solidus Resources’ Spring Valley and I-80 Gold’s Lone Tree autoclave and other projects.
- Lithium: the USGS reports that US commercial-scale lithium production comes from one continental brine operation in Nevada. Thacker Pass (Lithium Americas) and Rhyolite Ridge (ioneer) are listed by the Division as projects in development. Our guide to Nevada lithium mines compares five of them by reserve.
For a ranked view of gold producers across all states, see our list of the largest active gold mines in the USA by ounces.
Arizona: the copper centre of the US
Arizona accounts for roughly 70% of US copper output, with the rest mined in Alaska, Michigan, Missouri, Montana, Nevada, New Mexico and Utah. The USGS counts 26 copper-recovering mines in the US, 17 of which produced more than 99% of mine output, and values 2025 US copper mine production at about US$11 billion (USGS, Mineral Commodity Summaries 2026, Copper).
Major operating mines in Arizona
Freeport-McMoRan reports that it manages seven US copper operations, five of them in Arizona: Morenci, Bagdad, Safford (including Lone Star), Sierrita and Miami. It holds a 72% interest in Morenci through an unincorporated joint venture, and operates a copper smelter and rod mill at Miami, Arizona (Freeport-McMoRan annual report, 10-K for 2025). Morenci, Cerro Verde (Peru) and Grasberg (Indonesia) together made 70% of Freeport’s copper in 2025.
The Arizona Geological Survey and the State Mine Inspector counted 433 active, full-time mines or development projects in Arizona in fiscal year 2021 (380 in fiscal year 2019), and publishes a directory with a spreadsheet and a Google Earth file for each edition (AZGS release of the 2021 directory; the 2019 directory page links the web map). In the 2021 directory, 294 of the 433 were aggregate sites, 67 were building stone and only 27 were metal mines, which again shows why you filter by commodity. For US copper companies ranked by output, see our US copper mining companies ranking.
New Mexico is also on the USGS copper list: Freeport-McMoRan operates the Chino and Tyrone copper mines there, alongside its Arizona operations (Freeport-McMoRan, 10-K for 2025).
Alaska: zinc, silver and gold from remote mines
Alaska ranks fourth by value and is the leading silver-producing state, ahead of Nevada (USGS, Mineral Commodity Summaries 2026, Silver). It produces about 22% of US gold, mostly from lode mines plus several large placer mines. The Alaska Division of Geological and Geophysical Surveys counted seven lode mines, about 150 placer gold mines and about 60 exploration projects in 2025, with estimated output of 510,000 to 522,000 tonnes of zinc and 925,000 to 955,000 troy ounces of gold (Alaska DGGS, 2025 mining industry overview).
Major operating mines in Alaska
- Red Dog (zinc and lead): 100% owned and operated by Teck Alaska on land leased from the NANA Regional Corporation (Teck annual information form). Teck’s 2025 annual information form lists Teck Alaska as owner and operator, and the DGGS lists 2025 zinc production of 462,700 tonnes.
- Fort Knox (Kinross): an open-pit gold mine near Fairbanks, expected to produce about 450,000 ounces in 2025 including ore trucked from Manh Choh.
- Manh Choh (Kinross 70%, Contango ORE 30%): a gold-silver-copper skarn that poured its first gold in July 2024, with ore trucked about 225 miles to the Fort Knox mill.
- Pogo (Northern Star): an underground gold mine producing about 274,000 ounces in 2025.
- Greens Creek (silver, zinc, lead) and Kensington (gold, Coeur): two underground mines in the Southeast; Greens Creek was reported at about 8.7 million ounces of silver for 2025 (a November 2025 estimate) and Kensington guided to 98,500 to 108,500 ounces of gold for 2025.
If you plan to stake ground in the state, our guide on how to get a gold claim in Alaska lists the steps and costs. For Alaska deposit records, the USGS Alaska Resource Data File is described as the most coherent collection of such reports for the state (USGS Mineral Resources Online Spatial Data).
Utah: Bingham Canyon and the Great Basin
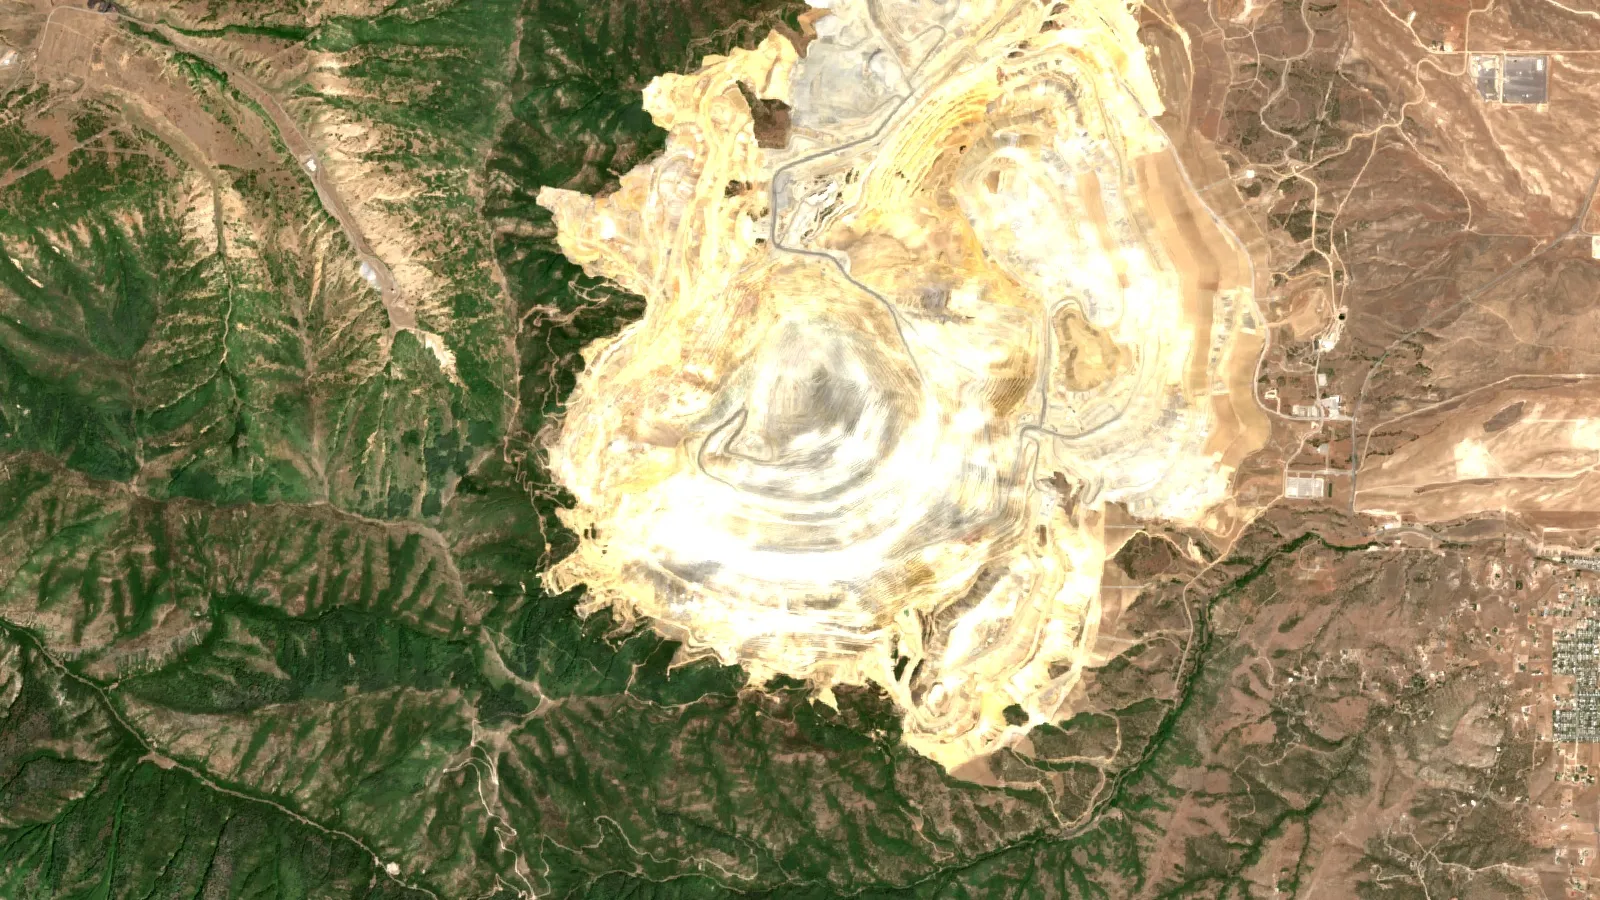
Utah ranks seventh at US$3.93 billion, with cement, copper, gold, salt and sand and gravel as its leading products. Its largest metal operation is the Bingham Canyon Mine, which Rio Tinto Kennecott describes as a world-class copper mine founded in 1903 that runs 24 hours a day, every day of the year (Rio Tinto Kennecott). Our explainer on who owns the Kennecott copper mine covers ownership and output. The USGS notes that iron ore from eight open-pit mines in Michigan, Minnesota and Utah supplied 98% of US usable iron ore products in 2025.
Minnesota and Michigan: the iron ore belts
Minnesota ranks ninth at US$3.16 billion (a partial total), led by iron ore. Michigan ranks tenth at US$2.87 billion. The USGS estimates US iron ore production at 38 million tons in 2025, valued at about US$3.38 billion, down 25% from 2024.
Taconite mines in Minnesota
Minnesota Power’s 2022 industrial customer fact sheet names the Iron Range taconite operators (Minnesota Power fact sheet). Cleveland-Cliffs owns Minorca (Virginia), Northshore Mining (Babbitt and Silver Bay) and United Taconite (Eveleth and Forbes), and holds a majority share of Hibbing Taconite. In March 2025 the company idled Minorca indefinitely and partly idled Hibbing Taconite; the USGS notes that the two mines together are rated for 10 million tons a year. U.S. Steel operates Minntac and Keewatin Taconite (Keetac) and holds a partial share of Hibbing. Taconite is a low-grade iron ore that is crushed, concentrated and rolled into pellets for blast furnaces. Ownership and idling decisions change quickly, so confirm each operator’s status with its latest report.
Montana and California: two states people search for
Active mines in Montana
Montana’s USGS commodity list is cement, copper, molybdenum concentrates, palladium metal and sand and gravel. The USGS reports that one company in Montana mined and processed platinum-group metals in 2025, with value down 31% to about US$290 million because one operation stayed on care-and-maintenance status. The USGS names Montana among the states that mine copper.
- Stillwater (Sibanye-Stillwater, platinum and palladium): Sibanye-Stillwater reported US PGM mined production of 284,069 ounces (2E basis) for 2025 and placed the Stillwater West mine on care and maintenance in the restructuring that began in late 2024 (Sibanye-Stillwater half-year report, 2025).
- Continental mine, Butte (Montana Resources): an open-pit copper and molybdenum mine with crushers and a concentrator, privately owned by The Washington Companies. The company reports more than 2.5 billion pounds of copper produced since 1986 and reserves projected to support mining through 2054 (Montana Resources).
To list other Montana operations, filter the MSHA mines list (described below) for Montana, status Active, and commodity metal.
Active mines in California, and a California mineral map
California ranks fifth at US$5.86 billion. The USGS lists boron minerals, cement, gold, sand and gravel and crushed stone as its main products. Its best-known critical-mineral site is the Mountain Pass Rare Earth Mine and Processing Facility in San Bernardino County, which MP Materials describes as the only rare earth mining and processing site of scale in North America (MP Materials, 2025 Form 10-K). Mesquite (Equinox Gold) is an open-pit, run-of-mine heap leach gold mine in Imperial County that produced 85,970 ounces of gold in 2025 (Equinox Gold). For boron, the USGS lists boron minerals first among California’s products. See our US rare earth minerals map for the national picture, and our California gold claims guide if you plan to hold ground there. For a statewide California mineral map, start with the USGS MRDS and USMIN layers below, then add the California Geological Survey’s Mineral Land Classification layer, which shows where the survey has studied mineral resources (CGS mineral resources map service).
Where US metals are mined: gold, copper, silver, zinc and iron
Looking at one metal at a time gives a cleaner map than looking at state totals. These are the USGS 2025 estimates:
Chart
US gold mine production, 2021 to 2025
Metric tons of gold
- Gold: about 160 metric tons from more than 40 lode mines in 12 states plus placer mines in Alaska; Nevada about 64% and Alaska about 22%; the top 25 operations gave about 94% of output.
- Copper: about 1.0 million metric tons recoverable; Arizona about 70%.
- Silver: about 1,100 tons from 4 silver mines and 31 base- and precious-metal operations in 12 states; Alaska first, Nevada second.
- Zinc: mined in five states at six operations by five companies, worth about US$2.2 billion.
- Iron ore: eight open-pit mines in Michigan, Minnesota and Utah.
US gold mine output fell from 187 metric tons in 2021 to an estimated 160 in 2025, even as its value rose 32% in 2025 on the gold price (USGS, Gold). The chart above shows tonnes, not value. The top 25 operations give about 94% of the mined gold, so a short list of large mines covers most of the output.
How to find active mines on official maps and databases
No single federal map shows every active mine. These are the sources professionals combine, from most to least current.
MSHA Mine Data Retrieval System
The Mine Safety and Health Administration’s Mine Data Retrieval System gives mine-by-mine data for all coal and metal/nonmetal mines and contractors in the United States, Puerto Rico and the Virgin Islands (MSHA data sources and calculators). It is the closest thing to a national register of operating mines, because it covers every coal and metal/nonmetal mine under MSHA jurisdiction. The tool itself is on the MSHA Mine Data Retrieval System page.
MSHA open government datasets
MSHA also publishes bulk files. Its Mines Data Set lists all coal and metal/nonmetal mines under MSHA jurisdiction since 1 January 1970, including each mine’s current status (Active, Abandoned, NonProducing and others), current owner and operating company, commodity codes and physical attributes (MSHA open government data). Other datasets, such as inspections and employment, use the Mine ID to link back to it. Because the file includes quarries and abandoned sites, filter by status and commodity before you map.
USGS Mineral Resources Online Spatial Data
The USGS hosts several map layers at mrdata.usgs.gov, and they answer different questions:
- MRDS (Mineral Resources Data System): reports on metallic and nonmetallic resources with deposit name, location, commodity, geology, production and reserves. The USGS states it stopped systematic updates to MRDS in 2011, so treat it as a historic deposit index, not a list of operating mines (USGS MRDS).
- USMIN Mineral Deposit Database: a developing national database meant to become an authoritative source on the most important mines, deposits and districts in the United States, with a search by critical mineral, commodity, state and location type, and downloads by commodity for a set of critical minerals (USGS USMIN deposit database).
- Mine-related features on USGS topographic maps: symbols for open pits, shafts, adits, tailings and gravel pits digitized from historical topographic maps of the western US, available as WMS, WFS and KML (USGS USMIN topographic features). These show where mining happened, not what operates today.
State geological surveys and mining agencies
State bodies often hold the freshest local data. The Nevada Division of Minerals publishes annual production by commodity and a list of projects to watch. The Alaska DGGS publishes an annual industry overview and maintains the Alaska Resource Data File. The Arizona Geological Survey publishes a directory of active mines with a web map and a Google Earth file. Use these for the state you care about and the federal sources for cross-state comparisons.
| Source | Best for | Limit |
|---|---|---|
| MSHA Mine Data Retrieval System | Current status, owner, commodity and employment by mine | Includes quarries; safety register, not a resource map |
| USGS MRDS | Deposit history, geology and reserves records | No systematic updates since 2011 |
| USGS USMIN deposit database | Important mines and districts, downloads by commodity | Still being built |
| USGS topographic mine features | Historic pits, shafts and tailings in the West | Historic symbols, not current status |
| State surveys (Nevada, Alaska, Arizona) | Annual production and local directories | One state each; years differ |
Build your own active-mine map in five steps
- Pick the question. Operating metal mines, quarries, or deposits with future potential? That decides which dataset you use.
- Download the MSHA Mines Data Set and keep rows with status Active, New Mine, Intermittent or Temporarily Idled in your state, depending on the question. Some rows have no latitude or longitude, so check for blanks before you plot.
- Filter by commodity codes to separate metals from sand, gravel and stone.
- Add context from the USGS layers (USMIN deposits and topographic features) in a GIS program such as QGIS, using their WMS or WFS addresses, which the USGS pages list.
- Check names against a company filing or state report for the large mines, since ownership and operating status change. The company reports cited above show how to do this.
The video below walks through reading a mining GIS map: licence boundaries, detected zones and live statistics on satellite imagery.
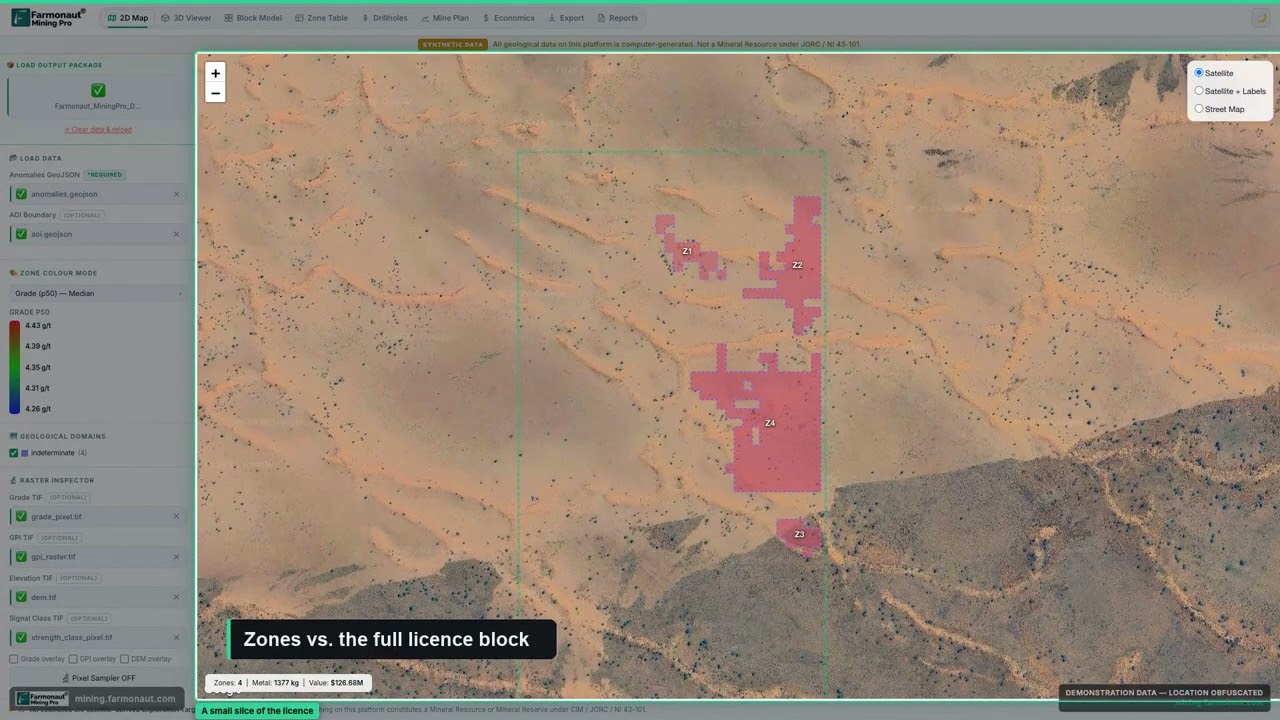
▶ A tour of reading a mining GIS map: licence boundaries, detected zones and live statistics on satellite imagery. · 5:38
What satellite imagery adds to a mining map
Registers say who is mining and where the office is. They do not show the size of a pit, a new waste dump or altered ground beside a known mine. Open satellite imagery such as Sentinel-2 can show this, and the USGS Earth Mapping Resources Initiative (Earth MRI) has collected new hyperspectral data over parts of Arizona, California, Idaho, Nevada, New Mexico, Oregon, Texas and Utah (USGS, Mineral Commodity Summaries 2026). For a licence or claim owner, imagery helps screen ground before you buy it or drill it. Farmonaut produces satellite-based mineral detection reports for a licence boundary; treat any such output as an exploration target that sits ahead of a drill-tested resource.
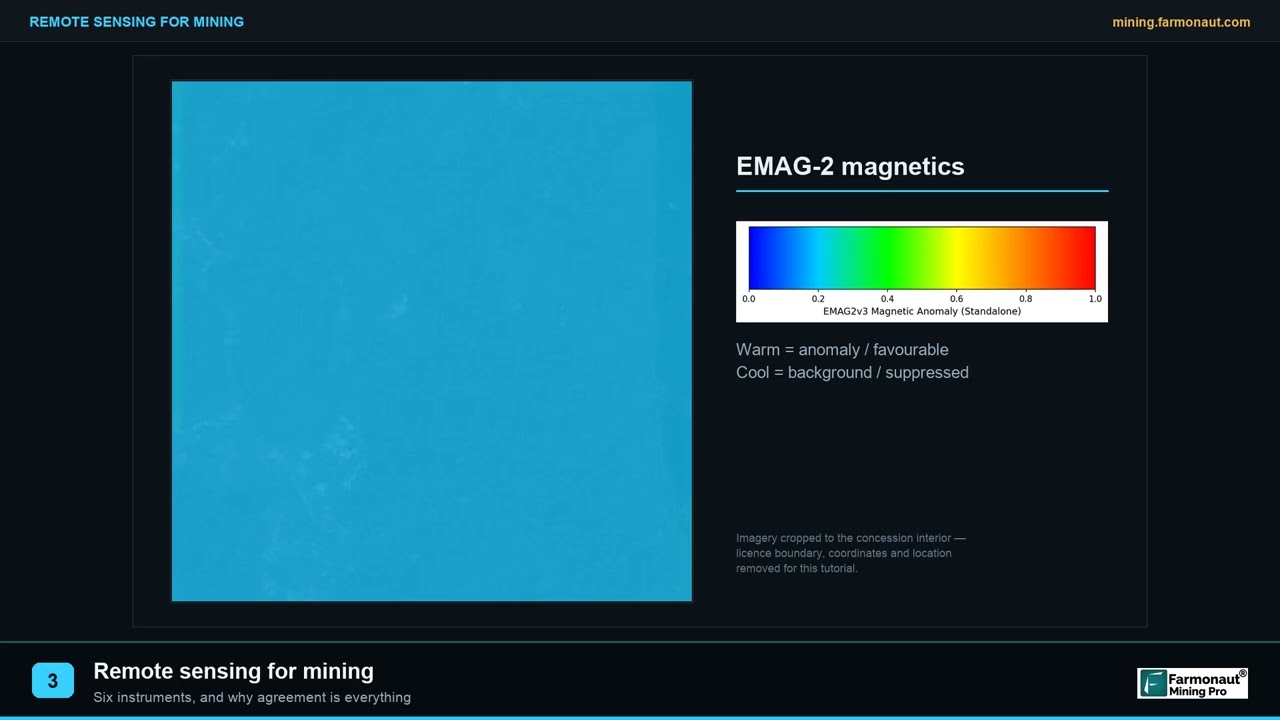
▶ Remote sensing for mining in three minutes: the instrument families and why agreement between them matters. · 2:01
Estimate a mine’s yearly output value
State rankings are built from mine-by-mine production. The calculator below converts tonnes milled, grade and recovery into ounces and revenue, so you can compare a mine you read about with the state figures above. Enter your own numbers, and use today’s gold price.
Calculator
What is a gold mine’s yearly output worth?
Enter ore tonnes, grade and recovery from a mine report, plus a price.
- Gross value at your price: $744,369,605
- Share of Nevada 2024 gold ounces: 6.2 %
Example values only, not a benchmark. The example price of US$3,430 per ounce is the 2025 average quoted by the Nevada Division of Minerals (May 2026); use today’s price. Costs, royalties and taxes are not included.
Wyoming’s rare earth projects are covered in Wyoming rare earth deposits.
Frequently asked questions
Which US state has the most mines?
By value of output, Nevada leads at an estimated US$12.6 billion in 2025 (USGS). By count of active operations, states with large aggregate industries, such as Texas, lead, because crushed stone and sand and gravel pits far outnumber metal mines.
What is the top gold-producing state?
Nevada, with about 64% of 2025 US gold production, followed by Alaska at about 22% (USGS).
Which state produces the most copper?
Arizona, at about 70% of US output (USGS, 2025 estimate). Utah, New Mexico, Montana and Nevada also mine copper.
Where can I see a map of all active mines in the US?
No single official map covers every one. Use the MSHA Mine Data Retrieval System or Mines Data Set for status, then add USGS layers and your state survey for geology and deposit context.
Are USGS MRDS records current?
No. The USGS stopped systematic updates in 2011. Use it for history and geology, and use MSHA or state data for current status.
How many active mines are in Arizona?
The Arizona Geological Survey counted 433 active, full-time mines or development projects in fiscal year 2021, of which 294 were aggregate sites and 27 were metal mines.
Which US states have active lithium mining?
Nevada. The USGS reports that US commercial-scale lithium production comes from a continental brine operation there.
What does a mine’s MSHA ID tell me?
It is the key that links the mine to inspections and other MSHA datasets, so you can follow a single operation across datasets.
Where are the largest iron ore mines in the US?
Eight open-pit mines in Michigan, Minnesota and Utah shipped 98% of US usable iron ore in 2025 (USGS), with the Iron Range taconite operations in Minnesota as the largest group.
Can I use a US mining map to stake a claim?
A map shows context only. Claims need a land status check with the Bureau of Land Management or the state, and permission from the landowner. See our state guides for Alaska and California for the steps.
This page is for information only. It is not investment advice or legal advice. Confirm land status, permission and licensing with the landowner and the regulator before any site work.
Farmonaut mining
Map your mining site from space
Send a licence or claim boundary and get a satellite-based screening report for the ground.

Mining Pro sample view, synthetic data
Keep reading
Sources
- USGS, Mineral Commodity Summaries 2026: pubs.usgs.gov
- USGS, Mineral Commodity Summaries 2026: Gold: pubs.usgs.gov
- USGS, Mineral Commodity Summaries 2026: Copper: pubs.usgs.gov
- USGS, Mineral Commodity Summaries 2026: Iron Ore: pubs.usgs.gov
- USGS, Mineral Commodity Summaries 2026: Silver: pubs.usgs.gov
- USGS Mineral Resources Data System (MRDS): mrdata.usgs.gov
- USGS USMIN Mineral Deposit Database: mrdata.usgs.gov
- USGS, mine-related features on topographic maps: mrdata.usgs.gov
- MSHA, Data Sources and Calculators: msha.gov
- MSHA, Mine Data Retrieval System: msha.gov
- MSHA, Open Government Data: arlweb.msha.gov
- Nevada Division of Minerals, State of Nevada Mining (May 2026): minerals.nv.gov
- Alaska DGGS, 2025 Alaska Mining Industry Overview: dggs.alaska.gov
- Arizona Geological Survey, Active Mines in Arizona: azgs.arizona.edu
- Freeport-McMoRan, Form 10-K for 2025: s22.q4cdn.com
- Newmont, Q2 2026 operating statistics: s24.q4cdn.com
- Teck, 2025 Annual Information Form: teck.com
- Minnesota Power, Large Industrial Customer Fact Sheet: lrl.mn.gov
- Rio Tinto Kennecott visitor experience: riotinto.com
- MP Materials, 2025 Form 10-K: s25.q4cdn.com
- Sibanye-Stillwater, half-year 2025 report: sec.gov
- Montana Resources, About: montanaresources.com
- Equinox Gold, Mesquite gold mine: equinoxgold.com
- California Geological Survey, Mineral Resources Program map service: gis.conservation.ca.gov
- Arizona Geological Survey, Directory of Active Mines FY2021 release: azgs.arizona.edu
Discussion
Questions, corrections or field experience? Share them below. First-time comments are reviewed before they appear, and your email is never published.
No comments yet. Be the first to add a question or your experience.

 Imperial Impex FZE
 Congo Mining Solutions
 Mining SARL
 SenGold Invest SAS
 Sania Corporation
 Sean Mining Limited
 NTS Group (Pty) Ltd
 Mine4Africa
 Lithspo Minerals Limited
 Tintina Mining Group
 Dalgety Minerals Pty Ltd
 Vortex Minerals Pty Ltd
 Faith At Work (Pty) Ltd
 Geotech Mining Solutions plc
 Vulcan International Limited
 Kidepo Associates
 GKY Mining
 Alkimy SARL
 Double A Trading
 GemSprout Metals Limited
 Qader Group
 Ileys General Trading
 SG Gold Mining LLC











