

Mining studies · Stage guide
Pre-Feasibility Study in Mining: Stages, Cost, Accuracy
A pre-feasibility study picks the mining method and process route and tests the economics well enough to convert indicated and measured resources into reserves. It sits between a scoping study and a feasibility study.
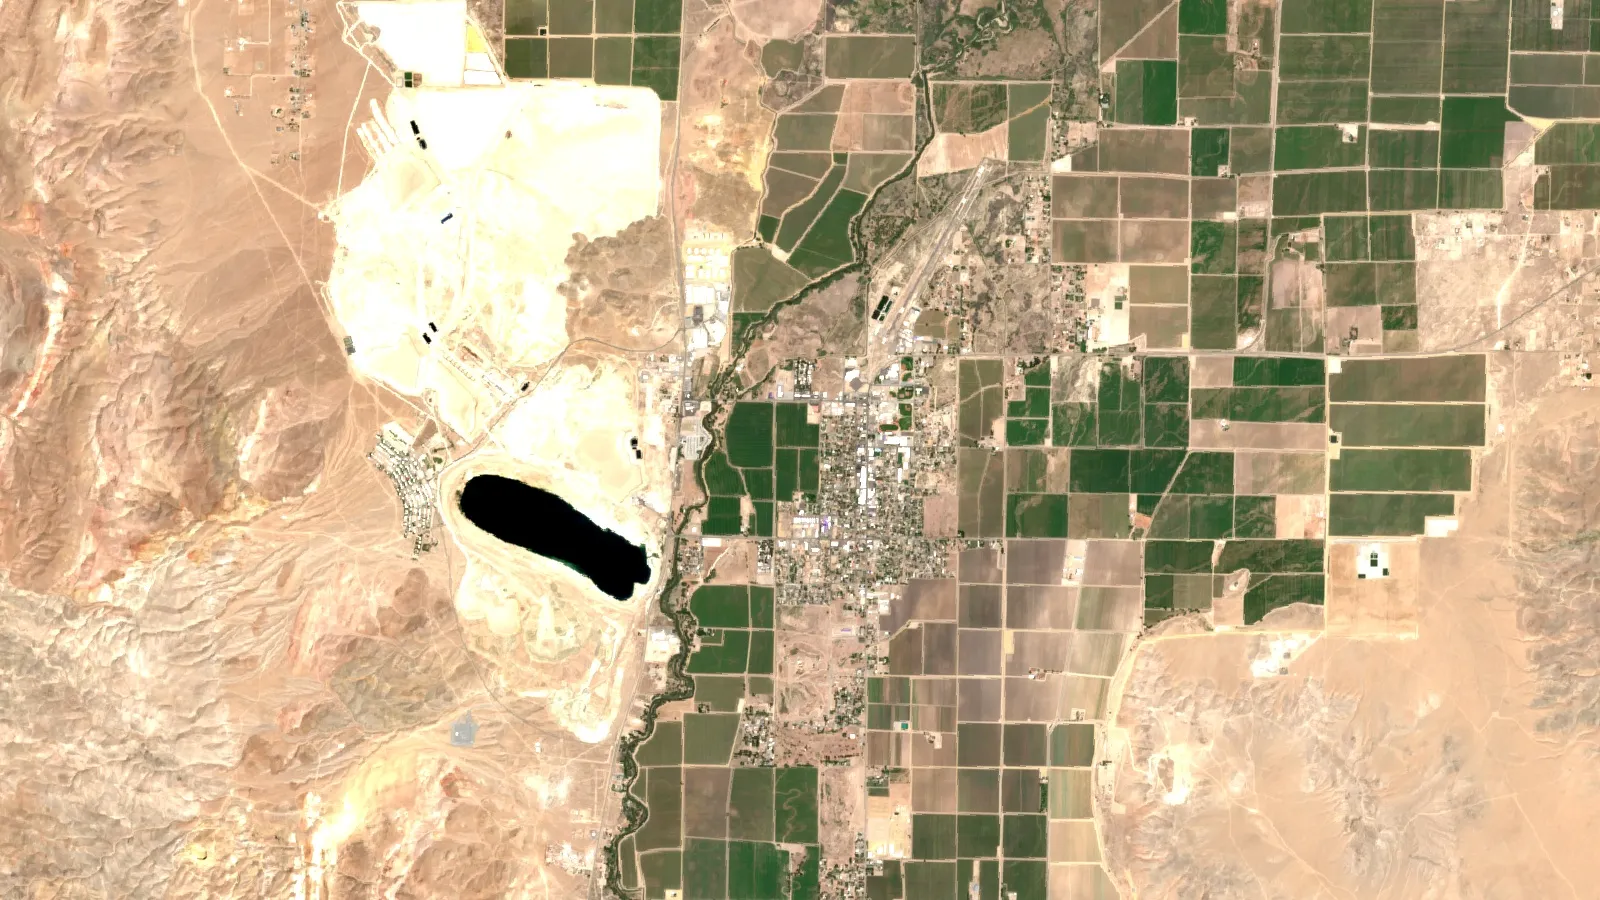
Key takeaways
- A PFS is the minimum study stage that can support a mineral reserve; a scoping study or PEA cannot (CIM 2014, JORC 2012, SEC S-K 1300).
- DFS and BFS are market names for a feasibility study, the stage after the PFS (JORC 2012).
- AACE Class 4 estimates, common at PFS level, allow a capital overrun of 20% to 50% on the high side of an 80% range (AACE 47R-11, as reproduced by the University of Oviedo).
- Published budgets run from about US$28 million spent across drilling, a PEA and a PFS at Yerington to US$77 million approved for the Rhodes Ridge PFS (company filings, 2023 and 2025).
- Discovery to production averaged 15.7 years across 127 mines, with almost 12 years in discovery, exploration and studies (S&P Global Market Intelligence, 2024 NMA report).
In this article
- The three study stages side by side
- What a pre-feasibility study is in mining
- Scoping study, PEA and initial assessment: what the first study can and cannot say
- Definitive and bankable feasibility studies: what changes after the PFS
- Pre-feasibility study steps from scoping to reserve
- How accurate is a pre-feasibility study estimate
- What a pre-feasibility study costs and how long it takes
- How to read a pre-feasibility study announcement
- Before you pay for a study: a readiness checklist for owners
- Where satellite data fits before the first study
- Frequently asked questions
A pre-feasibility study (PFS) is the stage where a mining project stops being an idea and becomes a costed plan. It picks a preferred mining method or pit shape, settles an effective way to process the ore, and adds a financial analysis good enough for a qualified person to decide whether part of a mineral resource can become a mineral reserve, according to the CIM Definition Standards. It sits between a scoping study (a rough first look) and a definitive or bankable feasibility study (the document lenders and boards rely on). This guide explains each stage, what each one can and cannot claim, what studies cost, how accurate their numbers are, and how to read a study announcement without being misled.
It is written for licence and claim owners, consultants and investors. Everything here is general information about how studies are defined and reported. It is not advice on any company or project.
The three study stages side by side
Most mineral projects move through the same ladder. Each rung costs more, uses more drilling and engineering data, and carries a tighter margin of error. The names differ by country, so the table lists the common ones.
Infographic
From first look to construction decision
- 1Scoping studyOrder-of-magnitude look: is the deposit worth more spending?
- 2Pre-feasibility studyMining method and process route chosen, first reserve possible.
- 3Feasibility studyDetailed plan that can support financing.
- 4Financing and permitsLenders, partners and regulators test the plan.
- 5Construction decisionThe owner or board commits to build.
| Stage | Other names | Question it answers | Resource base | Can it support a reserve? |
|---|---|---|---|---|
| Scoping study | Preliminary economic assessment (PEA) in Canada; initial assessment in the US; order-of-magnitude study | Is this deposit worth spending real money on? | May lean partly on inferred resources, with warnings | No |
| Pre-feasibility study | PFS, preliminary feasibility study | Which mining method and process route, and does the plan pay? | Indicated and measured resources can convert | Yes, this is the minimum stage |
| Feasibility study | FS, definitive feasibility study (DFS), bankable feasibility study (BFS) | Is the chosen plan ready for a financing or construction decision? | Indicated and measured, drilled to a tighter spacing | Yes, at a higher confidence |
The rules behind the table come from the reporting codes. Canada’s National Instrument 43-101 adopts the CIM definitions and bars a company from calling a study a pre-feasibility or feasibility study unless it meets them. The JORC Code (2012) used in Australia says an Ore Reserve must not be reported from a scoping study. In the US, the SEC’s Regulation S-K 1300 definitions call the first study an initial assessment and place the PFS above it in confidence. For the resource categories themselves, see our guide to mineral resource estimation from inferred to measured.
What a pre-feasibility study is in mining
The CIM definition describes a PFS as a comprehensive study of a range of options for a mineral project. By the time it is finished, the preferred underground method or open pit configuration is set and an effective processing method is chosen. The SEC wording adds one more requirement that readers often miss: the study must also settle an effective plan to sell the product.
The financial analysis in a PFS rests on assumptions about what the codes call modifying factors. CIM lists them as mining, processing, metallurgical, infrastructure, economic, marketing, legal, environmental, social and governmental considerations. In plain terms, a PFS has to show that the rock can be dug, the metal can be recovered, the site can be powered and reached, the product can be sold, and the permits look obtainable.
A PFS reports a lower confidence than a feasibility study but a higher one than a scoping study. That ordering is written into the SEC definitions and the CIM standards. It is also why the PFS is the first study that can support a mineral reserve: it is the point where a qualified person, acting reasonably, can say that part of the indicated or measured resource is economic to mine.
Typical contents of a PFS technical report:
- A resource model, with the part that converts to reserve shown separately
- Mine design, schedule, dilution and recovery assumptions
- Metallurgical test results and a flowsheet
- Geotechnical, hydrogeological and tailings or waste storage work
- Site infrastructure, power, water and access
- Capital and operating cost estimates, with contingency
- Market and price assumptions
- Environmental baseline and the permitting path
- A cash-flow model with sensitivities (price, grade, cost, recovery)
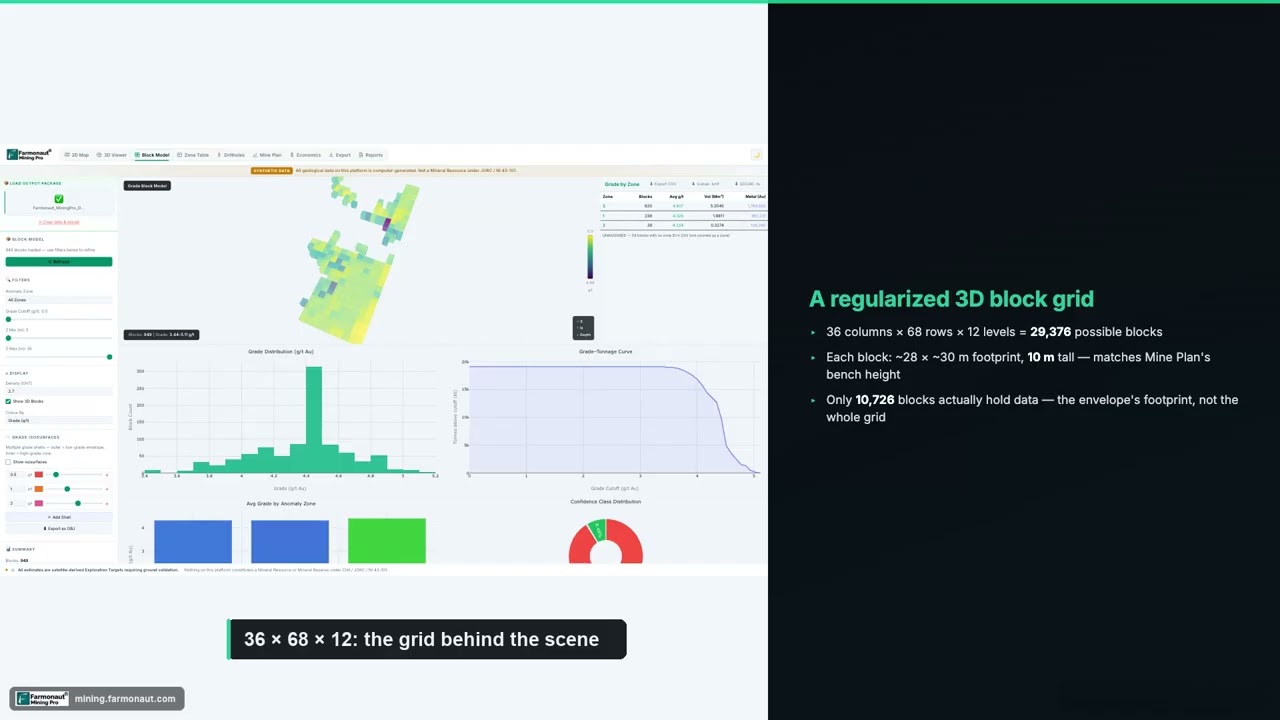
▶ Explains the block model, the 3D grid of rock blocks that mine plans and reserve estimates are built on. · 5:23
Scoping study, PEA and initial assessment: what the first study can and cannot say
A scoping study is cheap, quick and deliberately rough. The JORC Code calls it an order of magnitude technical and economic study whose job is to show that moving on to a PFS can be justified. It often borrows assumptions from similar deposits, so its numbers describe a concept, not a plan.
Canada allows a preliminary economic assessment to be built partly on inferred resources, which are the least certain category. NI 43-101 only permits this when the disclosure states with equal prominence that the assessment is preliminary, that it includes inferred resources too speculative to have economics applied to them, and that there is no certainty it will be realised. In Australia, the ASX takes a similar line. Its mining reporting FAQs say an entity may publish a production target or financial forecast from an early study only where there is a reasonable basis for it, and that inferred resources and exploration targets should not decide project viability.
What a scoping study cannot do is give you a reserve. The SEC says the same for an initial assessment: it supports resource disclosure, but it cannot be the basis for reserves. If a company news release shows a big net present value (NPV) from a scoping-level study, read it as a signal to keep studying, not a mine plan.
For a small owner, a scoping study is often the right first spend. It tells you, before drilling to tight spacing, whether grade, size, depth and metallurgy are anywhere near what a plant would need.
Definitive and bankable feasibility studies: what changes after the PFS
The CIM definition says a feasibility study can reasonably serve as the basis for a final decision by a proponent or a financial institution to proceed with or finance the project. JORC is explicit about the names: it treats Bankable Feasibility Study and Definitive Feasibility Study as equivalent to a feasibility study as defined in the Code. So DFS and BFS are market labels for the same stage, not extra tiers.
The JORC Code also notes that a full feasibility study is not required to convert resources to reserves. A PFS that has determined a technically achievable and economically viable mine plan is enough. This matters for owners deciding how far to go before a sale or a joint venture. Companies do declare a maiden reserve from a PFS: Solaris Resources reported one at Warintza in its PFS release.
What a feasibility study adds is depth: tighter drill spacing, more metallurgical and geotechnical testing, vendor quotes in place of factored costs, a detailed schedule and firm permitting. Our guide to the bankable feasibility study covers that last rung in detail, and the NI 43-101 technical report guide explains who signs the report and when it must be filed.
Pre-feasibility study steps from scoping to reserve
There is no single recipe, but the work usually runs in this order. Several tasks run in parallel, and metallurgical testing and geotechnical drilling tend to set the pace.
- Upgrade the resource. Infill drilling turns inferred ground into indicated or measured resource, because only those categories convert to reserve.
- Test the metallurgy. Composite samples that represent the orebody are run through the proposed process to show recovery, reagent use and product quality.
- Compare mining and processing options. A PFS is defined by choice: open pit against underground, heap leach against milling, owner mining against contract mining.
- Collect site data. Pit slope and ground conditions, groundwater, tailings and waste sites, water and power supply, roads and rail.
- Start the environmental baseline. Surveys, water monitoring and the map of what permits are needed and in what order.
- Estimate capital and operating cost. Costs are built from equipment lists, factored estimates and consultant benchmarks, with a stated contingency.
- Build the financial model. Cash flow, NPV, internal rate of return (IRR), payback, plus price, grade and cost sensitivities.
- Declare the reserve. The qualified person states what part of the resource passes the economic test.
- Report and review. The technical report is written, signed and, in Canada, filed; in Australia, the competent person’s statement goes into the market release.
Our guide to how to start a mine shows where these steps sit in the wider path from licence to production.
How accurate is a pre-feasibility study estimate
A PFS cost estimate is a range, not a number. The industry yardstick is AACE International’s recommended practice 47R-11, which sorts cost estimates into five classes by how much of the project is defined. Class 5 is a concept; Class 1 is close to a construction bid. The ranges charted here are expressed at an 80% confidence interval, as reproduced in a University of Oviedo study of copper-project capital estimates. Its authors also found the Kutcho PFS declared a plus or minus 25% accuracy at Class 4, while the Josemaría and Eva feasibility studies declared plus or minus 15% at Class 3.
Chart
Contingency in five reported studies
Contingency as a percent of initial capital, as reported by each study
Chart
How far a capital estimate can run over, by AACE class
Overrun side of the accuracy range, % above the estimate, 80% confidence interval
Look at the top of each range. A Class 4 study can be right and still see capital cost come in 50% over the estimate. For a Class 5 concept, the upper end reaches 100%. That is not a failure of the study, it is what the class means.
History suggests the ranges can be optimistic. The same paper summarises Bertisen and Davis, who reviewed 63 mining and smelting projects and found as-built capital costs averaged 14% above the bankable feasibility estimate, with about half of projects landing outside plus or minus 15%. It also summarises Lwin and Lazo, who studied 78 projects built between 1995 and 2015 and report an average overrun of 37%, ranging from 0% to just over 250%. These are secondary summaries of those studies, and each covers a different sample, so treat them as direction, not a forecast for your own project.
Contingency is the allowance written into the estimate for items not yet defined. In the studies the Oviedo authors compared, contingency on initial capital was 13.4% for the Arctic PFS and 15.0% for the Kutcho PFS, against 12.7% for the Josemaría feasibility study and 11.8% for Eva. Solaris Resources reported an overall contingency of 15.7% in the PFS for its Warintza copper project in Ecuador. Higher contingency in the earlier study is what you would expect, since less is defined.
Two practical points follow. First, when you see a single-figure capex in a headline, ask for the accuracy class and the contingency. Second, run your own downside: add the top of the range to capex and see whether the project still works. The calculator later in this guide does that in one step.
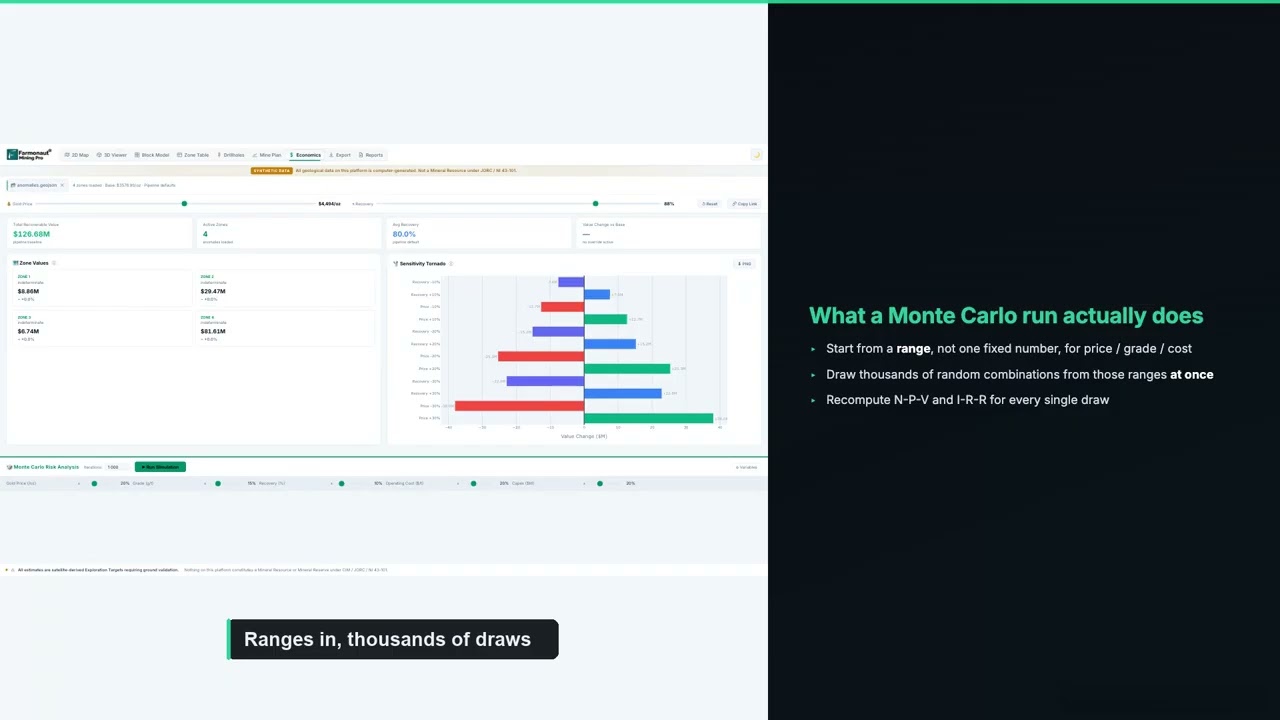
▶ Explains P10, P50 and P90 outcomes from a Monte Carlo run across price, grade and cost uncertainty. · 14:59
What a pre-feasibility study costs and how long it takes
Public cost figures for studies are scarce, because most companies disclose only a total exploration and development budget. Two filings give a real sense of the order of magnitude, and they sit at opposite ends of scale.
Chart
Published study spend and budgets
US$ million. Rhodes Ridge: approved PFS (iron ore). Yerington: drilling, environmental work, PEA and PFS (stages 1-2), then DFS and permitting (stage 3)
Rio Tinto approved a US$77 million (A$110 million) PFS for the Rhodes Ridge iron ore project in Western Australia in its December 2023 release, after an order-of-magnitude study that looked at an initial operation of up to 40 million tonnes a year. At the other end, a smaller copper project in Nevada shows how spending stacks up across stages. In a November 2025 filing, Lion Copper and Gold said its partner Nuton had invested about US$28 million on resource drilling, baseline environmental studies, a PEA (completed in the first quarter of 2024) and a PFS (completed in the third quarter of 2025). Stage 3 commits up to US$31 million for a definitive feasibility study and permitting.
The Yerington figures also show the clock: roughly 18 months between a PEA and a PFS on a project that already had drilling and a partner paying the bills. Rhodes Ridge’s PFS was planned to take about two years from approval. These are examples from well-funded projects. A small licence-holder will spend less, but the main spend is not the report writer. It is drilling, metallurgical testwork, geotechnical holes and baseline monitoring, and those scale with the size and difficulty of the ground.
The longer view is sobering. S&P Global Market Intelligence analysed 127 mines that came online since 2002 and found an average of 15.7 years from discovery to production, of which almost 12 years went on discovery, exploration and studies, as shown in the National Mining Association’s report using S&P data. A smaller sample of mines that started between 2020 and 2023 averaged 17.9 years. Studies are one part of that, and most of the time sits in drilling, financing and permitting.
If you are budgeting a study, do not use a percentage rule you cannot trace. Ask two or three consultants for fixed-scope quotes that list each deliverable, the data you must supply, and what is excluded. Drilling and testwork should be quoted separately from the report.
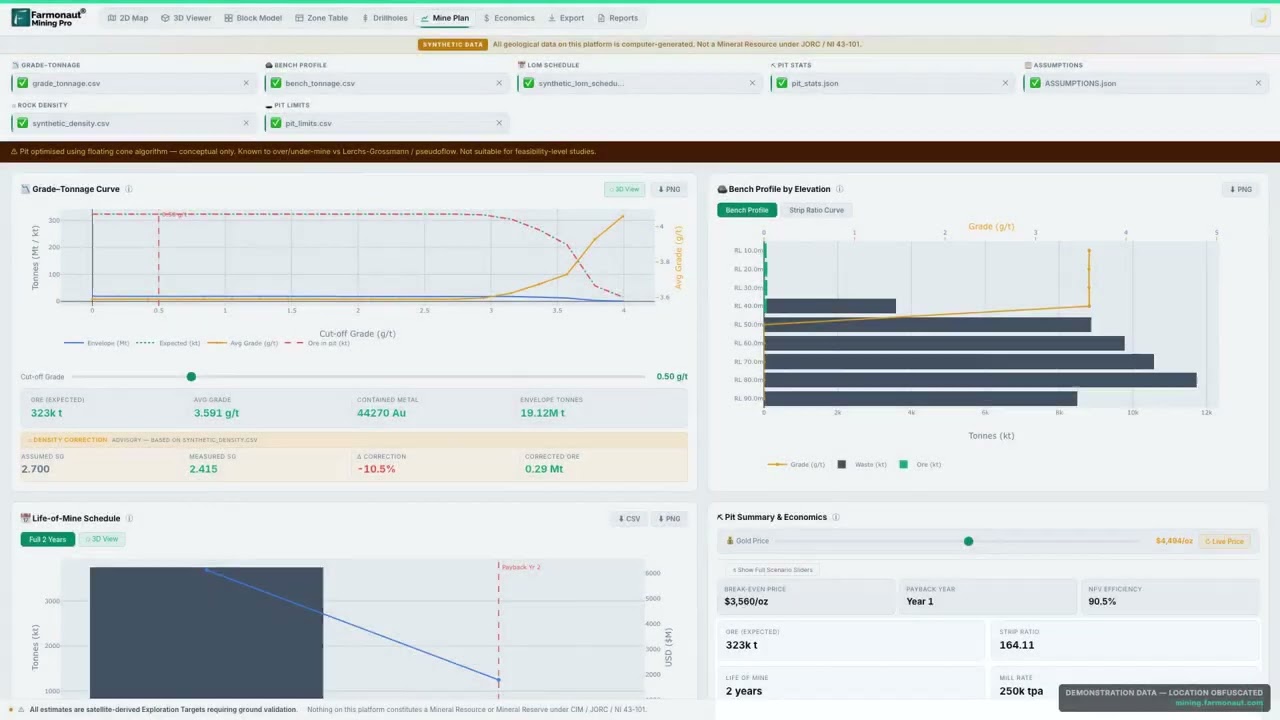
▶ Walks through all-in sustaining cost, break-even price, net present value and payback on a mine plan. · 14:58
How to read a pre-feasibility study announcement
Study results usually reach the public as a news release with a table of highlights. The table below shows five recent releases side by side. They are not a ranking and say nothing about the companies as investments; they show how much the headline depends on choices made inside each study.
Chart
How much after-tax NPV moves between two price cases
Percent rise in NPV between each study’s lower and higher published price case (price rise in the label)
| Project and release | Stage | Price case | Discount rate | After-tax NPV | Initial capital |
|---|---|---|---|---|---|
| Queensway gold, Newfoundland (21 July 2025) | PEA | US$2,500/oz | 5% | C$743 million | C$155 million (phase 1) |
| Copperstone gold, Arizona (27 May 2026) | PFS | US$3,500/oz | 5% | US$374 million | US$58.3 million |
| Santa Cruz copper, Arizona (23 September 2026) | PFS | US$4.75/lb | 8% | US$1.5 billion | US$1.43 billion |
| Warintza copper, Ecuador (6 November 2025) | PFS | US$4.50/lb copper (consensus) | 8% | US$4,617 million | US$3.7 billion |
| Black Pine gold, Idaho (8 September 2026) | FS | US$3,250/oz | 5% | US$2.4 billion | US$411.4 million |
What to check in any release like these:
- Stage name. Is it a PEA, PFS or FS? Under NI 43-101 an issuer cannot use PFS or FS unless the study meets the definition.
- Resource categories. Does the mine plan rest on indicated and measured resource, or on inferred? A PFS can support a reserve; a PEA cannot.
- Price case. Companies often show a base case and a spot case. Both are legitimate, but they are very different numbers, so check which one the headline uses.
- Discount rate. An NPV at 5% is not comparable to one at 8%. In the table, three studies use 5% and two use 8%.
- Currency and basis. The Queensway study states most amounts in Canadian dollars while giving the gold price in US dollars. Pre-tax and after-tax figures also differ.
- Capital and contingency. Is the contingency stated, and does the capital include owner costs, closure and working capital?
- The technical report. In Canada the supporting technical report must generally be filed within 45 days of the news release, and it contains the accuracy class and the full assumptions.
The sharpest test is how much the answer moves with price. Four of these five releases published results at more than one price (Warintza did not), so we can compare the swing. The chart in this section uses the NPVs and prices stated in the releases; the percentage rises are our own calculation from those rounded figures.
The swing is larger than the price move because costs are fixed: when the metal price rises, nearly all of the extra revenue falls to profit. The reverse also holds, which is why a PFS that only works at the spot price deserves a hard look. The Santa Cruz release, for example, shows an after-tax NPV of US$1.5 billion at the base copper price of US$4.75 a pound and US$3.5 billion at a spot case of US$6.79.
The calculator at the end of this section applies the same idea to your own numbers: it shows payback at the capex in a study and at the top of its accuracy range, and the metal price needed to cover capex over the mine life.
Calculator
What if capex lands at the top of the study range?
Enter a study’s capex, production and costs to see payback at the stated capex and at the top of its accuracy range.
- Capex at the top of the range (US$ million): 600.0
- Payback at the top of the range (years): 3.0
- Annual margin before tax (US$ million): 200.0
- Price that repays top-of-range capex over the mine life (US$/oz): 2,100
Example values only, not a forecast. Prices are inputs: example, use today’s price. Simple pre-tax, undiscounted payback on production at full rate; it ignores ramp-up, tax, sustaining capital and financing. The 50% default is the top of the AACE Class 4 high range (usual for a PFS); Class 3, used for feasibility studies, tops out at 30% (AACE RP 47R-11 as reproduced by the University of Oviedo). Change it to the range your study states.
Before you pay for a study: a readiness checklist for owners
A PFS only makes sense when the inputs exist. Spending on it too early produces a report full of placeholders. Work through this list first.
- Title and access. Clear ownership of the tenure, fees paid, and legal access to the ground. Our guide to how to sell a mine explains how buyers and partners test title before they look at any study.
- A resource that is mostly indicated or better. Inferred resource does not convert. If most of your ounces or tonnes are inferred, infill drilling comes before the PFS. See the JORC resource table guide for how the categories read in a report.
- Representative metallurgical samples. Core that matches the orebody, not only the best intervals.
- A realistic scale. Rough tonnage per year and mine life from a scoping study, so the PFS tests a plan that has a chance.
- A permitting path. You do not need permits at PFS stage, but you need to know which ones, in what order, and what baseline data they demand.
- Power, water and logistics. Distance and cost to connect are often the swing factor in cost estimates.
- A qualified person. A named professional with the right experience and a clear scope, because the report and any reserve carry their name.
- A budget with room. Add contingency to the study budget itself, not only to the capex inside it.
Where satellite data fits before the first study
Satellite imagery does not replace drilling or a PFS. Its use is earlier: screening ground, mapping surface alteration and structures, and choosing where the first holes should go, so that the data feeding a scoping study comes from the right place. Farmonaut turns a licence boundary (KML, KMZ or polygon) into a satellite mineral screening report in about 5 to 20 business days. The results are exploration targets that sit ahead of a resource estimate, and they are not a resource or reserve under any reporting code.
Frequently asked questions
What is a pre-feasibility study in mining?
It is a comprehensive study of a range of options for a mineral project, advanced to the point where a preferred mining method or pit configuration and an effective processing method are set. It includes a financial analysis and is the minimum study stage that can support converting a resource to a reserve under the CIM Definition Standards.
What is the difference between a scoping study and a PFS?
A scoping study is an order of magnitude look at whether the project justifies more work, and it cannot support a reserve. A PFS compares options in detail, uses indicated and measured resources, and can support a reserve. A PFS is also more expensive and takes longer.
What is the difference between a PFS and a DFS?
A definitive feasibility study (DFS) is the same stage as a feasibility study. It has higher confidence and more engineering detail than a PFS, and it is meant to support a final investment or financing decision. JORC treats bankable and definitive feasibility studies as equivalent to a feasibility study.
What is a PEA in mining?
A preliminary economic assessment is the Canadian name for the early economic study. It can include inferred resources if the disclosure carries the required warnings, and it cannot support mineral reserves. The US equivalent is an initial assessment.
How accurate is a pre-feasibility study?
Cost estimates at PFS level are often given at AACE Class 4, where the overrun side of the 80% range runs from 20% to 50%. Some studies declare a narrower range, such as plus or minus 25%. Actual projects have often cost more than study estimates, so a range is the honest reading.
How much does a pre-feasibility study cost?
It depends on size and difficulty. Public examples range from tens of millions of US dollars for a large iron ore project (about US$77 million approved for Rhodes Ridge) to roughly US$28 million spent across drilling, environmental work, a PEA and a PFS on a Nevada copper project. Small-project budgets are lower, but no standard public benchmark exists, so get fixed-scope quotes.
How long does a PFS take?
Two well-funded projects give a guide: Yerington took about 18 months between its PEA and PFS, and Rio Tinto planned about two years for the Rhodes Ridge PFS. The Yerington copper project went from a PEA in early 2024 to a PFS in the third quarter of 2025. Timing depends on drilling and metallurgical testwork, which usually set the critical path.
Who prepares and signs a PFS?
Engineering consultants prepare it, with specialists for geology, mining, processing, geotechnics and the environment. A qualified person (NI 43-101) or competent person (JORC) takes professional responsibility for the resource and reserve statements.
Can a company report reserves from a scoping study?
No. JORC says an Ore Reserve must not be reported from a scoping study, and the SEC says an initial assessment cannot be the basis for reserves. A PFS or feasibility study is required.
Is a PFS enough to get financing?
Usually not on its own. The CIM definition of a feasibility study says it can serve as the basis for a decision to finance, and a PFS is at a lower confidence level. Many projects use the PFS to attract partners and fund the feasibility study.
Does a positive PFS mean a mine will be built?
No. It means the plan looked viable on the stated assumptions. Metal prices, costs, permits, financing and land access can all change the outcome, and the studies themselves carry cautionary language.
This page is for information only. It is not investment or legal advice and it names companies only as examples of published study results. Reporting rules and study results can change; check the regulator and the company’s technical report. Prospecting needs landowner permission and a valid licence.
Farmonaut mining
Screen your ground before the first study
Request a quote to have your licence area screened with satellite data so early studies start from mapped targets.
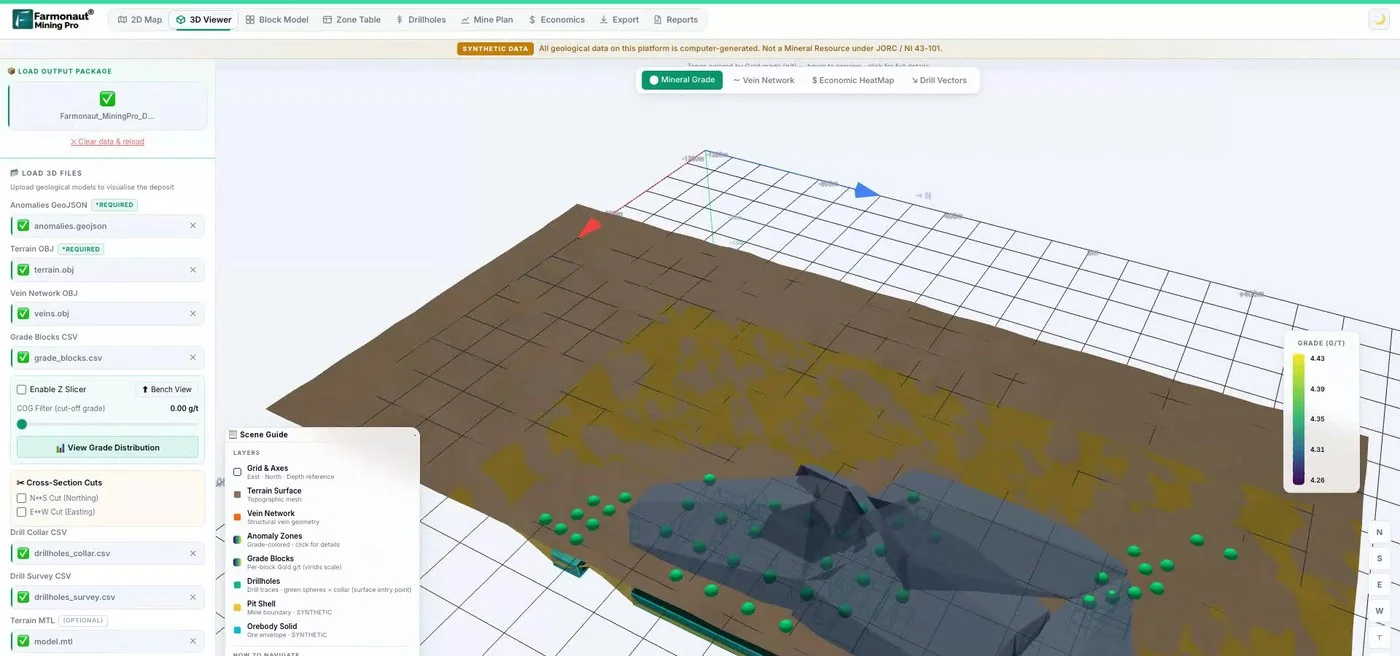
Mining Pro sample view, synthetic data
Sources
- CIM, CIM Definition Standards for Mineral Resources and Mineral Reserves (2014): mrmr.cim.org
- Canadian Securities Administrators, National Instrument 43-101 (consolidation, June 2023): osc.ca
- JORC, Australasian Code for Reporting of Exploration Results, Mineral Resources and Ore Reserves (2012): jorc.org
- ASX, Mining reporting FAQs: asx.com.au
- US SEC, 17 CFR 229.1300 (Regulation S-K 1300) definitions: law.cornell.edu
- Suarez Nieto et al., University of Oviedo, capital expenditure estimation in copper mining projects: digibuo.uniovi.es
- National Mining Association with S&P Global Market Intelligence, mine development times (June 2024): cdn.ihsmarkit.com
- Rio Tinto, Rhodes Ridge study phase release (5 December 2023), SEC exhibit 99.4: sec.gov
- Lion Copper and Gold, Stage 3 funding release (24 November 2025), SEC exhibit 99.1: sec.gov
- Ivanhoe Electric, Santa Cruz 2026 preliminary feasibility study release (23 September 2026): ivanhoeelectric.com
- Minera Alamos, Copperstone pre-feasibility study release (27 May 2026): theglobeandmail.com
- Liberty Gold, Black Pine feasibility study release (8 September 2026): bnnbloomberg.ca
- New Found Gold, Queensway preliminary economic assessment release (21 July 2025): newfoundgold.ca
- Solaris Resources, Warintza pre-feasibility study release (6 November 2025): solarisresources.com
Discussion
Questions, corrections or field experience? Share them below. First-time comments are reviewed before they appear, and your email is never published.
No comments yet. Be the first to add a question or your experience.

 Energy and Resources Ltd
 Mwerezi Minerals Company Limited
 Congo Mining Solutions
 Mining SARL
 SenGold Invest SAS
 Sania Corporation
 Sean Mining Limited
 NTS Group (Pty) Ltd
 Mine4Africa
 Lithspo Minerals Limited
 Tintina Mining Group
 Dalgety Minerals Pty Ltd
 Vortex Minerals Pty Ltd
 Faith At Work (Pty) Ltd
 Geotech Mining Solutions plc
 Vulcan International Limited
 Kidepo Associates
 GKY Mining
 Alkimy SARL

 Licence holder · Nigeria · Gold + lithium










