

Client case study · Copper and 3T minerals · Democratic Republic of the Congo
How 3T Mineral Exploration by Satellite Mapped 65 Copper, Tin, Tantalum and Tungsten Targets Across 761 ha in the DRC
3T mineral exploration by satellite screened two sites in the Democratic Republic of the Congo, about 761 hectares in all, for copper and for the tin, tantalum and tungsten suite known as the 3Ts. The analysis returned 65 ranked target zones across four commodities, each with a depth window and a drill direction, and the client reported saving 1 to 3 months and US$25,000 to US$50,000 before a single hole was drilled.
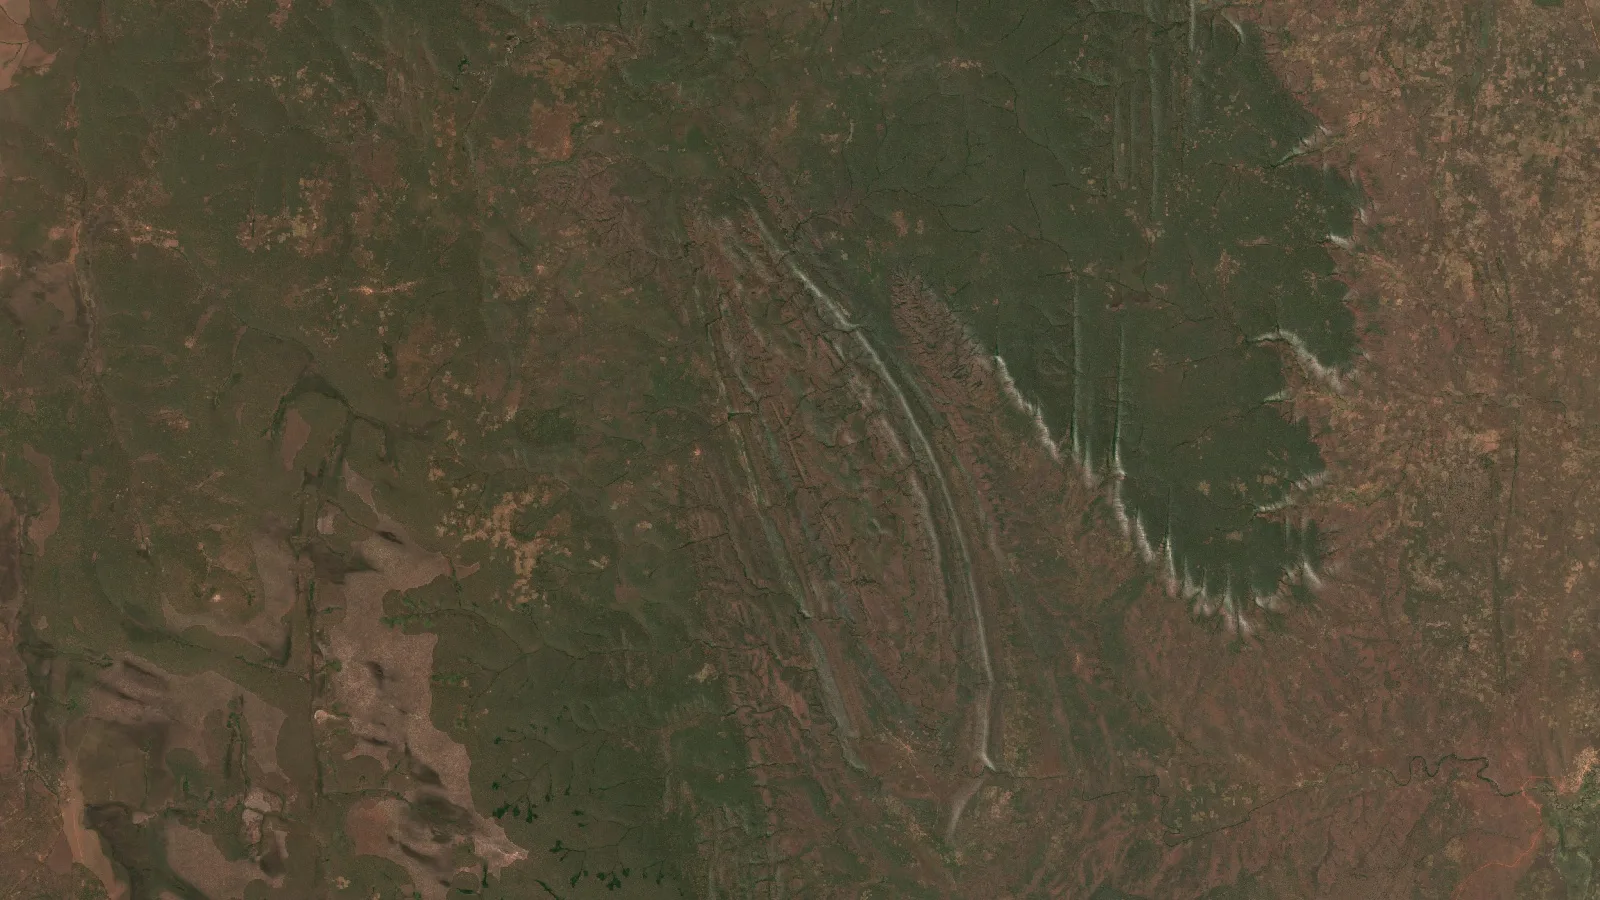
Key takeaways
- Two sites in the Democratic Republic of the Congo, about 761 ha in all, were screened from space for copper and for the 3T minerals: tin, tantalum and tungsten. Four reports returned 65 ranked target zones.
- On the copper site, 42 targets cover about 11% of the ground, and the five priority targets hold about two-thirds of the modelled copper.
- One boundary on the second site produced three target maps: 17 tungsten zones, 4 tantalum pegmatites and 2 tin zones, with overlap where tin and tungsten share ground.
- The 3T targets start shallow, about 9 to 18 m down for tungsten and tantalum, so trenching and short holes can test them first. All estimates are exploration-target bands, not resources.
- Before any drilling, the client reported saving 1 to 3 months and US$25,000 to US$50,000. These are the client’s own estimates.
In this article
- A two-site copper and 3T programme in the DRC
- Why copper and 3T ground suits satellite screening
- How the satellite analysis worked on both sites
- Site A: 42 copper targets on about a tenth of the ground
- Site B: tin, tantalum and tungsten from one boundary
- Depth, drill order and a combined drilling plan
- What the client reported after the report
- Lessons for copper and 3T explorers
- 3T mineral exploration in the DRC: frequently asked questions
A two-site copper and 3T programme in the DRC
This case study follows an exploration programme on two sites in the Democratic Republic of the Congo. The first site, Site A, about 338 hectares, was screened for copper. The second, Site B, about 423 hectares, was screened for three minerals at once: cassiterite, the main ore of tin; tantalite, the main ore of tantalum; and wolframite, an ore of tungsten. Together with gold, tin, tantalum and tungsten make up the minerals often called the 3Ts, and the DRC is one of the world’s most important sources of them.
That made this a demanding brief for 3T mineral exploration. Four commodities, two separate pieces of ground and very different deposit styles all had to be judged against each other. Copper in this part of the world is typically linked to large hydrothermal systems. Tin and tungsten usually come from greisens and quartz veins on the edges of granites. Tantalum usually comes from pegmatites, coarse-grained igneous dykes. Each style leaves a different fingerprint at the surface, so each needed its own analysis.
The client commissioned four Farmonaut Premium+ satellite reports: one for copper on the first site, and one each for cassiterite, tantalite and wolframite on the second. Every report screened the whole site in one pass and returned a ranked set of target zones, each with an estimated depth window, footprint, grade band and drill direction. The reports were delivered together, so the team could compare all four commodities side by side from the start.
This article walks through how the analysis worked on both sites, what each report found, how the targets line up into one drilling plan, and what the client recorded about the results afterwards.
Why copper and 3T ground suits satellite screening
Satellite screening works best when the sensors can see the ground, and much of the southern DRC offers good windows for it. The landscape is largely savanna and open woodland with a long dry season. When the grass dries out and the leaves thin, more bare soil and rock show through, and the faint colour differences that mark altered rock become easier to pick out.
The clues to all four commodities are in that altered rock. When hot, mineral-rich fluids move through the crust, they change the rocks they pass through. They leave behind clay minerals, white mica, silica, tourmaline and iron oxides. Each of these reflects sunlight in its own way, especially in the shortwave-infrared part of the spectrum. Each commodity has its own mix:
- Copper: iron-oxide caps, clay alteration and signs of supergene enrichment, where weathering has concentrated copper near the surface.
- Tin (cassiterite): greisen alteration, a mix of quartz, white mica and often tourmaline that forms on the roof of tin-bearing granites. The US Geological Survey’s review of tin deposits describes greisens and veins as classic tin hosts.
- Tantalum (tantalite): pegmatites rich in feldspar, quartz and mica. Tantalum often comes from the lithium-caesium-tantalum family of pegmatites, described in the USGS deposit model for LCT pegmatites.
- Tungsten (wolframite): quartz veins and greisens, often in the same systems as tin, which is why the two are so often explored together.
The same rock signals come back in image after image, year after year, while crops, fires and seasonal green-up come and go. That persistence is one of the strongest tests the analysis uses to tell geology apart from passing surface changes.

▶ An overview of the DRC's copper wealth and why the country matters to global supply. · 13:34
How the satellite analysis worked on both sites
The client’s part was quick. The team sent the two site boundaries and named the target minerals: copper for the first site and cassiterite, tantalite and wolframite for the second. No one needed to visit either site for this stage, and no ground was disturbed.
Infographic
How two boundaries became a four-commodity drill plan
- 1Send the boundariesThe client sent two site outlines and named copper, cassiterite, tantalite and wolframite.
- 2Build seasonal compositesSeveral years of Sentinel-2 and Landsat images were merged into dry- and wet-season pictures.
- 3Score each mineralMineral-specific indices and terrain lineaments were combined into one potential index per commodity.
- 4Map and rank targets65 zones were outlined, each with a depth window, grade band and confidence level.
- 5Plan the drillingEach zone got a drill direction, angle and hole length, with shallow 3T zones first.
The analysis then combined several years of satellite imagery with terrain data, so that no single image decided the result on its own:
- Sentinel-2 optical images: this European mission provides 10-metre images in visible, near-infrared and shortwave-infrared bands, which carry the iron-oxide, clay and mica signals.
- Landsat 8 and 9: the Landsat missions add a long, consistent record in the same parts of the spectrum, which helps test whether a signal is stable over time.
- Terrain from SRTM: the Shuttle Radar Topography Mission elevation model supplies slope, aspect and shaded relief. Lineaments, the straight breaks in the landscape that often follow faults and contacts, were extracted from it.
- Seasonal and multi-year composites: imagery from 2020 onwards was merged into median dry-season and wet-season pictures to strip out cloud, smoke and short-lived changes.
From those layers, each report calculated a set of mineral-specific indices. The copper report used thirteen, including iron-oxide, clay, sulphide, oxide, gossan and supergene-enrichment indices. The tin report weighted muscovite, white mica, tourmaline, quartz and greisen indices. The tantalum report focused on pegmatite, feldspar, mica, albite and quartz indices. The tungsten report looked for the quartz-vein and greisen signals typical of tungsten-tin systems.
▶ A short explainer on how minerals leave spectral signatures that sensors can read. · 1:49
The indices were combined into a single potential index for each commodity. Areas that scored highest (in the 3T reports, the top tenth of the site), that passed vegetation, water and slope filters, and that held together as coherent shapes became target zones. Each zone was then examined within its surroundings (a 500-metre buffer in the 3T reports) for its structural setting, the number of lineaments around it and the consistency of its spectral signal. Those checks set each zone’s confidence level and its drill direction.
Site A: 42 copper targets on about a tenth of the ground
The copper report found 42 target zones on the first site. Together they cover about 36 hectares, or about 11% of the 338 hectares screened. In practice, the first round of mapping, sampling and drilling can concentrate on about one hectare in every nine.
The targets are long and narrow, with an average strike length of about 220 metres and an average width of about 33 metres. That shape fits structurally controlled mineralisation, and the targets line up along a consistent west-south-west trend. The report’s deposit-style model reads most of the zones as hydrothermal vein-style copper and the largest zone as porphyry-style. A field geologist confirms the style once rocks have been mapped and sampled.
The copper is not spread evenly. The five highest-priority targets hold about two-thirds of the copper in the report’s central estimate, and Target 1 alone holds about a quarter of it. That concentration gives the drill programme a clear starting point.
Chart
Five copper targets hold about two-thirds of the modelled copper
Share of the copper report’s central estimate, %
Here is how the five priority targets compare. We use the target numbers from the report so that the figures can be matched to the drill plan later.
| Priority target | Share of modelled copper | Estimated depth window | Suggested hole length | Drill angle | Confidence |
|---|---|---|---|---|---|
| Target 1 (porphyry-style) | 26.5% | 43–196 m | ~260 m | 75°, to the south-south-east | High |
| Target 2 | 15.3% | 42–177 m | ~235 m | 75°, to the south-south-east | Lower |
| Target 3 | 12.7% | 42–169 m | ~225 m | 75°, to the south-south-east | High |
| Target 4 | 7.7% | 42–152 m | ~200 m | 75°, to the south-south-east | Medium |
| Target 5 | 5.3% | 42–142 m | ~190 m | 75°, to the south-south-east | High |
| Other 37 targets | 32.5% | From about 42 m | 75° | Mixed |
Source: Farmonaut satellite copper detection report for this site, 2026. Shares are of the report’s central copper estimate and are rounded. Hole lengths are the report’s suggested drill depths, rounded.
Grades are given as a band, not a single number. Across the 42 targets, the report’s estimates run from about 0.53% to 0.61% copper, which means about 5.3 to 6.1 kilograms of copper in each tonne of rock. The band is narrow, which points to a consistent signal across the site.
The report’s central estimate is about 105,000 tonnes of contained copper. Satellite-derived grades and tonnages carry real uncertainty, which the report puts at 25 to 40%. Using the outer end of that range, the exploration target for this site is best read as roughly 60,000 to 150,000 tonnes of contained copper. That is a wide band, and it is meant to be. It tells the team how big the prize could be while the drill does the measuring.
The targets also sit close to the surface. Every zone starts at about 42 to 43 metres down, and the bases run from about 93 to 196 metres. The report rates all 42 targets as accessible from the surface, with low estimated strip ratios of below one tonne of waste per tonne of target rock.
The report sorts the targets into confidence tiers, based on the strength and clarity of the spectral signal, the continuity of each zone and the agreement between independent indices:
- High confidence, 12 targets: about 60% of the modelled copper. These lead the programme.
- Medium confidence, 22 targets: about 22%. These follow once the first results are in.
- Lower confidence, 8 targets: about 19%. Field mapping and sampling decide which of these move up.
If you want to try the same arithmetic on a target of your own, the calculator below turns tonnage and grade into contained metal. It works for any grade quoted in percent, such as copper, tin or tungsten oxide.
Calculator
How much metal does a target hold?
Enter your own target. Works for any grade in percent, such as copper, tin or tungsten oxide.
- Recoverable metal (t): 4,000
- Gross in-situ value (US$): $47,500,000
- Value after recovery (US$): $38,000,000
Example values only, not related to this project. Contained metal is tonnage multiplied by grade. For grades in ppm, divide by 10,000 to get percent. The metal price is an example in US dollars per tonne, so check today’s price. Gross value is before mining and processing costs.
Site B: tin, tantalum and tungsten from one boundary
The second site was screened three times, once for each of the 3T minerals. That is where the value of a single satellite pass shows most clearly. One boundary, sent once, produced three independent target maps that can be laid over each other.
Chart
65 target zones across four commodities
Number of target zones per report
Each commodity tells its own story:
- Tungsten, 17 targets: the wolframite report found the most zones, covering about 39 hectares, or about 9% of the site. It reads them as greisen-style tungsten-tin mineralisation along a west-south-west trend. Three high-confidence targets hold about 77% of the modelled tonnage.
- Tantalum, 4 targets: the tantalite report outlined four pegmatite bodies, all read as lithium-caesium-tantalum (LCT) style. One of them is a long dyke of about 4.2 kilometres, about 80 metres wide, which holds about 91% of the modelled tantalum.
- Tin, 2 targets: the cassiterite report found two greisen-style zones covering about 16.5 hectares. The larger one is a corridor about 2.6 kilometres long and about 56 metres wide, on gentle ground with mean slopes of about 6 degrees.
Here is how the three 3T reports compare with the copper report from the first site. Contained-metal figures are shown as bands for the reason explained under the table.
| Commodity | Target zones | Grade band | Estimated depth window | Exploration target band | Suggested drilling |
|---|---|---|---|---|---|
| Copper (Site A) | 42 | 0.53–0.61% Cu | 42–196 m | ~60,000–150,000 t Cu | ~6,200 m |
| Tungsten (Site B) | 17 | 0.15–0.27% WO3 | 9–69 m | ~210–480 t WO3 | ~700 m, 17 holes |
| Tantalum (Site B) | 4 | 115–192 ppm Ta2O5 | 16–126 m | ~150–350 t Ta2O5 | ~400 m, 4 holes |
| Tin (Site B) | 2 | 0.33–0.35% Sn | 67–193 m | ~2,900–6,700 t Sn | ~390 m, 2 holes |
Source: Farmonaut satellite detection reports for these sites, 2026. Grade bands are the range across each report’s targets. Exploration target bands are each report’s central estimate plus or minus 40%, the outer end of the 25 to 40% uncertainty the copper report gives for satellite-derived grades, applied to all four commodities for consistency. WO3 is tungsten trioxide and Ta2O5 is tantalum pentoxide, the forms in which these metals are usually reported.
For orientation, the central estimates are about 340 tonnes of tungsten trioxide, about 250 tonnes of tantalum pentoxide and about 4,800 tonnes of tin. The tantalum report also models how much would come out of a plant: at its recovery cases of 75 to 85%, the central estimate gives about 190 to 215 tonnes of recoverable tantalum pentoxide.
The most useful finding for a field team is depth. The 3T targets start much closer to the surface than the copper. The tungsten zones start at about 9 metres down and the tantalum pegmatites at about 16 to 18 metres. That puts them within reach of trenching, pitting and short, cheap holes, which is exactly how many 3T operations in the region start.
Chart
Estimated depth window by commodity
Metres below surface, shallowest top to deepest base
The overlap between the three maps is a strength. Tin and tungsten often occur together in greisen systems, and the reports read both commodities as greisen-style on this site. Where a tungsten zone and a tin zone share ground, one trench or hole can test both. The same samples can also be assayed for tantalum where the pegmatites come close. That is how a multi-commodity screen saves money: one set of field work answers several questions at once.
Depth, drill order and a combined drilling plan
Put together, the four reports give a clear order of work across both sites. The shallow 3T targets on the second site can be tested quickly and cheaply. The deeper copper targets on the first site need a proper core programme, led by the five priority zones.
Every report gives a drill direction and angle for each zone. The copper holes are set at 75 degrees, pointing south-south-east, across the dominant west-south-west structural trend. The tin and tantalum holes are set at 70 degrees and the tungsten holes at 75 degrees, again across the trend of their zones. A hole drilled across a target tests it far better than one drilled along it.
Chart
Suggested drilling by commodity
Metres of drilling suggested in each report, rounded
The reports’ suggested programmes add up as follows:
- Tungsten: one short hole in each of the 17 zones, about 700 metres in all, with holes of about 30 to 85 metres.
- Tantalum: four holes of about 60 to 160 metres, about 400 metres in all, led by the long pegmatite dyke.
- Tin: two holes of about 150 and 245 metres, about 390 metres in all.
- Copper: about 6,200 metres to test all 42 zones, with a first phase of two to three core holes in each of the five priority targets.
That sequence suits a programme with limited time and money. About 1,500 metres of short drilling tests the whole 3T suite on the second site. The copper programme can then be phased, starting with the targets that hold the most copper and carry the highest confidence.
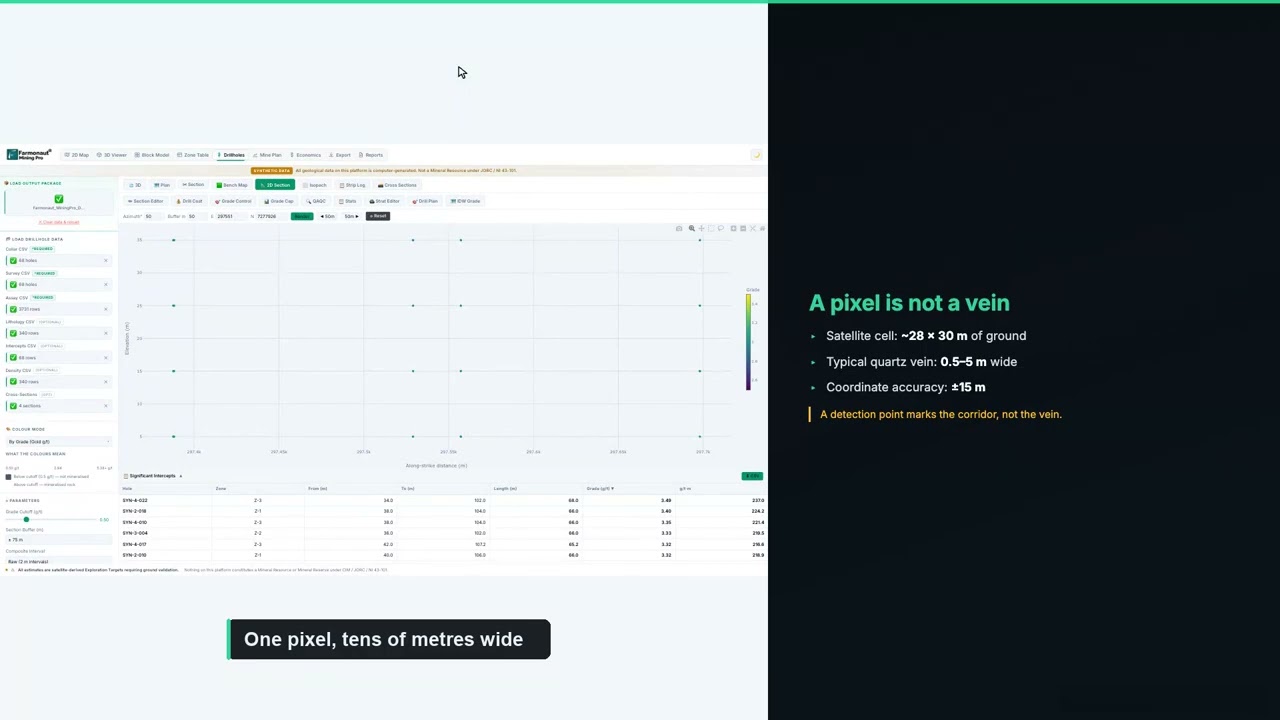
▶ How to plan a drilling programme once you have targets. · 5:49
If you are budgeting a similar programme, enter your own contractor’s rates below. The default values are round examples, not typical prices, because costs vary widely with location, rock type, access and rig availability.
Calculator
What would a first drill programme cost?
Enter your contractor’s quote. All amounts are in US dollars.
- Total metres: 1,500
- Cost per hole (US$): $32,000
- Single-rig days (excluding moves): 50.0
Example values only, not typical prices. Costs vary widely with location, rock type, access and rig availability, so use real quotes from your contractor and laboratory.
Confidence tiers keep the plan honest. Each report scores its zones on the strength and consistency of the signal and on how many independent checks agree. The tiers set the order of work, not whether a zone is tested: every zone stays in the programme, and the strongest ones go first.
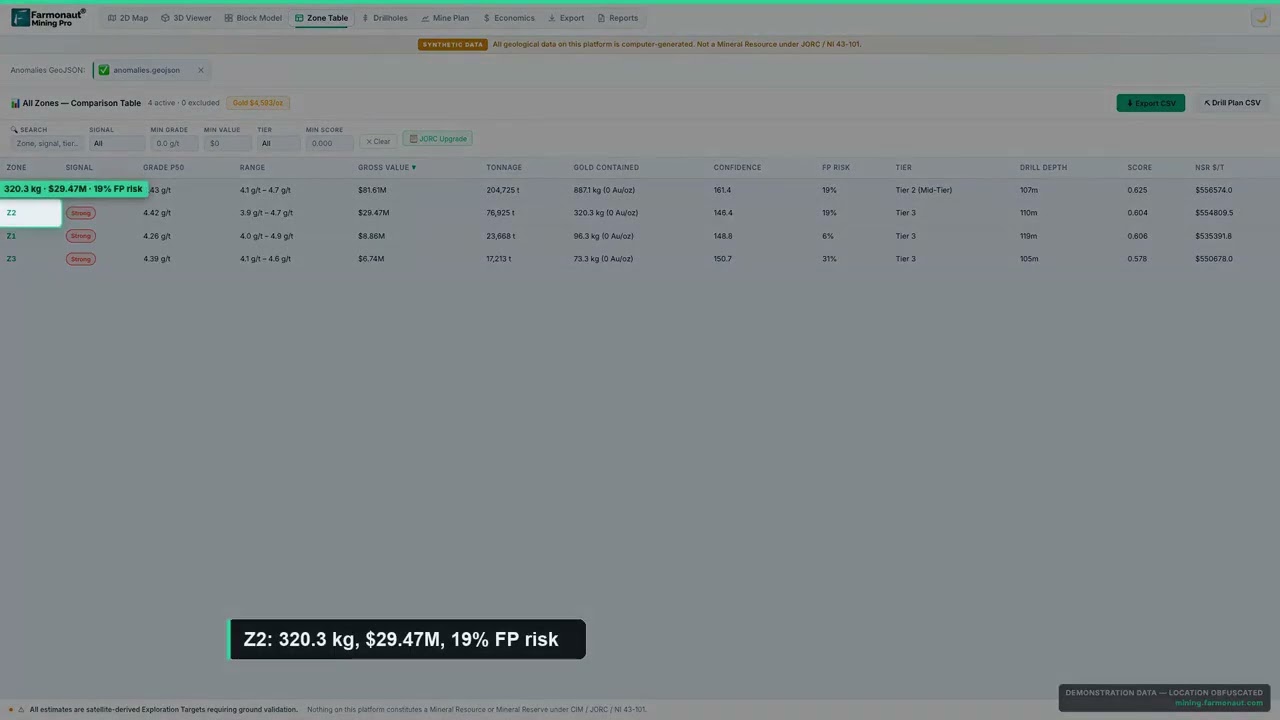
▶ How satellite detection software builds a confidence score for each target. · 4:36
What the client reported after the report
Some months after the reports were delivered, the client completed our structured post-project feedback form. These are the client’s own recorded answers to fixed questions on that form. They are reproduced without alteration and are not presented as a quotation.
- Locations narrowed: yes. The analysis helped narrow down where to explore or drill.
- Exploration time saved: yes, in the band of 1 to 3 months.
- Exploration cost saved: yes, in the band of US$25,000 to US$50,000.
- Drilling so far: not yet drilled.
- Planned drilling: within the next 3 to 6 months.
Those answers show where a satellite study earns its keep on a multi-commodity programme. Screening two sites for four commodities on the ground would mean separate mapping and sampling campaigns, each with its own assay bill. The satellite pass replaced that first round of broad reconnaissance with a short list of ranked zones, and the client recorded real savings in both time and money before drilling began.
The timing also works well. With drilling planned within 3 to 6 months, there is time to field-check the shallow 3T zones, take rock-chip and soil samples, and fix collar positions on the copper targets. By the time a rig arrives, the first holes can go where the satellite data and the field evidence agree.
Lessons for copper and 3T explorers
Several parts of this programme carry over to other copper, tin, tantalum and tungsten projects, in the DRC and elsewhere in Africa.
- Screen every commodity you hold rights to: one boundary can be analysed for several minerals at once. On this programme, a single 423-hectare site returned three independent target maps.
- Look for overlap: where tin and tungsten zones share ground, one trench or hole can test both, and the same samples can be assayed for tantalum.
- Start shallow: 3T targets that begin about 9 to 18 metres down can be tested by trenching, pitting and short holes long before a deep core rig is needed.
- Let concentration set the copper plan: when five targets hold about two-thirds of the modelled copper, those five are where the core rig goes first.
- Read estimates as bands: a satellite exploration target is a range to test, and drilling turns it into a measured number.
- Build traceability in from day one: tin, tantalum and tungsten from the region are covered by responsible-sourcing rules such as the EU conflict minerals regulation and the OECD due diligence guidance. A well-documented exploration record, including satellite baselines, makes those checks easier later.
The commodities themselves are worth the effort. The USGS Mineral Commodity Summaries list the DRC among the world’s leading tantalum producers, and the country is also a major copper producer, as the USGS copper summary shows. Tin and tungsten are on critical-mineral lists in many countries, which keeps demand for new, well-documented sources strong.
Getting a similar study for your own ground follows the same steps. Send your boundary as coordinates, a KML or KMZ file, or a polygon, and name your target minerals. Delivery usually takes 5 to 20 business days, depending on the size of the area and the number of minerals. You can map your mining site yourself or get a quote from our team.
Want to see the same approach on other ground? Read how a copper-cobalt explorer used satellite targets before drilling in our copper-cobalt case study, or see how satellite analysis narrowed a desert gold property in our US Southwest gold case study.
3T mineral exploration in the DRC: frequently asked questions
What did 3T mineral exploration by satellite find on these sites?
Across two sites totalling about 761 hectares in the DRC, the four reports outlined 65 target zones: 42 for copper on the first site, and 17 for tungsten, 4 for tantalum and 2 for tin on the second.
What are the 3T minerals?
The 3Ts are tin, tantalum and tungsten. Their main ores are cassiterite, tantalite (often called coltan when mixed with columbite) and wolframite. Together with gold they are often grouped as 3TG.
Can one satellite study cover several minerals?
Yes. The same imagery can be analysed with different mineral-specific indices. On this programme, one boundary was screened separately for cassiterite, tantalite and wolframite, giving three target maps that can be overlaid.
How much copper does the report estimate?
The report’s central estimate is about 105,000 tonnes of contained copper at grades of about 0.53 to 0.61% copper. Allowing for the 25 to 40% uncertainty the report gives, the exploration target is best read as roughly 60,000 to 150,000 tonnes. This is an exploration target, not a resource.
How deep are the targets?
The tungsten zones start at about 9 metres and the tantalum pegmatites at about 16 to 18 metres below the surface. The tin zones start at about 67 metres and the copper zones at about 42 to 43 metres, with copper bases reaching about 93 to 196 metres.
How much time and money did the client save?
On our feedback form, the client selected the bands of 1 to 3 months of exploration time saved and US$25,000 to US$50,000 of exploration cost saved. These are the client’s own estimates for this programme.
Has the ground been drilled?
Not yet. Drilling is planned within 3 to 6 months of the client’s feedback. The reports suggest short holes on the shallow 3T zones and a phased core programme on the copper, led by the five priority targets.
Can a satellite detect tin, tantalum or tungsten directly?
No. Satellites detect signs linked with these metals, such as greisen alteration, pegmatites, quartz veins and structures. The analysis combines those signs to rank where the metals are more likely. Drilling and laboratory assays confirm the metal and its grade.
Is this a JORC or NI 43-101 resource?
No. The reports give satellite-based exploration targets, which come before any resource estimate. A qualified person needs drilling and assay data to estimate a resource under JORC, NI 43-101 or the CIM definitions.
How long does a multi-mineral satellite report take?
Delivery usually takes 5 to 20 business days, depending on the size of the area and the number of minerals.
What do I need to send to get a report for my own ground?
Send your boundary as coordinates, a KML or KMZ file, or a polygon, along with your target minerals. Our team checks the boundary with you before the work starts.
Published in anonymised form. The client is not identified and did not provide a testimonial; no statement in this article is quoted from or attributed to them. The site boundaries, coordinates, licence details and exact locations are withheld. All resource figures are satellite-based exploration targets and are not Mineral Resources or Mineral Reserves under JORC, NI 43-101 or similar codes. Time and cost savings are bands selected by the client on our feedback form.
Farmonaut mineral detection
Map your mining site from space
Send your claim or licence boundary as KML, KMZ or a polygon and name your target minerals. Farmonaut returns ranked satellite exploration targets for each one, usually in 5 to 20 business days.

Keep reading
Sources
- US Geological Survey, Mineral Commodity Summaries 2025: Copper: pubs.usgs.gov
- US Geological Survey, Mineral Commodity Summaries 2025: Tin: pubs.usgs.gov
- US Geological Survey, Mineral Commodity Summaries 2025: Tantalum: pubs.usgs.gov
- US Geological Survey, Mineral Commodity Summaries 2025: Tungsten: pubs.usgs.gov
- US Geological Survey, Professional Paper 1802-S: Tin (2017): pubs.usgs.gov
- US Geological Survey, Professional Paper 1802-M: Niobium and Tantalum (2017): pubs.usgs.gov
- US Geological Survey, Preliminary deposit model for LCT pegmatites (2011): pubs.usgs.gov
- US Geological Survey, Tungsten statistics and information: usgs.gov
- Copernicus SentiWiki, Sentinel-2 mission: sentiwiki.copernicus.eu
- US Geological Survey, Landsat missions: usgs.gov
- NASA Earthdata, Shuttle Radar Topography Mission (SRTM): earthdata.nasa.gov
- JORC, The JORC Code 2012 edition: jorc.org
- CIM, Definition Standards for Mineral Resources and Mineral Reserves: cim.org
- European Commission, Conflict minerals regulation: policy.trade.ec.europa.eu
- Cadastre Minier (CAMI), Democratic Republic of the Congo: cami.cd
Discussion
Questions, corrections or field experience? Share them below. First-time comments are reviewed before they appear, and your email is never published.
No comments yet. Be the first to add a question or your experience.

 Southbridge & Wess PDC Ltd
 Qader Group
 Ileys General Trading
 SG Gold Mining LLC
 VRV Global Pte Ltd
 Omsri International FZE
 G.I.T.T.
 Jaunita Erss Ltd
 Almosi SARL
 SRK Consulting
 Berks Gold Limited
 Mwerezi Minerals Company Limited
 Mining SARL
 SenGold Invest SAS
 Sean Mining Limited
 NTS Group (Pty) Ltd
 Mine4Africa
 Lithspo Minerals Limited

 Client · Oregon, USA · Gold










