

Mining investment · Jurisdiction ranking
Best Mining Jurisdictions: Fraser Institute Rankings
Nevada, Ontario and Saskatchewan top the Fraser Institute’s latest survey of 68 mining jurisdictions. See the top and bottom 10, how the index is built, permit times and tax terms, plus a calculator.
Key takeaways
- Nevada (90.87), Ontario (89.98) and Saskatchewan (89.66) lead the Investment Attractiveness Index among 68 jurisdictions (Fraser Institute, survey of 256 executives, published 26 February 2026).
- The index is 60% mineral potential and 40% policy; on policy alone Nevada scores 100 and Botswana 99.81, while the DRC is 63rd despite strong geology.
- China, Burkina Faso and Egypt rank lowest; South Australia climbed from 35th to 4th and Finland fell from 1st to 11th in one year.
- Exploration permit times differ widely: 80% of Alaska respondents expected permits in two months or less, against none in Western Australia (Fraser permit sub-survey, 72 respondents).
- Ontario taxes mine profit at 10% above C$500,000 and Western Australia charges a 2.5% royalty on the value of gold produced; tax is only one of 15 policy factors.
In this article
- How the Fraser Institute ranks mining jurisdictions
- Top 10 mining jurisdictions in the world by Investment Attractiveness Index
- Least attractive mining jurisdictions in the survey
- Policy versus geology: why the two scores disagree
- Who moved most since the last survey
- Exploration permit times in the top jurisdictions
- Tax and royalties: the fiscal terms behind the rankings
- Licence and title security
- Environmental rules, protected areas and land claims
- A five-step check before you commit to a jurisdiction
- What the ranking does not tell you
- Frequently asked questions
The best mining jurisdictions in the world, according to the latest Fraser Institute Annual Survey of Mining Companies, are Nevada, Ontario and Saskatchewan. They took the top three places on the Investment Attractiveness Index among 68 jurisdictions in the 2025 edition, which the Institute released on 26 February 2026. South Australia, Arizona, Western Australia, Botswana, Norway, Sweden and Saudi Arabia completed the top 10. At the other end, China, Burkina Faso and Egypt ranked lowest.
This page reads the survey the way a licence owner, consultant or investor needs to read it. It explains what the Investment Attractiveness Index and the Policy Perception Index measure, lists the top 10 and bottom 10, shows where the two scores disagree, and adds the things the survey does not cover well: permit times, tax and royalty rules, title security and land access. It describes the survey’s results, not our own ranking, and it is general information, not investment advice.
How the Fraser Institute ranks mining jurisdictions
The Fraser Institute, a Canadian policy think tank, has surveyed mining and exploration companies every year since 1997. The aim is to see how mineral endowment and public policy, such as tax and regulation, affect exploration investment. The 2025 survey went to 2,304 senior executives in exploration, development and related companies between 5 August and 26 November 2025. A total of 256 people replied (165 completed the full questionnaire and 91 part of it), enough to rate 68 jurisdictions. The year before it rated 82 and in 2023 it rated 86, so the list of places changes with the number of replies. A jurisdiction needs at least five responses to appear, and those with five to nine are flagged with an asterisk in the tables (Fraser Institute, 2026).
Respondents are mostly senior people: about 36% were company presidents and 19% were consultants (Canadian Press via BNN Bloomberg, 26 February 2026), and 38% worked for exploration companies (Fraser Institute, 2026). The survey is a record of opinion, not a count of mines or an audit of laws. That is its strength (it shows how decision makers feel about a place) and its limit (a few unhappy respondents can move a small jurisdiction).
The Policy Perception Index (PPI)
The Policy Perception Index is a report card on government policy. Respondents say whether each of 15 factors encourages exploration, is not a deterrent, or is a mild or strong deterrent, or would stop them investing. The 15 factors cover:
- uncertainty about how existing regulations are administered and enforced;
- environmental rules, and overlap or duplication between agencies;
- the legal system and the tax regime;
- disputed land claims and uncertainty over protected areas;
- infrastructure such as roads and power;
- local purchasing or community agreements, trade barriers and political stability;
- labour rules, the quality of the geological database, security, and the availability of skilled labour.
Each jurisdiction’s average answers are standardised and rescaled so that the most attractive scores 100 and the least attractive scores 0. A score of 100 therefore means “best in this year’s sample”, not “perfect”. In the 2025 edition Nevada scored 100 and China scored 0 (Fraser Institute, 2026).
The Best Practices Mineral Potential Index
This index asks a different question: how good is the geology, assuming the jurisdiction had ideal policy (stable regime, competitive tax, no political risk)? Fraser calls this the “best practices” assumption. A respondent who says the geology “encourages” investment counts for a full point, and one who says it is “not a deterrent” counts for half a point. Saskatchewan’s score of 87.5, for example, came from 75% “encourages” answers plus half of the 25% “not a deterrent” answers. Fewer places are rated here (41 in 2025) because respondents only score geology where they know it.
The Investment Attractiveness Index (IAI)
The headline ranking blends the two: 60% mineral potential and 40% policy. The weights come from a survey question on how much each factor drives investment decisions. In 2025 the answer was 58.3% for mineral potential and 41.8% for policy, and Fraser keeps the 60/40 split so that years can be compared. You can check any row yourself. Ontario scored 87.5 on mineral potential and 93.70 on policy, and 0.6 x 87.5 + 0.4 x 93.70 gives 89.98, which is its published score. Try your own numbers below.
Calculator
What would a jurisdiction score on the Fraser index?
Enter a mineral potential score, a policy score and the weight on geology.
- Index with the standard 60/40 weights: 89.98
- Index on policy alone: 93.70
- Index on geology alone: 87.50
- Gap between policy and geology: 6.20
Illustrative only. Fraser publishes the real scores; this rebuilds the 60/40 blend it describes. The defaults are Ontario’s published 2025 scores (87.50 and 93.70), which give its published 89.98.
Top 10 mining jurisdictions in the world by Investment Attractiveness Index
Here is the top of the 2025 table, with the two ingredients next to each score. The “Standout” column is our plain-language note drawn from the published ranks; it is not a Fraser category.
Chart
Ten most attractive mining jurisdictions
Investment Attractiveness Index score, 0 to 100, 68 jurisdictions rated
| Rank | Jurisdiction | IAI score | Policy (PPI, rank) | Mineral potential (score) | Standout |
|---|---|---|---|---|---|
| 1 | Nevada, USA | 90.87 | 100.00 (1st) | 84.78 | Best policy score in the survey |
| 2 | Ontario, Canada | 89.98 | 93.70 (5th) | 87.50 | Top 5 on both policy and geology |
| 3 | Saskatchewan, Canada | 89.66 | 92.90 (8th) | 87.50 | Joint 2nd for geology |
| 4 | South Australia | 89.19* | 85.47 (16th) | 91.67 | Best-rated geology in the survey |
| 5 | Arizona, USA | 87.06 | 90.73 (10th) | 84.62 | Top 5 for geology, top 10 for policy |
| 6 | Western Australia | 87.01 | 88.53 (13th) | 86.00 | 3rd for geology, but slow permits |
| 7 | Botswana | 85.99 | 99.81 (2nd) | 76.79 | 2nd for policy |
| 8 | Norway | 85.19* | 87.97 (14th) | 83.33 | Best geology score among European places |
| 9 | Sweden | 84.66 | 90.83 (9th) | 80.56 | Top 10 for both policy and geology |
| 10 | Saudi Arabia | 82.00 | 94.99 (4th) | 73.33 | 4th for policy |
* Between 5 and 9 responses on one or more questions. All scores are from the Fraser Institute’s 2025 Annual Survey of Mining Companies (published February 2026).
Three points stand out. First, the United States, Canada, Australia and Europe have two places each in the top 10, with one each for Africa and Asia. Second, Nevada has ranked consistently in the top 10 over the last 11 surveys, according to Fraser. Third, the order is tight: the gap between Nevada and Saskatchewan is 1.2 points, so a few answers could reorder the top three.
Which jurisdictions are the most mining friendly?
If “mining friendly” means government policy, use the Policy Perception Index instead of the combined index. The ten best policy scores in 2025 were Nevada (100.00), Botswana (99.81), Alberta (96.71), Saudi Arabia (94.99), Ontario (93.70), Finland (93.56), Newfoundland and Labrador (93.01), Saskatchewan (92.90), Sweden (90.83) and Arizona (90.73). Canada has four of those ten places and the United States two. Alberta is the interesting case: third for policy but 24th overall, because respondents rated its mineral potential 32nd of 41. A friendly regime does not help if the ground is not prospective for what you want to find.
Least attractive mining jurisdictions in the survey
The bottom of the index is just as informative, because it shows which risks respondents say outweigh geology. These are the ten lowest scores on the Investment Attractiveness Index in 2025, worst first.
| Rank (of 68) | Jurisdiction | IAI score | Policy score (PPI) | Mineral potential score |
|---|---|---|---|---|
| 68 | China | 20.00* | 0.00 | 33.33 |
| 67 | Burkina Faso | 35.29* | 28.23 | 40.00 |
| 66 | Egypt | 39.61* | 54.03 | 30.00 |
| 65 | One further jurisdiction in Oceania | 45.85* | 39.62 | 50.00 |
| 64 | Mali | 46.58 | 7.36 | 72.73 |
| 63 | Chubut, Argentina | 47.03* | 42.57 | 50.00 |
| 62 | Neuquen, Argentina | 49.29* | 63.22 | 40.00 |
| 61 | Bolivia | 49.81* | 34.52 | 60.00 |
| 60 | Northern Ireland | 52.04* | 85.11 | 30.00 |
| 59 | Guinea (Conakry) | 52.16* | 30.41 | 66.67 |
* Between 5 and 9 responses on one or more questions. Source: Fraser Institute, Annual Survey of Mining Companies, 2025.
Africa holds four of these ten places (Burkina Faso, Egypt, Mali and Guinea) and Argentina two (two provinces, Chubut and Neuquen). Many of these scores rest on small samples, so treat them as signals, not verdicts. Notice that Northern Ireland has a good policy score (85.11) but a low geology score (30.00), the reverse of Mali, which has a policy score of 7.36 but a geology score of 72.73.
Policy versus geology: why the two scores disagree
The scatter chart below plots policy against mineral potential for eight jurisdictions. The top-right corner is where both are strong (Nevada, Ontario, South Australia). The top-left corner holds places that explorers think are geologically rich but hard to work in. The Democratic Republic of Congo (DRC) is the clearest example: its mineral potential score is 73.08, yet its policy score is 34.02 and its overall rank is 50th of 68.
Chart
Policy against geology for eight jurisdictions
Fraser 2025 scores; top right is strong on both
The DRC’s geology is real. The US Geological Survey estimates that the DRC mined 230,000 tonnes of cobalt in 2025 out of a world total of 310,000 tonnes, about 74%. For cobalt, then, buyers go where the metal is whatever the policy score. Copper shows the same pattern at a smaller scale: the USGS puts Chile first at 5.3 million tonnes of mine output in 2025 and the DRC second at 3.2 million tonnes, out of about 23 million tonnes worldwide (USGS, 2026). Chile’s overall rank in the Fraser index is 32nd of 68 and the DRC’s is 50th.
The lesson for an investor or licence owner is to ask which question you are answering. If you hold ground in a high-geology, low-policy place, the score tells you what financing, insurance and partners will cost you. If you are choosing between two places for a first project, a high policy score can compensate for average geology, but only when the commodity you want is actually present there.
Who moved most since the last survey
Scores swing from year to year, mostly on mid-sized samples. Compare 2024 and 2025 and the movement is large:
Chart
Biggest moves in the index
Investment Attractiveness Index score, previous survey against 2025 survey
- South Australia climbed from 35th to 4th, with its score rising from 63.14 to 89.19.
- Ontario rose from 15th to 2nd (77.54 to 89.98), helped by a policy score that rose by 9.09 points.
- Botswana rose from 20th to 7th and now ranks 2nd for policy, up from 14th.
- Finland fell from 1st to 11th (91.83 to 80.76), and Alaska from 3rd to 12th (87.30 to 79.96).
- Utah dropped from 11th to 38th (78.66 to 66.10), and New Zealand from 12th to 40th (78.56 to 65.24).
- Quebec ranks 22nd and has left the top 10 after four consecutive years in it (BNN Bloomberg, 2026).
Fraser itself notes that a jurisdiction can change rank when its own score barely moves, because the rank depends on how everyone else scored and on how many places were rated. Look at the score and its history (the survey publishes five years) before you read much into a rank.
Exploration permit times in the top jurisdictions
The Investment Attractiveness Index does not tell you how long you will wait for an exploration permit. Fraser runs a separate sub-survey on this, and the 2025 edition drew on 72 executives who had applied for an exploration permit, licence or notice of work in the last two years. It covers permits to explore, not permits to build a mine, and it covers only Canada, the United States, Australia and Northern Europe. Most jurisdictions had between five and nine responses, so the figures are indicative.
Chart
Explorers who expected a permit in two months or less
Share of respondents, percent; most jurisdictions had 5 to 9 responses
The share of respondents who expected to get permits in two months or less ranged from 80% in Alaska and 57% in Nevada to 0% in Western Australia and Manitoba. Across the jurisdictions, an average of 69% of US respondents said two months or less, against 21% in Canada. In Newfoundland and Labrador all respondents expected permits within six months, and 80% said the regulator met its own timelines most of the time. Western Australia was at the other end: half of respondents expected to wait more than 11 months, and none said the regulator met its timelines most or some of the time (Fraser Institute, 2026).
This is why Western Australia can rank 6th overall and still feel slow to a junior explorer. If you plan a drilling programme, build the permit time into your budget as a cost, because every month of waiting is a month of holding costs on the licence. Our prospecting licence guide explains how the licence and permit steps fit together.
Tax and royalties: the fiscal terms behind the rankings
Tax is only one of the 15 policy factors, so a high policy score does not mean low tax. These headline terms show how different the systems are. They are summary figures; the statute and the regulator’s current page decide the actual bill.
- Ontario. The mining tax is 10% of taxable profit for non-remote mines and 5% for remote mines, applied to annual profit above a C$500,000 deduction. New mines can claim an exemption on up to C$10 million of profit, for 3 years (non-remote) or 10 years (remote) (Government of Ontario, Ministry of Finance).
- Western Australia. The gold royalty is 2.5% of the royalty value, with no royalty on the first 2,500 ounces produced per financial year by a gold royalty project. Gold is valued at the London Bullion Market price in Australian dollars (Government of Western Australia).
- Nevada. Nevada taxes the net proceeds of minerals: revenue from extracted minerals minus allowed costs of mining, processing and transport. The Department of Taxation sets the tax each year from the previous calendar year’s actual production (Nevada Department of Taxation).
- Canada, overall. Natural Resources Canada lists federal corporate income tax, provincial and territorial income taxes, and provincial mining taxes and royalties among the charges on a mine (Natural Resources Canada).
The bottom line: royalties on revenue (as in Western Australia) are paid even when a mine loses money, while profit-based taxes (as in Ontario) are not. A project with thin margins reacts very differently to the two. For a worked comparison on gold, see our guide to the best countries for gold mining investment, which has a government-take calculator.
Licence and title security
The Fraser survey asks about disputed land claims and the legal system, but it cannot tell you what rights your own licence carries. Check these basics in every jurisdiction before you pay for a licence or option:
- Who grants the title (a ministry, a cadastre office, a court), and whether it is first-come or competitive.
- How long exploration and mining rights last, and what spend or work is required to keep them.
- Whether the licence gives mineral rights only or also surface rights, and what compensation landowners can claim.
- Whether foreigners may hold title directly or need a local partner. Some countries reserve small-scale or artisanal licences for citizens, so check the mining act and the ministry’s current rules.
The video below, from our channel, walks through how a foreigner can approach a small-scale licence in Africa and which routes are open.
Open data on who holds what is improving. The Extractive Industries Transparency Initiative asks member countries to disclose how extraction rights are awarded and how revenues flow, and its country reports are a useful starting point. The Natural Resource Governance Institute publishes a separate Resource Governance Index that scores how countries manage mining. Both measure rules and disclosure, which complements the Fraser view of company sentiment. If you are comparing companies as well as places, our post on mining investment companies covers how to read the operator side.

▶ Explains whether a foreigner can get a small-scale mining licence in Africa and which routes are open. · 5:16
Environmental rules, protected areas and land claims
Two policy factors recur in the survey’s written comments: uncertainty over which areas will be protected as parks, wilderness or heritage sites, and uncertainty over disputed land claims. In British Columbia in 2025, 72% of respondents expressed concern about protected-area uncertainty and 70% about disputed land claims, while 58% were concerned about environmental regulation (Fraser Institute, 2026). The province ranks 20th overall, down from 13th.
These are not abstract: a protected-area boundary can cut a licence in half. Before you commit, overlay the licence on current protected-area, Indigenous or customary land and water layers, and check what the environmental impact process requires. The short video below explains the seven main environmental impacts of mining, which are the topics regulators ask about.
▶ Explains the seven main environmental impacts of mining, the topics regulators ask about. · 2:31
A five-step check before you commit to a jurisdiction
Use the ranking as a first filter and then work through the questions that decide your own project. Each step has a clear output you can write down.
Infographic
Screening a mining jurisdiction in 5 steps
- 1CommodityFind the places that actually hold it.
- 2Both scoresRead policy, geology and five-year history.
- 3Fiscal termsPrice royalty and tax at two metal prices.
- 4PermitsGet current timelines from the regulator.
- 5Access and titleCheck surface rights, protected land, roads and power.
- Start with the commodity. Pick the places that actually hold it. Use the USGS Mineral Commodity Summaries to see where production and reserves sit, then look up the Fraser score for those places.
- Read both scores. Note the policy score, the geology score and how they moved over five years. A drop of more than 10 points is a reason to read the survey comments.
- Price the fiscal terms. Run royalty plus tax at today’s price and at a lower price. Use the official regulator page for each rate.
- Time the permits. Ask the regulator for current timelines, and add the Fraser permit data as a cross-check where it exists.
- Check access and title. Confirm surface rights, protected areas, nearby settlements and power and road access before you spend on drilling.
Satellite imagery fits into the last two steps. Surface alteration, structure and land cover can be mapped over a licence area from space, so you can see roads, villages, water and protected ground early and decide where fieldwork is worth the cost. The explanation in how satellite mineral exploration works shows what the data can and cannot say. Satellites map surface and near-surface signatures; sampling and drilling confirm what is in the ground. Farmonaut offers satellite mineral reports for licence areas through a quote request. The short video below explains remote sensing in plain words.
If you are looking specifically at Australia, our overview of Australian mining exploration companies covers the operators active in the top-ranked states.
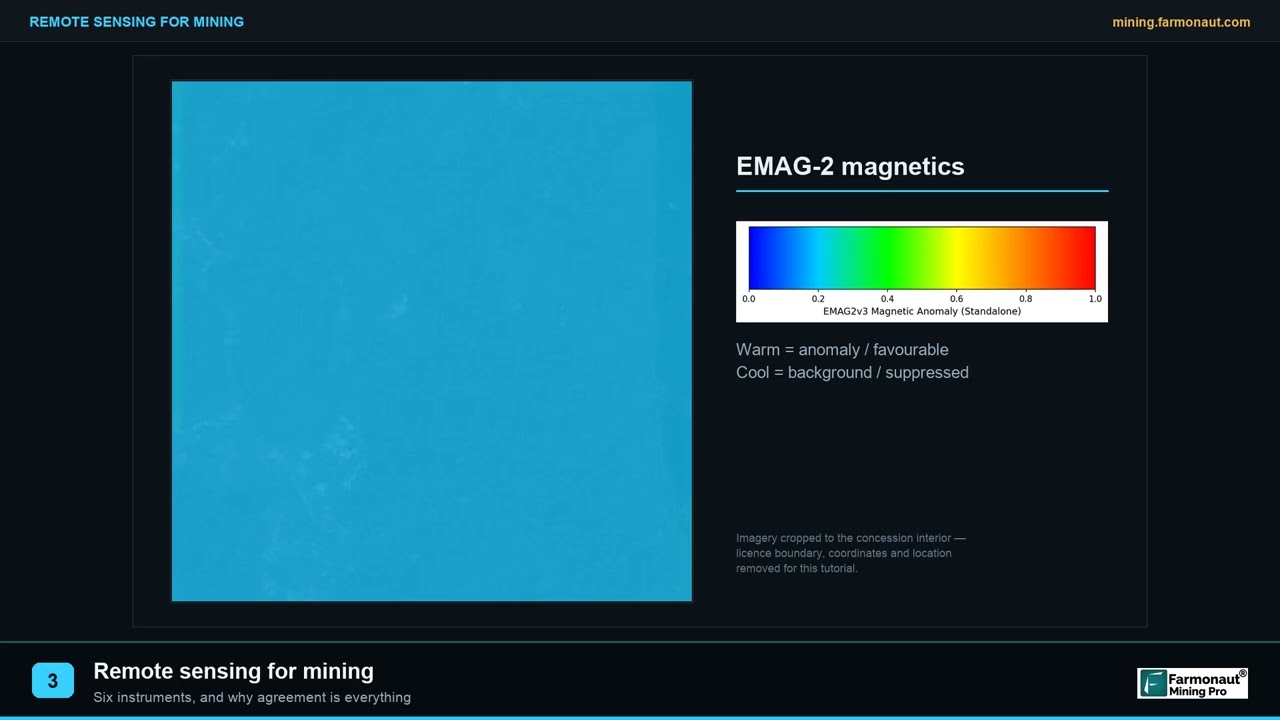
▶ Explains remote sensing for mining in plain words and the six instrument families. · 2:01
What the ranking does not tell you
Use the survey with its limits in mind.
- It is opinion. A respondent may mark down a good jurisdiction because of one bad experience. Fraser says it does not think this removes the value of the survey.
- The sample moves. The number of rated places fell from 82 to 68 in a year, and many jurisdictions have five to nine responses.
- National rankings are gone. Fraser dropped country-level analysis because provinces and states often control mining policy, so a country’s average can hide a very different local picture.
- It rates exploration, not production. The questions are framed around exploration investment. A permit for a mine, a smelter or a water licence involves other rules.
- Scores are relative. A PPI of 100 means best in the sample, not without risk.
The practical response is to use two or three shortlisted places, read the raw tables, and then do a project-level review. A jurisdiction’s rank cannot replace a title search, a legal opinion or a technical report.
Frequently asked questions
What is the Fraser Institute Annual Survey of Mining Companies?
It is a yearly survey of mining and exploration executives run by the Fraser Institute since 1997. It rates provinces, states and countries on how much government policy and geology encourage exploration investment. The 2025 edition, published in February 2026, rated 68 jurisdictions using 256 responses.
What are the best mining jurisdictions in the world?
On the survey’s Investment Attractiveness Index the top 10 are Nevada, Ontario, Saskatchewan, South Australia, Arizona, Western Australia, Botswana, Norway, Sweden and Saudi Arabia. The ranking blends geology (60%) and policy (40%), so it favours places that are both prospective and predictable.
What is the Investment Attractiveness Index?
It is a composite score that combines the Best Practices Mineral Potential Index with the Policy Perception Index, weighted 60% and 40%. Scores run from 0 to 100, and each jurisdiction’s score and rank are published for five years.
What is the Policy Perception Index?
It is a report card on mining policy built from 15 survey questions on taxes, regulation, the legal system, land claims, infrastructure, community agreements, political stability, labour, the geological database, security and skills. The best policy in the sample is set to 100 and the worst to 0.
Which are the best countries for mining investment?
Fraser dropped national rankings in recent editions, because provinces and states often set mining policy. At the jurisdiction level the leaders are in the United States, Canada, Australia, Europe and Botswana. For gold specifically, see our guide to the best countries for gold mining investment.
Which jurisdictions are the most mining friendly?
On policy alone, the survey ranks Nevada first (score 100), then Botswana, Alberta, Saudi Arabia and Ontario. Policy friendliness and geology are separate: Alberta is third for policy but 24th overall.
Which jurisdictions rank lowest?
China, Burkina Faso and Egypt rank lowest on the Investment Attractiveness Index, followed by one more jurisdiction in Oceania, then Mali, Chubut, Neuquen, Bolivia, Northern Ireland and Guinea. On policy alone, China, Mali, Burkina Faso, Guinea and South Africa are at the bottom.
How long does it take to get an exploration permit?
It depends on the place. In the 2025 permit sub-survey, 80% of respondents in Alaska and 57% in Nevada expected permits in two months or less, against 17% in British Columbia and none in Western Australia. Sample sizes are small, so ask the regulator for current times.
Does a high ranking mean low tax?
No. Tax is one of 15 policy factors. Ontario ranks second overall and has a 10% mining tax on profit above C$500,000, while Western Australia charges a 2.5% royalty on the value of gold produced. Always read the rates on the regulator’s page.
How often is the survey updated, and where can I read it?
The Fraser Institute publishes it once a year and posts the full report and detailed tables on its website. The 2025 report was released on 26 February 2026 after the survey ran from August to November 2025. Check the Fraser Institute mining page for the next edition.
How can satellite data help when comparing jurisdictions?
It does not change the survey scores, but it helps with the project-level steps: mapping alteration and structure on a licence, and checking roads, settlements, water and protected land before fieldwork. Results are exploration targets, not a resource estimate.
This page is for information only. It is not investment advice and does not recommend any company, country or security. It is not legal advice either: tax, royalty and licence rules change, so confirm current terms with the regulator or a qualified adviser. Survey scores reflect executives’ opinions and small samples. Anyone prospecting or sampling in the field needs the landowner’s permission and the right licence, and must follow local safety rules.
Farmonaut mining
Screen your ground from space before you commit
Request a quote to have your licence or target area screened with satellite data, so jurisdiction and geology are checked together.
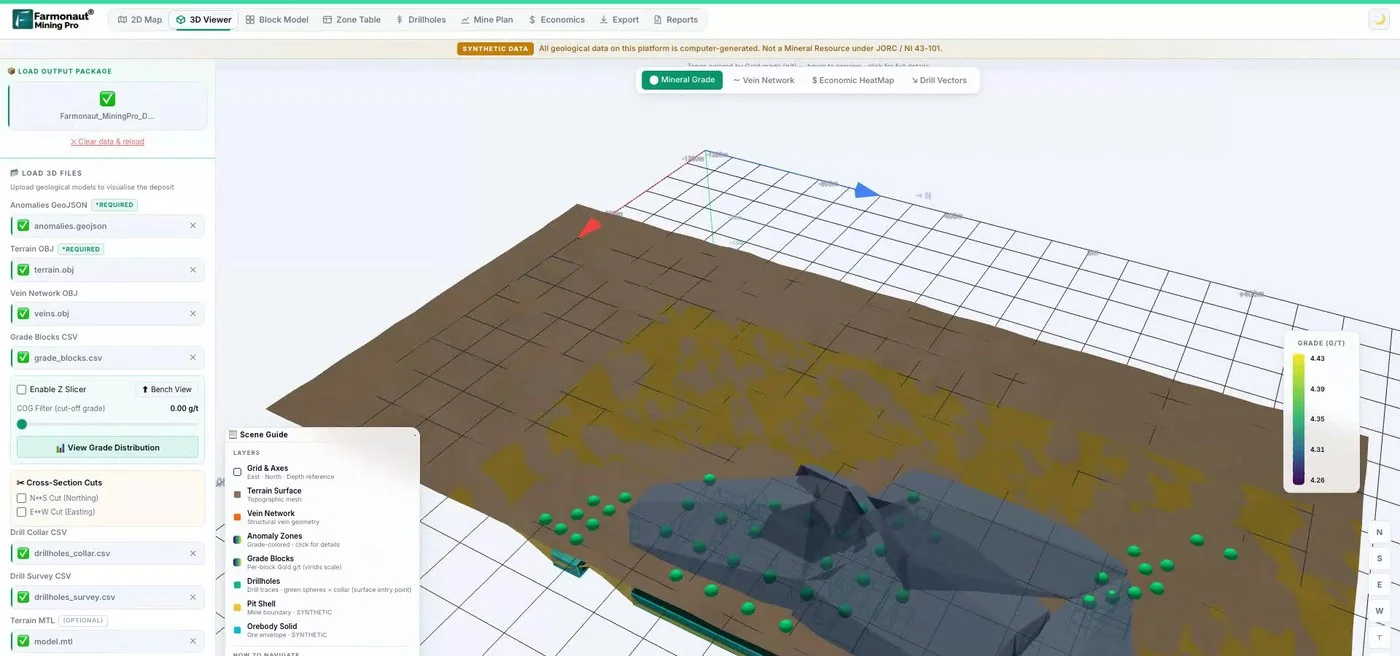
Mining Pro sample view, synthetic data
Sources
- Fraser Institute, Annual Survey of Mining Companies 2025 (study page): fraserinstitute.org
- Fraser Institute, Annual Survey of Mining Companies 2025 (full PDF, February 2026): economy.com.na
- Canadian Press via BNN Bloomberg, Ontario most attractive jurisdiction in Canada (26 February 2026): bnnbloomberg.ca
- US Geological Survey, Mineral Commodity Summaries 2026: Cobalt: pubs.usgs.gov
- US Geological Survey, Mineral Commodity Summaries 2026: Copper: pubs.usgs.gov
- Government of Ontario, Mining tax: ontario.ca
- Government of Western Australia, Mineral royalties in WA: wa.gov.au
- Nevada Department of Taxation, Net Proceeds of Minerals Tax: tax.nv.gov
- Natural Resources Canada, How mining is taxed in Canada and internationally: natural-resources.canada.ca
- Extractive Industries Transparency Initiative, Who we are: eiti.org
- Natural Resource Governance Institute, Resource Governance Index: resourcegovernanceindex.org
Discussion
Questions, corrections or field experience? Share them below. First-time comments are reviewed before they appear, and your email is never published.
No comments yet. Be the first to add a question or your experience.

 Almosi SARL
 SRK Consulting
 Berks Gold Limited
 Mwerezi Minerals Company Limited
 Mining SARL
 SenGold Invest SAS
 Sean Mining Limited
 NTS Group (Pty) Ltd
 Mine4Africa
 Lithspo Minerals Limited
 Tintina Mining Group
 Dalgety Minerals Pty Ltd
 Faith At Work (Pty) Ltd
 Geotech Mining Solutions plc
 Vulcan International Limited
 Kidepo Associates

 Licence holder · Nigeria · Gold + lithium
 Client · Somalia · Gold










