

Agricultural Risk Assessment: AI Tools & Real 2024 Loss Data
Reviewed September 2026 against USDA NASS, the American Farm Bureau Federation, and Crop Insurance in America.
Try it: Run your own numbers →
Agricultural risk assessment means quantifying, before harvest, which fields are exposed to weather, pest, or market losses — and doing it with field-level data instead of a windshield survey. In 2024, US farmers lost $20.3 billion to weather disasters alone, according to the American Farm Bureau Federation, and federal crop insurance covered only 53% of weather-related damages that year. Satellite-based monitoring and AI advisory systems, like the ones described below, are how a growing share of US operations are closing that gap.
This article covers what agricultural risk assessment actually measures, how ag risk management technology and grain risk management technology differ in practice, what AI-powered vegetation management adds to the picture, and where Farmonaut’s platform fits for farmers who want to act on this data rather than just read about it.
Table of Contents
- The 2024 US crop loss picture, by peril
- What agricultural risk assessment actually measures
- Grain risk management technology vs. ag risk management technology
- AI-powered vegetation management: what it adds
- How Farmonaut’s platform applies this
- Risk assessment data and crop insurance
- Calculator: estimate your uninsured weather-loss exposure
- Where AI adoption in US agriculture stands
- FAQ
- Try it: Run your own numbers

The 2024 US Crop Loss Picture, By Peril
Any agricultural risk assessment framework starts with knowing which perils actually drive losses, and by how much. The American Farm Bureau Federation’s 2024 analysis breaks US crop losses down by cause: drought, excessive heat, and wildfires together accounted for more than $11 billion; flooding and hurricanes caused $6.7 billion; hail caused $1.2 billion; insects caused $43 million; and plant disease caused $34 million. A single hailstorm on July 6, 2024 caused $148.5 million in crop losses on its own, per Crop Insurance in America’s year-in-review report.
These figures matter for risk assessment because they show where satellite monitoring has the highest payoff: drought and heat stress are visible in vegetation index data weeks before a combine ever enters the field, while a single hail event is sudden and localized — the kind of loss that field-level imagery can document for a claim after the fact, even though it can’t be predicted.
For the most current version of this breakdown, the American Farm Bureau publishes updated market intelligence after major storm events at fb.org/market-intel, typically within two to three weeks of an event. Treat the 2024 figures above as the most recent full-year baseline, not a permanent number — check that page for the current year’s running total.
What Agricultural Risk Assessment Actually Measures
Agricultural risk assessment is the process of scoring a field, farm, or portfolio against specific, quantifiable exposures — not a general sense that “weather is a risk.” A usable assessment answers four questions for a given field and season:
- Weather exposure: What is the probability of drought, excessive heat, hail, or flood for this specific location, based on current-season forecasts and historical frequency?
- Crop health trajectory: Is vegetation vigor (measured via NDVI and related indices) tracking normal for this crop stage, or diverging?
- Insurable vs. uninsured exposure: What share of potential loss is covered by an existing policy, and what is left as self-insured risk?
- Market and timing risk: Does the yield and quality trajectory support the marketing plan already in place?
Under this definition, satellite-based risk assessment is not a replacement for federal crop insurance or historical yield records — it’s the layer that tells a producer or lender which fields need attention this week, using data that didn’t exist for the naked eye. USDA NASS’s 2024 record numbers illustrate the baseline this is measured against: US corn yield hit a record 179.3 bushels per acre, and wheat yield was 51.2 bushels per acre, both per NASS’s August 2024 forecast. A field tracking meaningfully below those benchmarks, visible in real time, is a risk signal — not a surprise at harvest.
Traditional vs. AI-Powered Risk Assessment
| Aspect | Traditional Methods | Farmonaut’s AI Technology |
|---|---|---|
| Crop Monitoring | Manual field inspections | Satellite imagery and AI analysis, refreshed on each pass |
| Risk Assessment | Based on historical data and experience | Real-time data analysis and predictive modeling |
| Resource Allocation | Uniform application across fields | Precision application based on field-specific needs |
| Yield Prediction | Estimation based on past yields | AI-powered forecasts using multiple data points |
| Decision-Making Speed | Days to weeks | Near real-time insights |
Grain Risk Management Technology vs. Ag Risk Management Technology
These two terms get used interchangeably, but they answer different questions. Grain risk management technology is narrower: it focuses on stored and marketed grain — moisture content, storage condition monitoring, basis and futures exposure, and delivery timing against contracts. Ag risk management technology is the broader category, covering everything from standing-crop weather exposure to input-cost risk to compliance risk across any commodity, not just grain.
Farmonaut’s platform sits in the ag risk management technology category: satellite crop health monitoring, the Jeevn AI advisory system, weather-risk integration, and carbon footprinting all apply across row crops, tree crops, and other commodities, not grain alone. Where grain-specific risk (in-bin spoilage, basis risk) requires dedicated storage sensors and market-data feeds, Farmonaut’s strength is the pre-harvest window: knowing which acres are underperforming while there is still time to act, and having the field-level documentation ready if a loss does occur.
In practice, most operations need both: a standing-crop risk layer (ag risk management technology, satellite-driven) and a post-harvest grain risk layer (grain-specific, storage- and market-driven). Conflating them is a common reason risk assessments miss coverage — a field can look fine on the grain-marketing side and still be accumulating uninsured weather exposure that only shows up in vegetation data.
AI-Powered Vegetation Management: What It Adds
AI-powered vegetation management is the specific application of machine learning to vegetation index data — NDVI and related indices derived from multispectral satellite imagery — to detect crop stress, pest pressure, or disease before visible symptoms appear. The mechanism: AI models are trained on patterns in reflectance data that correlate with known stress events, so a divergence from a field’s own normal trajectory (or from neighboring fields under similar conditions) can be flagged automatically rather than waiting for a scout to notice discoloration on the ground.
This matters directly for the loss categories above. Insect damage ($43 million in 2024, per the American Farm Bureau) and plant disease ($34 million) are exactly the kind of gradual-onset losses that vegetation-index anomalies can catch early, days to weeks before a field walk would. Drought and heat stress — the largest 2024 loss category at over $11 billion — show up in vegetation and soil-moisture data even earlier, since canopy stress typically precedes visible wilting.
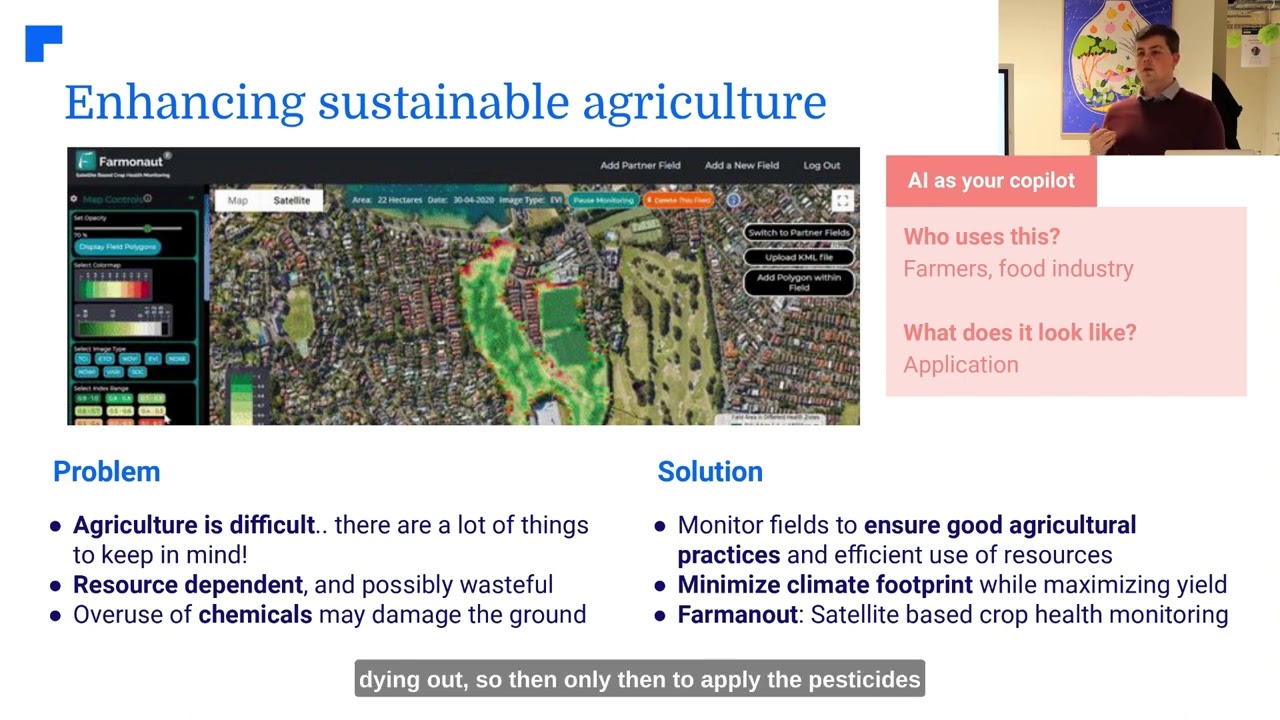
Farmonaut’s satellite-based crop health monitoring applies this approach: multispectral imagery is processed for NDVI and soil moisture, and the Jeevn AI advisory layer converts that into field-specific recommendations rather than a raw index the farmer has to interpret unassisted.
How Farmonaut’s Platform Applies This

Farmonaut is an agritech company built around five components that work together for risk assessment and crop efficiency:
- Satellite-Based Crop Health Monitoring: Multispectral imagery delivers NDVI and soil moisture readings at the field level, refreshed on each satellite pass.
- Jeevn AI Advisory System: Personalized farm advice, weather forecasts, and crop management guidance generated from the monitoring data, not a generic calendar.
- Blockchain-Based Traceability: Supply-chain transparency and record integrity from field to buyer.
- Fleet and Resource Management: Tools for scheduling and optimizing machinery and labor.
- Carbon Footprinting: Emissions tracking for farms managing sustainability reporting or compliance requirements.
The risk-relevant output is field-level documentation: a time-stamped, geolocated record of vegetation health and soil moisture trends that exists independently of memory or a single field visit. That record is what makes a risk assessment defensible — to a lender, an insurer, or the farm’s own planning process — rather than anecdotal.
Explore Farmonaut’s AI-powered solutions:



Risk Assessment Data and Crop Insurance
Federal crop insurance is the backbone of US agricultural risk management, but it does not cover every loss. In 2024, private crop insurance provided $45.411 billion in total protection coverage, and indemnity payments totaled $1.154 billion, according to Crop Insurance in America’s year-in-review report. Coverage extended to 89% of acreage across the eight major US field crops. Yet only 53% of 2024’s weather-related farm damages were covered by crop insurance — meaning close to half of that year’s weather losses fell on farm operations directly.
This is where field-level risk data does double duty: it supports insurance claims with verifiable, dated evidence of crop condition, and it identifies the uninsured gap so a farm or lender can decide whether to self-insure, adjust coverage, or change practices on exposed acres. For financial institutions, the same data improves loan and policy risk assessment — verifiable crop condition history is a better underwriting input than a borrower’s self-report.
For the current year’s federal crop insurance totals, USDA’s Risk Management Agency publishes annual summaries with state and commodity detail at rma.usda.gov; figures are typically finalized by May of the year following harvest, so treat the 2024 numbers above as the latest finalized full year until that update lands.
Calculator: Estimate Your Uninsured Weather-Loss Exposure
Using the national 2024 benchmark that 53% of weather-related damages were covered by crop insurance, estimate the uninsured share of your own potential weather loss and see what a percentage-point improvement in coverage would be worth.
Run your own numbers
Assumptions: uses your entered acreage, per-acre value, and assumed loss rate as flat inputs across all acres; does not account for crop-specific insurance products, deductibles, or per-acre coverage limits. The 53% benchmark is the 2024 US national average share of weather-related farm damages covered by crop insurance, per Crop Insurance in America’s 2024 Year in Review — your policy’s actual coverage will differ by crop and state.
Where AI Adoption in US Agriculture Stands
Precision agriculture adoption is now mainstream in the US: 70% of farmers reported implementing at least one precision agriculture technique as of USDA ERS’s 2024 data, though only 27% of farms use advanced precision practices — the gap between basic GPS guidance and full AI-driven decision support. The AI-in-precision-agriculture market itself was valued at $1.2 billion in the US in 2024, with projections reaching $4.1 billion by 2034 according to market research cited by iMarc Group.
USDA ERS does not break this down by state or farm size in the chart cited above, so region-specific or farm-size-specific adoption figures aren’t available from that source; the ERS charts-of-note series at its data-products page is the place to check for a future breakdown if one is published. What is measurable now is the gap itself: most US farms have some precision tool in place, but fewer than three in ten are using the advanced, AI-driven layer — vegetation-index anomaly detection, predictive yield modeling, automated advisory — that catches the early-stage losses described above.
Farmonaut’s AI-driven advisory system is built for that 27% advanced-practice tier specifically: pattern recognition in satellite imagery, predictive analytics for yield and harvest timing, and automated, field-specific recommendations through the Jeevn AI system, improving as more seasons of data accumulate for a given field.

AI-Powered Farm Decision-Making and Sustainability
AI-powered farm decision-making, in this context, means feeding the field-level monitoring above into concrete choices: irrigation timing, input application rates, and harvest scheduling. It also extends into compliance and sustainability reporting, where Farmonaut’s carbon footprinting feature helps operations track and reduce emissions. Related applications include soil health monitoring, precision irrigation to reduce water waste, and targeted input application to cut chemical use.
Developers building custom integrations — for a farm management system, a lender’s underwriting pipeline, or an insurer’s claims tool — can access the underlying satellite and weather data directly:

Earn With Farmonaut: Join our affiliate program and earn 20% recurring commission by sharing your promo code and helping farmers save 10%. Onboard 10 Elite farmers monthly to earn a minimum of $148,000 annually—start now and grow your income!
Limits Worth Knowing
Two figures readers often look for aren’t publicly available yet. First, USDA and peer-reviewed sources have not published a quantified yield-lift percentage specifically attributable to AI-driven risk-management tools (as distinct from precision agriculture generally) — market-size projections exist, but a validated “X% yield improvement” figure from AI risk tools specifically does not, so treat any such number you see elsewhere as unverified. Second, whether 2024’s loss totals represent a rising trend or a single severe year requires multi-year NOAA archival comparison that current-year summaries don’t include; the American Farm Bureau’s market-intel page is the place to track as future years post.
Frequently Asked Questions
- What is Farmonaut?
Farmonaut is an agricultural technology company that provides satellite-based farm management and risk assessment solutions through web and mobile applications. - What does agricultural risk assessment technology actually monitor?
It tracks weather exposure, vegetation health trends (via satellite NDVI), the gap between insured and uninsured potential losses, and yield trajectory against historical and regional benchmarks. - How much did US weather disasters cost farmers in 2024?
$20.3 billion in total, per the American Farm Bureau Federation, with $11 billion-plus from drought, heat, and wildfire and $6.7 billion from flooding and hurricanes. - Does crop insurance cover all weather losses?
No. Only 53% of 2024’s weather-related farm damages were covered by crop insurance, per Crop Insurance in America, even though federal coverage reached 89% of acreage on the eight major field crops. - How is grain risk management technology different from general ag risk management technology?
Grain risk management technology focuses on stored and marketed grain (moisture, storage condition, basis risk). Ag risk management technology is broader, covering standing-crop weather and health risk across any commodity — the category Farmonaut’s satellite platform operates in. - Is Farmonaut’s data secure?
Farmonaut prioritizes data security and privacy, ensuring that farmers’ information is protected and used responsibly.
Farmonaut Subscription Plans

 eKGIS
eKGIS Mostas Tech
 AgroStar
 Native Seeds
 Andex
Andex FCF India
 Unifrutti Gulf
 Deluxe Conseil
 TVS Electronics
 BW Pipelines
 WICO
WICO Chimera Innovation
 SkyHarvest
 Polaris Digitech
 Teledarbas
