

Argentina silver · Mine and company comparison
Argentina Silver Mines: Producers and Projects Compared
Argentina mined an estimated 800 tonnes of silver in 2025, about 3% of world output (USGS). This guide compares the producing mines in Santa Cruz and the silver projects in Salta, with owners, dated figures and a calculator.
Key takeaways
- Argentina mined about 800 t of silver in 2025 and holds 6,500 t of reserves, behind nine countries on the USGS list, including Mexico, Peru and China (USGS, 2026).
- San Jose produced 3.6 Moz of silver in 2025 on a 100% basis; Cerro Moro produced 2.5 Moz (McEwen; Pan American Silver).
- El Quevar in Salta has an indicated resource of 45.3 Moz at 482 g/t silver (Argenta Silver, 30 June 2026).
- Diablillos has reserves of 183 Moz silver and a feasibility study with first production targeted before end-2029 (AbraSilver, 22 June 2026).
- Check the category, date, price and ownership basis of every figure before comparing projects.
In this article
- Argentina silver mines: the short answer
- How we chose the mines and projects
- Where Argentina ranks in world silver mining
- Producing silver mines in Argentina compared
- Salta mining companies and projects
- How much silver is in the ground: reserves and resources
- What the silver price means for these projects
- What drives demand for Argentine silver
- How to read the cost of an ounce
- Checks before you rely on a silver project's numbers
- Screening ground from space before drilling
- Water, tailings and community issues
- Frequently asked questions
Argentina silver mines: the short answer
Argentina is a mid-sized silver producer. The U.S. Geological Survey estimates it mined 800 tonnes of silver in 2025, about 3% of the world total of 26,000 tonnes, and puts its reserves at 6,500 tonnes (USGS Mineral Commodity Summaries, February 2026). That is roughly 26 million troy ounces (Moz) mined in a year and about 209 Moz in reserves.
Most of the silver comes out of gold-silver mines in Santa Cruz province in Patagonia, where silver is mined next to gold. Salta, in the north-west, is different: it has one operating gold mine and two silver-led projects that are still in the study or drilling stage. This guide compares the producing mines, then the Salta companies, and shows where the numbers come from so you can check them.
Two terms first. A by-product is a metal recovered alongside the main metal, so the mine’s economics follow the main metal. Moz means million troy ounces; one troy ounce is 31.1035 grams. A grade in g/t means grams of metal per tonne of rock.
How we chose the mines and projects
We included the Argentine silver sources that we could confirm from an owner’s own report or filing: three producing gold-silver mines in Santa Cruz, and three Salta assets (El Quevar, Diablillos and Lindero). Other producers exist, including Veladero, a gold mine owned by Barrick and Shandong Gold that also recovers silver as a by-product. We ranked nothing by a single score. Instead each entry shows the same four facts: who owns it, where it is, what it produced or contains, and the date and basis of that number.
Output figures use different periods and bases, because companies report differently. San José is shown on a 100% basis for 2025, Cerro Moro as a full-year 2025 figure and as the first half of 2026. Cerro Vanguardia reports silver only as a regional total, so we show it as such. Treat the table as a map of who produces what, not a league table.
Where Argentina ranks in world silver mining
Argentina sits well behind the leaders. Mexico mined an estimated 6,300 tonnes in 2025, Peru 3,600 and China 3,400, while Argentina mined 800 tonnes, behind nine countries on the USGS list (USGS, 2026). Among its neighbours, Bolivia mined 1,500 tonnes and Chile 1,400. Argentina’s output has still edged up, from 774 tonnes in 2024 to an estimated 800 in 2025.
Chart
Silver mine output, 2024 and 2025, four Andean countries
Tonnes of contained silver (USGS)
Chart
Silver mine production, top producers and Argentina, 2025
Tonnes of contained silver (USGS estimates)
Silver itself has been in a market deficit, meaning demand has exceeded supply. The Silver Institute said in February 2026 that 2025 was silver’s strongest price year since 1979 and expected a sixth straight annual deficit in 2026 (Silver Institute, 10 February 2026). That is the backdrop that makes undeveloped silver projects interesting to investors.
Producing silver mines in Argentina compared
All three mines below are in Santa Cruz province. They are gold-silver operations, so their reports lead with gold.
Chart
Annual silver output: two mines against the country
Million troy ounces, 2025 (San Jose on a 100% basis; Argentina is the USGS estimate converted from tonnes)
| Mine | Owner (share) | Main metals | Latest silver figure | Best for |
|---|---|---|---|---|
| San José | Hochschild Mining 51%, McEwen 49% | Gold and silver, underground | 3.6 Moz in 2025 (100% basis) | Reading a high-grade silver mine |
| Cerro Moro | Pan American Silver 100% | Silver and gold, underground and open pit | 2.5 Moz in 2025; 1.26 Moz in the first half of 2026 | Tracking quarterly silver output |
| Cerro Vanguardia | AngloGold Ashanti 92.5%, Fomicruz 7.5% | Gold, silver by-product | Not reported separately (3.3 Moz for AngloGold’s whole Americas region in 2025) | A long-running mine with a licence to 2036 |
Cerro Moro, Pan American Silver
Cerro Moro is a 100%-owned underground and open-pit mine in Santa Cruz. Pan American reports 2.5 Moz of silver and 83.1 thousand ounces of gold for 2025 (Pan American Silver, operations page). In the first half of 2026 it produced 1,261 thousand ounces of silver against 1,033 thousand in the first half of 2025, with the average silver grade of ore processed rising from 164.9 to 189.6 g/t (Pan American Silver, 30 June 2026 report). The company links the increase to mining higher-grade zones.
Pros: reports every quarter, grades are improving, and the owner is a dedicated silver producer. Cons: gold by-product credits swing the cost per ounce, so a single quarter can mislead.
San José, Hochschild and McEwen
San José is a high-grade underground mine in Santa Cruz, about 350 km south-west of Comodoro Rivadavia. McEwen reports that on a 100% basis the mine produced 77 thousand ounces of gold and 3.6 Moz of silver in 2025, at average grades of 4.0 g/t gold and 190 g/t silver; McEwen’s 49% share was 1.8 Moz of silver (McEwen, San José mine page). Hochschild Mining holds the other 51%.
Pros: grades of 190 g/t silver are high for a producing mine. Cons: the sum depends on which share you count, so always check whether a figure is 100% or attributable.
Cerro Vanguardia, AngloGold Ashanti
Cerro Vanguardia is described in AngloGold Ashanti’s annual filing as a production-stage gold-silver operation, with silver as a by-product. AngloGold owns 92.5% and the Santa Cruz state company Fomicruz holds 7.5%; the mining licence runs to 26 December 2036; and the district has more than 100 gold and silver epithermal veins (AngloGold Ashanti Form 20-F). Gold output was 179 thousand ounces in 2025. The filing reports silver only for the whole Americas region, at 3.3 Moz in 2025, so we do not give a mine-level silver number. An epithermal vein is a mineral-filled crack formed by hot water close to the surface; it is the main style of silver-gold deposit in Argentina.
Pros: state partner and a licence that runs for another decade. Cons: silver is not reported by mine, so it is hard to follow.
Salta mining companies and projects
Its precious-metals story rests on three assets, owned by companies that report to Canadian securities regulators. This section gives facts only; it is not investment advice.
| Company (listing) | Asset | Metal | Stage | Latest fact |
|---|---|---|---|---|
| Argenta Silver (TSXV: AGAG) | El Quevar, 100% | Silver | Drilling and metallurgical tests | Indicated resource 45.3 Moz at 482 g/t |
| AbraSilver (TSX: ABRA) | Diablillos, 100% | Silver and gold | Feasibility study done, permitting and financing ahead | Reserve of 183 Moz silver |
| Fortuna | Lindero | Gold | Operating heap-leach mine | 20,829 oz of gold in Q2 2026 |
El Quevar, Argenta Silver
Argenta owns 100% of the 57,000-hectare El Quevar project. Its main deposit, Yaxtché, has an indicated resource of 45.3 Moz of silver in 2.93 million tonnes at 482 g/t and an inferred resource of 4.1 Moz in 0.31 million tonnes at 417 g/t (Argenta Silver news release, 30 June 2026). An indicated resource is known with enough confidence for a mine study; an inferred one is less certain and cannot be used for economics on its own.
In the same release the company reports more than 20 exploration targets, about 22,000 metres drilled since May 2025, a second drill rig moved onto the resource, metallurgical results expected in the third quarter of 2026, and a treasury of C$30 million. One hole at the nearby Mani-Copan target returned 4,982 g/t silver over 7.5 metres. These are drilling results, not a new resource estimate.
Best for: readers who want high-grade silver exposure and accept exploration-stage risk. Pros: very high grade and a large land package. Cons: no economic study yet, so there is no cost or capital figure to test.
Diablillos, AbraSilver
AbraSilver owns 100% of Diablillos in Salta and Catamarca provinces. Its definitive feasibility study (DFS), released on 22 June 2026, describes a 9,000 tonnes-per-day open-pit operation with initial capital of US$722 million and an after-tax net present value (NPV) at a 5% discount rate of US$3.0 billion, an internal rate of return of 41.9% and a 1.7-year payback. Those results use base-case prices of US$50 per ounce silver and US$3,650 per ounce gold (AbraSilver news release, 22 June 2026).
The same release states proven and probable reserves of 77.9 million tonnes at 146 g/t silver-equivalent (AgEq), holding 183 Moz of silver and 1.8 Moz of gold, calculated at lower prices of US$29.50 silver and US$2,800 gold. Life-of-mine output averages 5.9 Moz silver and 62 thousand ounces gold a year over 25 years, with first production targeted before the end of 2029 and a final investment decision (FID) expected in the second quarter of 2027. AgEq converts the gold into the silver amount that would earn the same revenue.
Best for: readers who want a study-backed project. Pros: a feasibility study, reserves and a stated schedule. Cons: capital of US$722 million still has to be raised, and permits are still to be received before production.
Lindero, Fortuna
Lindero is a gold mine in Salta that Fortuna developed through its subsidiary Mansfield Minera (Panorama Minero). It is a heap-leach operation, where crushed ore is stacked in a pile and dissolved with a weak cyanide solution to recover the gold. Fortuna reported 20,829 ounces of gold in the second quarter of 2026, against 23,550 ounces a year earlier, because a planned 30-day shutdown replaced the foundations of the primary crusher (Fortuna Q2 results). Lindero is relevant here because it shows that a mine can operate in Salta’s high desert and be affected by the Argentine peso, which Fortuna named as a cost factor.
Salta also hosts lithium brine projects. They are covered in our separate guide to Argentina lithium and are not silver assets.
How much silver is in the ground: reserves and resources
The two Salta silver projects are not measured on the same basis, and this is where readers go wrong. A reserve is the part of a resource shown by a feasibility-level study to be economic to mine. A resource is mineralisation with reasonable prospects of being mined, before that proof. Diablillos reports reserves; El Quevar reports resources. Contained ounces are not the ounces you will sell, because mills recover only part of them.
The calculator below turns any tonnage and grade from a company report into contained and recovered ounces. The default numbers are El Quevar’s indicated resource, so you can check the 45.3 Moz figure (the tonnage is rounded, so the result shows 45.4).
Calculator
How much silver is in a resource, and what is it worth?
Enter tonnage, grade, recovery and price from a company report.
- Recovered silver: 38.6 Moz
- Gross value of recovered silver (US$ million): 1,930 US$m
Defaults are El Quevar’s indicated resource (Argenta Silver, 30 June 2026) so you can approximate its 45.3 Moz (the rounded tonnage gives 45.4); they are not a forecast. Recovery is an example, not a figure from any study. Price is an input: example, use today’s price (US$ per troy ounce).
What the silver price means for these projects
Project values move with the price assumed. Diablillos shows this clearly: reserves are calculated at US$29.50 per ounce, while the economics use US$50. Kitco showed spot silver at US$56.98 per ounce on 15 October 2026 at 2:50 p.m. EDT (Kitco, 15 October 2026). The U.S. average for 2025 was about US$38 an ounce, up from US$28.37 in 2024 (USGS, 2026). Silver passed US$100 in January 2026 before falling back (Silver Institute, February 2026). A price that swings that much is why a study that uses a stated, lower price for reserves is easier to trust.
For by-product mines, gold matters as much. Cerro Moro’s cost per silver ounce was negative in the second quarter of 2026 (US$-58.37 per ounce, against US$-0.47 a year earlier) because gold credits were larger than the cost of mining (Pan American Silver, 30 June 2026 report). Our wider guide to silver mining and silver ore trends covers the global picture.
What drives demand for Argentine silver
Silver is used in electronics, solar panels, jewellery, coins and bars. The Silver Institute forecast that global silver demand would stay broadly flat in 2026, with industrial fabrication falling about 2% to a four-year low near 650 Moz as solar makers use less silver per panel, while jewellery was forecast to drop more than 9% to 178 Moz and retail investment to rise (Silver Institute, 10 February 2026). Data centres, artificial-intelligence hardware and cars were named as growth areas that partly offset the solar decline.
For a project in Salta this matters in one way: the buyer of the concentrate or doré (the unrefined gold-silver metal bar) pays a price set on world markets, so local costs and the exchange rate decide the margin. Argentina’s peso is the cost factor Fortuna cited for Lindero in 2026, and the same applies to any new mine.
How to read the cost of an ounce
Companies report all-in sustaining cost (AISC), the cost of mining and keeping a mine running per ounce sold, including sustaining capital and general costs. For a by-product mine the number depends on how gold credits are counted. Pan American’s Cerro Moro showed a negative AISC per silver ounce in the second quarter of 2026 because gold sales offset the cost, while AbraSilver quotes US$20 per ounce of silver-equivalent over the life of mine. The two figures are not comparable: one nets off gold, the other converts gold into silver ounces. Ask which method a company uses before you compare.
Capital cost is the other half. Diablillos needs US$722 million before the first ounce, plus US$520 million of later sustaining capital that the company expects to fund from operating cash flow. Divide capital by annual silver-equivalent output (about 10 Moz AgEq a year over the mine life) to get a rough measure of how heavy the build is, then check the same ratio for other projects.
Checks before you rely on a silver project’s numbers
- Find the category. Reserve, measured, indicated and inferred carry different confidence. Add them only if the company does.
- Read the date and price. A resource from 2024 is not updated by a drilling result in 2026.
- Check the basis. 100% or attributable share? Silver or silver-equivalent?
- Look for the study stage. Scoping, pre-feasibility and feasibility studies are not alike; only the last supports a financing decision.
- List what is left to do. Permits, financing, power, water and a decision to build.
- Compare with peers. A US silver mine such as Greens Creek in Alaska, or the Canadian names in our guide to Canadian mining companies, help show what a producing mine looks like.
Our overview of mining investments and the stock-by-stock notes on mining stocks explain how to read these reports further. This page does not give price targets or buy or sell views.
▶ Explains what AI does in mineral exploration, where it fails and how to check any claim. · 4:37
Screening ground from space before drilling
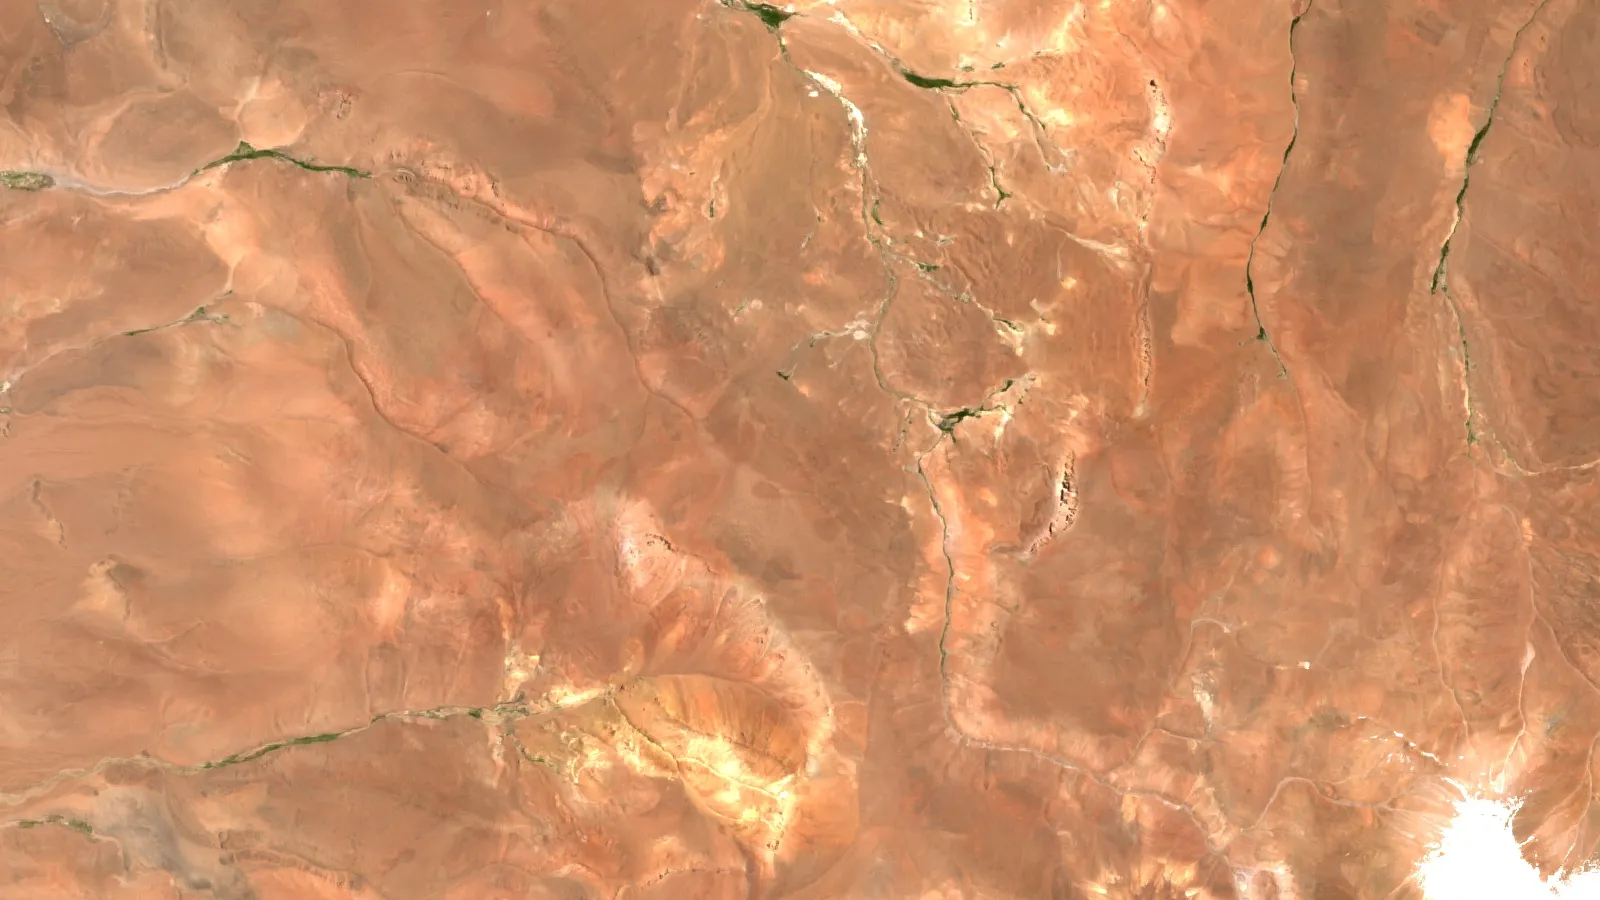
Before drilling, explorers look at whether the ground shows the clay and iron-oxide alteration typical of silver-bearing epithermal systems. Satellite images such as Sentinel-2 can map that alteration over a large area, which narrows where to walk and sample. It produces exploration targets, not a resource estimate, and it does not replace drilling.
Farmonaut screens a client’s area of interest, supplied as a KML, KMZ or polygon, for gold, silver and other minerals, with results in 5 to 20 business days. The hero image on this page is a Sentinel-2 view of the El Quevar area.
▶ Explains remote sensing for mining in plain words: the instruments and why agreement between them matters. · 2:01
Water, tailings and community issues
Silver and gold mines in dry regions like the Puna and Patagonia face the same questions as elsewhere: water use, how tailings (the waste left after processing) are stored, and what local communities receive. When you read a company report, look for a water balance, a tailings design and a community agreement. Our guides to sustainable mining practices and tailings management software explain what good practice looks like, and the page on Alaska gold mining jobs and environmental results shows how another jurisdiction reports it. Argenta’s June 2026 release said an environmental baseline study by Ausenco was expected in July 2026, which is the kind of document to look for in any project.
Frequently asked questions
Does Argentina have a lot of silver?
It has a moderate amount. The USGS lists 6,500 tonnes of reserves and 800 tonnes of mine output in 2025, behind nine countries on the USGS list, including Mexico, Peru and China (USGS, 2026).
Which Argentine province has the most silver mines?
Of the producing mines covered here, all three silver-producing mines (Cerro Moro, San José and Cerro Vanguardia) are in Santa Cruz province. Salta has silver projects but no silver mine in production in this guide.
Is there silver mining in Salta?
Not yet at scale. El Quevar is in the drilling and testing stage, and Diablillos has a feasibility study with first production targeted before the end of 2029, subject to financing and permits.
What is the El Quevar project?
El Quevar is a 57,000-hectare silver project in Salta owned 100% by Argenta Silver. Its Yaxtché deposit has an indicated resource of 45.3 Moz of silver at 482 g/t.
Who owns Diablillos?
AbraSilver Resource Corp. (TSX: ABRA) owns 100%. The project lies in Salta and Catamarca provinces.
Is Lindero a silver mine?
No. Lindero is a heap-leach gold mine in Salta owned by Fortuna, which reported 20,829 ounces of gold for the second quarter of 2026.
How many ounces are 800 tonnes of silver?
About 25.7 million troy ounces, using 32,150.7 troy ounces per tonne.
What is the difference between a silver reserve and a resource?
A resource is mineralisation that could be mined; a reserve has passed a feasibility-level study showing it is economic. Reserves are the more reliable number.
Can satellites find silver?
Satellites can map alteration minerals that often surround silver-bearing veins, which helps rank targets. Only sampling and drilling confirm silver grade.
How do I check a company’s silver claims?
Read the technical report filed with the regulator, note the category and date of each figure, and compare with the company’s latest quarterly report. Our checks section above lists the steps.
This page is for information only. It is not investment advice. It gives no price targets and no buy or sell view. Company figures come from their own releases and may change; check the filings on SEDAR+ or EDGAR.
Farmonaut mining
See a licence area from space before drilling
Investors can see how satellite data screens a licence area for minerals as an exploration target, ahead of a resource estimate.

Mining Pro sample view, synthetic data
Keep reading
Sources
- USGS, Mineral Commodity Summaries 2026: Silver: pubs.usgs.gov
- Silver Institute, 2026 outlook press release (10 February 2026): silverinstitute.org
- Pan American Silver, Cerro Moro operations page: panamericansilver.com
- Pan American Silver, report for the period ended 30 June 2026: panamericansilver.com
- McEwen, San Jose mine page: mcewenmining.com
- AngloGold Ashanti, Form 20-F for 2025 (Cerro Vanguardia): sec.gov
- Argenta Silver, news release of 30 June 2026 (El Quevar): stockwatch.com
- AbraSilver, Diablillos feasibility study release (22 June 2026): nasdaq.com
- Fortuna, second quarter 2026 results (Lindero): finviz.com
- Panorama Minero, Lindero gold mine in Salta: panorama-minero.com
- Kitco, silver price (15 October 2026): kitco.com
Discussion
Questions, corrections or field experience? Share them below. First-time comments are reviewed before they appear, and your email is never published.
No comments yet. Be the first to add a question or your experience.

 Rains of Favour
 Tintina Mining Group
 Dalgety Minerals Pty Ltd
 Vortex Minerals Pty Ltd
 Faith At Work (Pty) Ltd
 Geotech Mining Solutions plc
 Vulcan International Limited
 Kidepo Associates
 GKY Mining
 Alkimy SARL
 Double A Trading
 GemSprout Metals Limited
 Qader Group
 Ileys General Trading
 SG Gold Mining LLC
 VRV Global Pte Ltd
 Omsri International FZE
 G.I.T.T.
 Jaunita Erss Ltd
 Almosi SARL
 SRK Consulting
 Berks Gold Limited
 Mwerezi Minerals Company Limited
 Exploration consultancy · South Africa · Gold










