

Marketing to Farmers: US Sales Data by Channel
Reviewed August 2026 against USDA’s National Agricultural Statistics Service, USDA’s Economic Research Service, and Zimbabwe’s Agricultural Marketing Authority.
Try it: Run your own channel-mix numbers →
“Marketing to farmers” and “marketing for farmers and ranchers” are two different jobs. The first means selling inputs, equipment, or services to producers. The second — the subject of this article — means helping producers sell what they grow: which channel to use, when to sell, and at what price. That second job now moves real money in the United States. US producers sold $17.5 billion through direct-marketing channels in the 2022 Census of Agriculture, a 25% increase in inflation-adjusted terms since 2017, according to USDA’s Economic Research Service (ERS). Why agricultural marketing is important stops being an abstract question once you see how that $17.5 billion splits by channel — and the same five-part chain behind it also explains how Zimbabwe’s Agricultural Marketing Authority (AMA) runs marketing regulation at country scale.
What Marketing of Agricultural Products Actually Covers
Marketing of agricultural products is the set of activities that gets a crop or animal from the farm gate to a buyer at the best available price — distinct from production, even though the two get planned together. Five pieces recur on almost every farm and in almost every national marketing system:
- Assembly and grading — sorting output into the quality tiers buyers pay different prices for.
- Storage and timing — holding a crop to sell into a better price window instead of selling it all at harvest.
- Transport and logistics — getting product to the buyer in sellable condition, on schedule.
- Price discovery — knowing what a commodity or specialty product is worth this week, not last season.
- Promotion and channel choice — deciding whether a unit of production goes to a wholesaler, a retailer, an institution, or a direct customer.
That chain breaks down without a referee: grading standards need to be consistent across thousands of farms, price information needs to reach small producers as fast as it reaches large ones, and contracts need enforcement. Federal and state programs fill that role in the US; statutory marketing authorities fill it elsewhere. It’s also why agricultural careers built around this chain — graders, market analysts, logistics coordinators, commodity brokers — are a growing slice of the sector; see 10 agricultural careers shaping the sector for where those roles sit.
Why Agricultural Marketing Is Important: The US Numbers
Two USDA surveys make the case in dollars. USDA’s National Agricultural Statistics Service (NASS) found that 147,000 US farms sold food through direct-marketing channels in 2020, generating $9.0 billion, per the NASS Local Food Marketing Practices Survey release (April 28, 2022). Of that $9.0 billion: $4.1 billion came from sales to institutions and intermediaries (40,000+ farms), $2.9 billion from direct-to-consumer sales, and $1.9 billion from direct-to-retail sales (24,000+ operations). California led every state at $1.4 billion in total direct sales, and 78% of the farms selling this way sold exclusively within 100 miles of the farm — direct marketing, in the 2020 data, was mostly a local-radius business, run by an estimated 314,000 people, 43% of them women decision-makers.
By the 2022 Census of Agriculture, both the total and the mix had moved. ERS reports producers sold $17.5 billion through direct marketing in 2022 — a real annual growth rate of about 4.6% since 2017 — with the gain concentrated in retail, institutional, and intermediate channels, which rose 33.2% to $14.2 billion as the number of operations selling through them more than doubled to 60,332. Direct-to-consumer sales held flat in real terms at $3.3 billion, even as the number of farms selling that way fell 10.3% to 116,617. California’s share of the total climbed to 37.7%, concentrated along the West Coast and Northeast near metropolitan areas, per the ERS Chart of Note on 2022 direct farm sales (published March 21, 2024).
How the Money Is Moving: Channels From 2020 to 2022
Put the two surveys side by side and a trend an AI summary won’t draw out for you becomes visible: the channels farmers can reach without a middleman are shrinking in farm count, while the channels running through retailers, institutions, and intermediaries are the ones absorbing new supply.
| Channel | 2020 (NASS Local Food Survey) | 2022 (Census of Agriculture, via ERS) |
|---|---|---|
| Direct-to-consumer (farmers markets, CSA, on-farm stores, u-pick, online) | $2.9 billion | $3.3 billion (flat in real terms; farm count down 10.3% to 116,617) |
| Direct-to-retail | $1.9 billion (24,000+ operations) | Reported combined with institutions/intermediates below |
| Direct-to-institutions/intermediates | $4.1 billion (40,000+ farms) | Reported combined with retail below |
| Retail + institutional + intermediate, combined | $6.0 billion | $14.2 billion (+33.2%; operations more than doubled to 60,332) |
| Total direct marketing | $9.0 billion (147,000+ farms) | $17.5 billion (+25% inflation-adjusted since 2017) |
The 2020 row comes from NASS’s Local Food Marketing Practices Survey (released April 28, 2022); the 2022 row comes from the Census of Agriculture as summarized by ERS (March 21, 2024). The two surveys don’t use identical channel definitions, so read row-level changes as directional rather than a precise year-over-year delta.
Isolate the retail-plus-institutional-plus-intermediate lane on its own and the growth line is steep: $6.0 billion in the 2020 survey to $14.2 billion in the 2022 census, more than double in dollar terms across the two most recent USDA snapshots of this market. That is the channel a school district buys through, a regional grocery chain sources local produce through, and a food hub aggregates small-farm output through.
A channel mix built around 2020 assumptions is already dated. The fastest-growing lane by dollar volume runs through buyers who want contracts, food-safety paperwork, and delivery schedules — not a folding table at a Saturday market. The next Census of Agriculture is due in 2027; when USDA NASS refiles this survey, check the NASS Newsroom archive for the successor release before you plan a channel mix off the 2022 figures above.
Marketing for Farmers and Ranchers: What Moves the Needle
Penn State Extension’s guidance on agricultural marketing puts the starting point plainly: “the first step to successfully market food products is knowing your customers,” per Penn State Extension’s agricultural marketing resource page. Everything downstream — pricing method, channel choice, packaging — follows from that. Extension organizes the practical guidance into four areas: marketing fundamentals and customer research, pricing and year-round selling strategy, online marketing and e-commerce, and farm-market retail merchandising. Its e-commerce guidance rests on a specific figure: with 90% of American adults online, a farm’s digital presence has become a required piece of reaching a customer, not an optional add-on.
For row-crop and livestock operations alike, the levers are the same short list:
- Know which channel actually fits your volume. A small vegetable operation can serve a CSA; a large grain operation cannot sell direct-to-consumer at that scale — its lever is contract timing and storage, not a farm stand.
- Price deliberately. Target-return pricing, psychological pricing, and subscription pricing are distinct methods with different cash-flow effects; picking one by default costs money.
- Weigh direct against wholesale honestly. Direct sales carry a per-unit price premium but add packaging, staffing, and time costs that wholesale and institutional contracts do not.
- Ranchers run a parallel but separate track. Livestock marketing moves through sale barns, video and online livestock auctions, and direct meat sales that require state- or USDA-inspected processing before any retail sale — the channel economics are livestock-specific, not a copy of produce marketing.
- Treat e-commerce and social channels as distribution, not strategy. Extension’s resource frames online ordering and social media as tools for reaching a customer you’ve already identified, not a substitute for identifying one.
The channel-mix shift shows up clearly in shares rather than raw dollars. In the 2020 survey, direct-to-consumer sales were 32% of local-food revenue and retail-plus-institutional-plus-intermediate channels were 67%. By the 2022 census, direct-to-consumer had fallen to 19% of direct-marketing revenue, with the retail-plus-institutional-plus-intermediate lane rising to 81%.
GIS for Agriculture: Turning Maps Into Marketing Decisions
GIS and satellite-based tools feed marketing decisions in a specific way: they change what a producer knows about their own yield and risk before committing to a channel or a contract. A field-level yield forecast tells a grower how much volume they can promise a buyer; a soil-moisture or drought layer flags whether a crop should go into a forward contract now or be held. That link between mapping and marketing is why climate-smart agriculture practices and GIS-based monitoring keep showing up in the same conversation as pricing strategy.
USDA’s ERS tracks how this technology is spreading on US farms, and adoption is uneven by farm size. Guidance autosteering systems — the entry point for most precision-ag stacks — were used by 52% of midsize farms and 70% of large-scale crop-producing farms in 2023, up from single-digit adoption in the early 2000s. Yield monitors, yield maps, and soil maps together were used on 68% of large-scale crop-producing farms, per the ERS Chart of Note on precision agriculture adoption (published December 10, 2024). Small family farms — those with gross cash farm income under $350,000 — showed the lowest adoption in every category ERS measured, with the lowest of all among farms where the principal operator was retired or gross cash farm income was under $150,000. Operators who did adopt cited five reasons: higher yields, labor time savings, lower input costs, less operator fatigue, and soil-health or environmental benefit.
Farmonaut’s own satellite tools sit in that same category — crop-health monitoring, yield estimation, drought-risk flags, and soil-moisture layers built for this kind of pre-marketing decision. The climate-resilient farming practices that pair with GIS monitoring are the same ones that let a producer commit to a contract with more confidence in the volume they’re promising.
Zimbabwe’s Agricultural Marketing Authority: A National Marketing-Plus-GIS Model
Outside the US, Zimbabwe’s Agricultural Marketing Authority (AMA) is one of the more fully documented examples of a national body combining market regulation with GIS-based services under one roof — a useful comparison case, not a US regulator. Per the Authority’s own site, AMA’s mission is “to provide a conducive regulatory environment for sustainable marketing and production of agricultural products,” with a stated vision of “a sustainable and prosperous agricultural sector driven by effective marketing regulatory services by 2030,” per AMA’s official “About” page.
Cash Crops in Zimbabwe: What AMA Actually Regulates
AMA’s own site lists eight product categories under its mandate — the most direct answer available to what Zimbabwe’s AMA regulates:
| Product Category | What AMA Regulates |
|---|---|
| Grains & Oil Seeds | Traders, brokers, processors, warehouses, and contractors |
| Horticulture & Plantations | Large-scale, small-scale, and individual traders and wholesalers |
| Livestock | Abattoirs, processors, traders, buyers, and auctioneers |
| Agricultural Inputs | Large- and small-scale supplier vetting and certification |
| Macadamia | Merchants and seed growers |
| Cotton | Ginners, contractors, buyers, and traders/brokers |
| Industrial Hemp | Cultivation and processing licensing |
| Auction Floors | Horticultural markets and multi-product auction floors |
Notably absent from that list is tobacco — Zimbabwe regulates tobacco marketing under a separate body, the Tobacco Industry and Marketing Board, not through AMA. Cotton, industrial hemp, macadamia, and grains and oilseeds such as maize, soybeans, and sunflower are the crops AMA itself frames as commercial cash crops within its remit; these are the Zimbabwe agricultural products a search for “cash crops in Zimbabwe” is usually looking for. Zimbabwe’s cotton sector has its own export path, covered in general terms by the agricultural export process from farm to market, and input supply for these crops follows the trends described in agricultural input and bio-input planting trends. Crop-level performance data for the grains AMA regulates tracks the patterns in major crop trends in global food security.
GIS Services: What’s Public and What Isn’t
AMA’s website lists a “GIS Services” section in its navigation, but its published “About” content does not carry a public figure for hectares monitored, crop tonnage tracked, or update frequency — a gap worth naming plainly rather than filling with a guess. Anyone who needs a current figure on AMA’s GIS program should check AMA’s own site directly at ama.co.zw, since that is the Authority’s own channel for publishing updates to it.

See It in Action
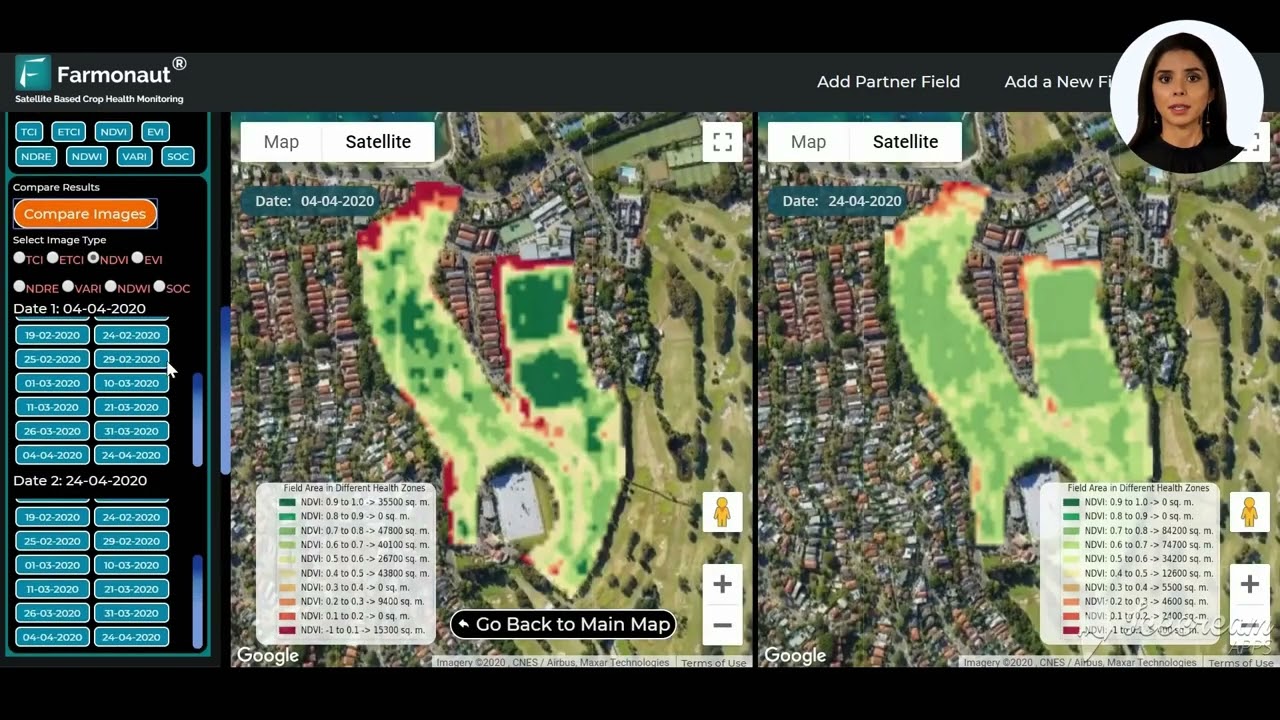
The clips below cover satellite crop monitoring and marketplace-style tools of the kind AMA’s GIS Services program and Farmonaut’s platform both point toward.



Try It: Direct vs. Wholesale Channel-Mix Calculator
Use your own harvest, prices, and time to see whether shifting volume into a direct channel beats selling everything wholesale, once your labor is counted.
Run your own numbers
Assumptions: prices per unit stay constant regardless of volume sold; “extra hours” is the total incremental time direct marketing adds for the season, valued at the hourly rate you enter. It excludes packaging, transport, certification, or platform fees, which differ by channel and should be added on top for a full comparison.
A Marketing Checklist You Can Reuse Every Season
The dollar figures above will have a successor within a few years; this checklist won’t, because it names the method rather than the number:
- Re-pull the latest Census of Agriculture and Local Food Marketing Practices Survey figures from NASS’s Quick Stats database before finalizing a channel mix. The Census of Agriculture runs on a five-year cycle, with the next one due in 2027 — check the NASS Newsroom archive for its successor release before trusting the $17.5 billion and $9.0 billion figures above as current.
- Check a yield or drought-risk map before committing volume to a contract. Whether that comes from ERS’s precision-ag data, a state extension tool, or a GIS platform like Farmonaut’s, know your likely volume before you promise it.
- Track weekly price data for your specific commodity through USDA’s Market News service rather than relying on last season’s price.
- Revisit the direct-vs-wholesale split at least once a season using the calculator above with current prices, not the numbers you used last time.
- If selling in Zimbabwe or a similarly regulated market, confirm current designated-product rules directly with the relevant authority — AMA’s own site for Zimbabwe’s grain, cotton, hemp, and horticulture rules — rather than a secondhand summary.
Explore Farmonaut’s Satellite Tools
For producers weighing channel decisions against real field conditions, Farmonaut’s satellite platform provides the crop-health, yield, and drought-risk layers referenced above.
Access Farmonaut’s services:

Explore Farmonaut’s API capabilities:
Farmonaut API
API Developer Docs
Download Farmonaut’s mobile apps:


FAQ Section
- Why is agricultural marketing important?
Because it’s the difference between what a farm produces and what it actually earns. USDA data shows US producers moved $17.5 billion through direct-marketing channels in the 2022 Census of Agriculture alone, and the channel a farmer chooses changes both the price received and the labor cost of getting there. - What is the difference between marketing to farmers and marketing for farmers and ranchers?
“Marketing to farmers” usually means selling inputs, equipment, or services to producers. “Marketing for farmers and ranchers” means helping producers sell their own output — pricing, channel choice, and promotion of what they grow or raise. This article focuses on the second. - What does marketing of agricultural products actually include?
Assembly and grading, storage and timing, transport, price discovery, and channel/promotion decisions — the same five-part chain whether the product is US corn or Zimbabwean cotton. - What is Zimbabwe’s Agricultural Marketing Authority (AMA)?
AMA is Zimbabwe’s statutory body regulating the marketing, processing, and production of designated agricultural products — grains, oilseeds, horticulture, livestock, cotton, macadamia, industrial hemp, agricultural inputs, and auction floors — per AMA’s own “About” page. - What are the main cash crops in Zimbabwe?
Under AMA’s own regulatory list, the commercial crops covered are cotton, industrial hemp, macadamia, and grains and oilseeds such as maize, soybeans, and sunflower. Tobacco is Zimbabwe’s other major cash crop but is regulated separately, outside AMA’s mandate, by the Tobacco Industry and Marketing Board. - How does GIS help with agricultural marketing?
GIS and satellite monitoring give producers a field-level yield or drought-risk estimate before they commit volume to a contract or channel, which is a marketing input, not just a production one. US adoption of related precision-ag tools reached 68-70% of large-scale crop farms in 2023, per USDA ERS. - Where can I find current US direct-marketing figures instead of the ones cited here?
USDA NASS’s Quick Stats database and the Census of Agriculture (next full cycle due 2027) are the primary sources; both are cited above with their original publication dates so you can check what has changed since.

 Adgrid
 eKGIS
eKGIS Mostas Tech
 Native Seeds
 Andex
Andex FCF India
 Unifrutti Gulf
 Deluxe Conseil
 TVS Electronics
 BW Pipelines
 WICO
WICO Chimera Innovation
 SkyHarvest
 Polaris Digitech
 Teledarbas
