

Smart Digital Farming vs Digital Farming: What the Adoption Data Actually Shows
Reviewed August 2026 against USDA’s Economic Research Service, the World Bank, and the Food and Fertilizer Technology Center for the Asian and Pacific Region (FFTC).
Try it: Run your own numbers →
Smart digital farming combines whole-operation data tools — sensors, drones, connected machinery, AI advisory — with the field-level precision techniques that decide exactly where and when to apply water, fertilizer, or seed. Digital farming is the broader umbrella term for tying both of those layers together on one data platform. Agriculture blockchain is a separate thing entirely: a tamper-evident record of who handled a product and when, not a farming decision at all. As pioneers in the agritech industry, we tracked down the government data behind all three terms, plus the policy specifics behind Thailand’s Smart Farmer program, so you can see exactly how far apart adoption really is.
Smart Digital Farming vs. Digital Farming vs. Precision Agriculture: The Real Differences
These three terms get used interchangeably in search results, but the organizations that actually define them draw firm lines. Precision agriculture operates at the field or sub-field level — deciding how much input a specific patch of ground needs. Smart farming zooms out to the whole operation: fields, livestock, machinery, logistics, and labor, connected through data. Digital farming is the combination of both, plus the networking and web-based platforms that tie a farm’s data together end-to-end. Agriculture blockchain sits outside all three — it doesn’t decide anything about the crop; it just records who touched the product and when.
| Term | What It Actually Covers | Core Technologies | Documented Example |
|---|---|---|---|
| Precision Agriculture | Field- and sub-field-level input decisions | GPS/GNSS auto-steer, yield mapping, variable-rate applicators | Auto-steer guidance used on more than 50% of planted acreage for corn, cotton, rice, sorghum, soybeans and winter wheat (USDA ARMS analysis, Feb. 2023) |
| Smart Farming | Whole-operation management across fields, machinery and labor | IoT sensors, drones, connected machinery, AI advisory | Thailand’s Smart Farmer Development Project, extended to 12.6 million registered farmers starting in 2013 |
| Digital Farming | Precision agriculture and smart farming combined on one data platform | Cloud farm-management dashboards, satellite crop-monitoring APIs | Satellite crop-health APIs that merge field-level imagery with farm-wide advisory data |
| Agriculture Blockchain | Record-keeping only — who handled a product, when, under what conditions | Distributed ledgers, smart contracts, digital certificates of origin | Walmart’s mango pilot cut trace-back time from 7 days to 2.2 seconds (Congressional Research Service, May 2021) |
If you’re comparing a “tech farm” in one country against another, the underlying building blocks are usually identical — GPS guidance, multispectral satellite imagery, IoT soil sensors, and AI-driven advisory. What differs is adoption rate, farm size, and which policy body is pushing the rollout. That’s why the rest of this article sticks to two places where hard, sourced numbers exist: the United States, tracked by USDA’s Economic Research Service, and Thailand, tracked by its Ministry of Agriculture and Cooperatives.
How Widely Is Smart Digital Farming Actually Used? U.S. Guidance-System Adoption by Farm Size
USDA’s Economic Research Service tracks precision-agriculture adoption through the Agricultural Resource Management Survey (ARMS). Its analysis found automated guidance — auto-steer systems that keep equipment within inches of a planned pass — in use on more than 50% of the planted acreage for corn, cotton, rice, sorghum, soybeans, and winter wheat (USDA Economic Research Service, published Feb. 22, 2023, using ARMS data through 2019). That aggregate number hides a sharp split by farm size. Among corn growers surveyed in 2016, the largest-acreage farms had adopted auto-steer at 73% versus 10% on the smallest-acreage farms. The same gap shows up in every other crop ARMS tracks: 82% versus 7% for winter wheat (2017 survey wave), 68% versus 11% for soybeans (2018), and 67% versus 50% for cotton (2019) (USDA ERS Chart of Note #105914).
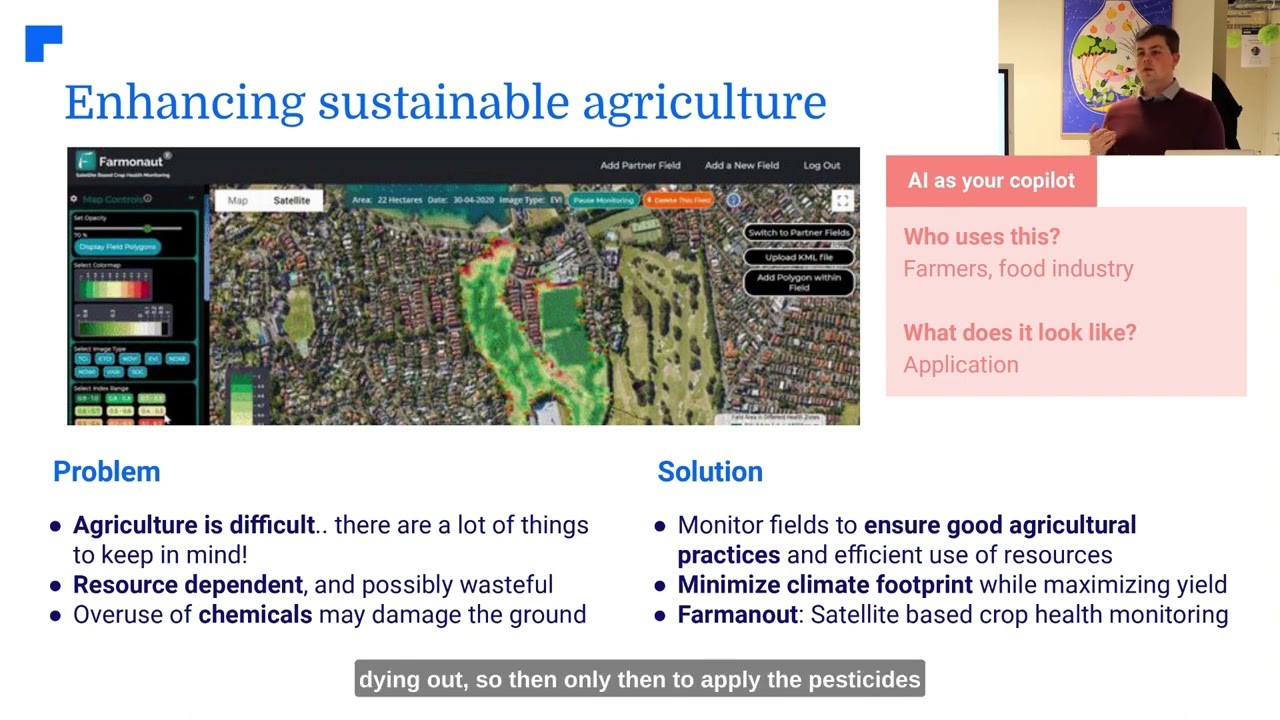
Cotton is the outlier: even the smallest-acreage cotton farms had reached 50% adoption by the 2019 survey wave, likely because cotton pickers already ship with guidance hardware built in. For every other crop, guidance adoption on the smallest farms sits in single digits to low teens. Farmonaut built its precision farming tools around satellite imagery specifically because that route doesn’t require owning guidance-equipped machinery to get field-level data — a smaller operation can access the same crop-health signal a large one gets from an equipped combine. Mechanical accuracy still matters, though: GPS-guided tractors reduce overlap and skipped passes regardless of farm size, which is a mechanical reason guidance and variable-rate adoption tend to climb together in USDA’s data as equipment gets replaced.
The One Method With the Most Yield Data Behind It: Satellite-Guided Variable-Rate Application
If you need one crop-production method with a documented adoption record behind it, satellite-guided variable-rate application is the one USDA’s own survey backs most heavily. It runs in four steps, and none require owning a drone or hiring a data scientist:
- Map the field’s variability. Multispectral satellite imagery, or a yield map from the prior harvest, identifies which zones are underperforming and why — moisture stress, nitrogen deficiency, soil compaction.
- Set a variable-rate prescription. Instead of one blanket rate for the whole field, the applicator’s rate changes zone by zone based on that map.
- Apply with guided machinery. Auto-steer keeps passes from overlapping or skipping — the mechanical link behind USDA’s guidance-adoption figures above.
- Re-map after harvest. Each season’s yield map becomes next season’s variability map, so the prescription sharpens over time instead of staying static.
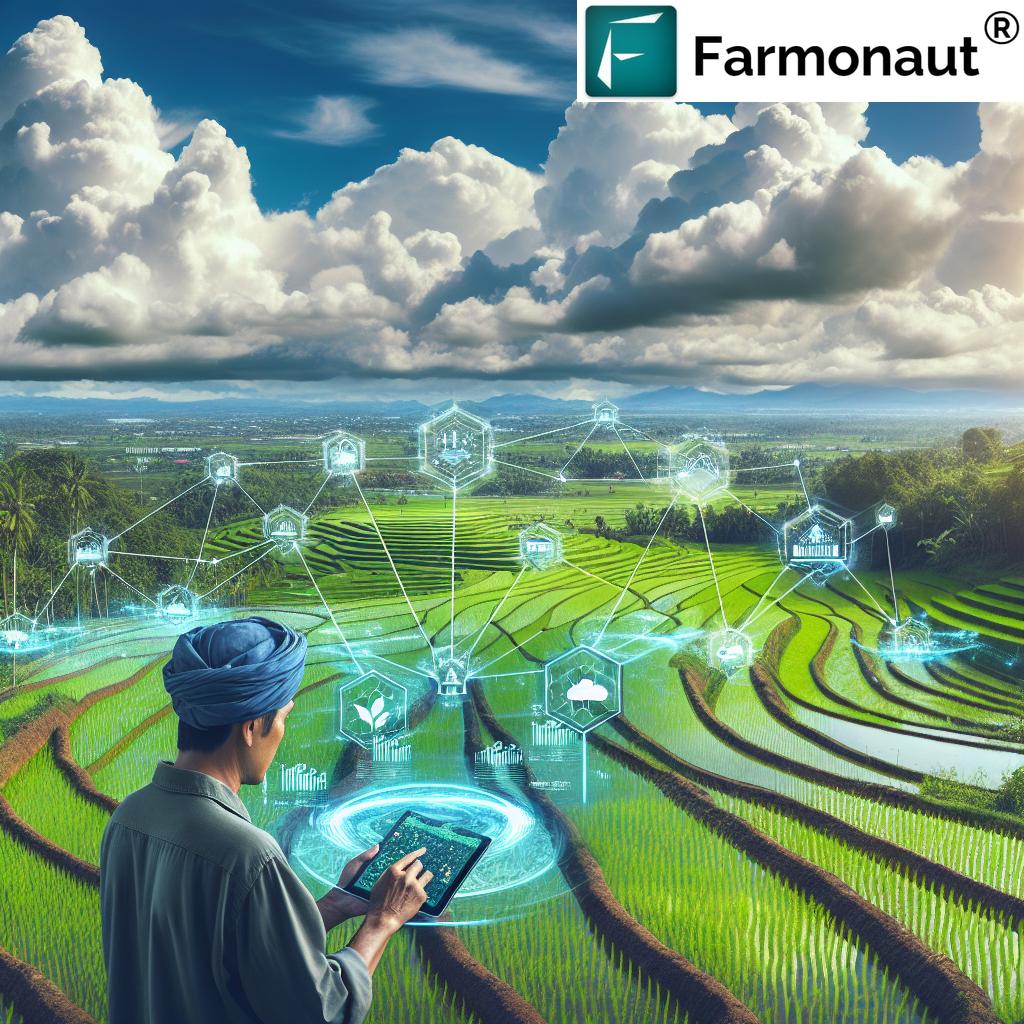
That loop doesn’t expire when any single year’s price or yield figure does — it works the same way whether the satellite layer comes from a public program or a commercial API. Farmonaut runs this loop through its API, and its API Developer Docs let a farm’s existing software pull zone-level imagery and weather data directly instead of re-entering it by hand.

Agriculture Blockchain: What It Actually Does for Traceability
Agriculture blockchain has nothing to do with cryptocurrency speculation, and nothing to do with deciding what to plant. It’s a record-keeping layer — a distributed ledger that’s tamper-evident, tamper-resistant, transparent, and decentralized, used to log who handled a shipment and when (Congressional Research Service, IF11829, published May 12, 2021). The clearest documented result comes from Walmart’s produce pilot: tracing a package of mangoes back to its source farm fell from 7 days to 2.2 seconds once the supply chain moved onto a blockchain ledger, and Walmart required every leafy-green supplier to participate starting in September 2019 (same CRS source). USDA has moved more cautiously: Beefchain, a Wyoming grass-fed-beef traceability system, became the first blockchain solution approved under USDA’s Process Verified Program, and a 2020 proposed rule on organic certification anticipated that digital ledger technology would play what USDA itself called an “essential role” in supply-chain traceability — without mandating a specific system.
Try It: Blockchain Traceability Time-Savings Calculator
Walmart’s mango pilot is one documented ratio, not a universal guarantee — but it’s the only publicly cited before-and-after figure for agricultural blockchain traceability, so it’s the benchmark this calculator scales against.
Run your own numbers
Assumes your operation’s trace-back time would shrink by the same proportion documented in Walmart’s mango pilot (loading-dock-to-shelf tracing, not field-level data). Actual results depend on which ledger platform you adopt and how many supply-chain partners join it. Source: Congressional Research Service, IF11829, May 12, 2021.

Thailand’s Smart Farmer Policy: Requirements, Numbers, and What Changed
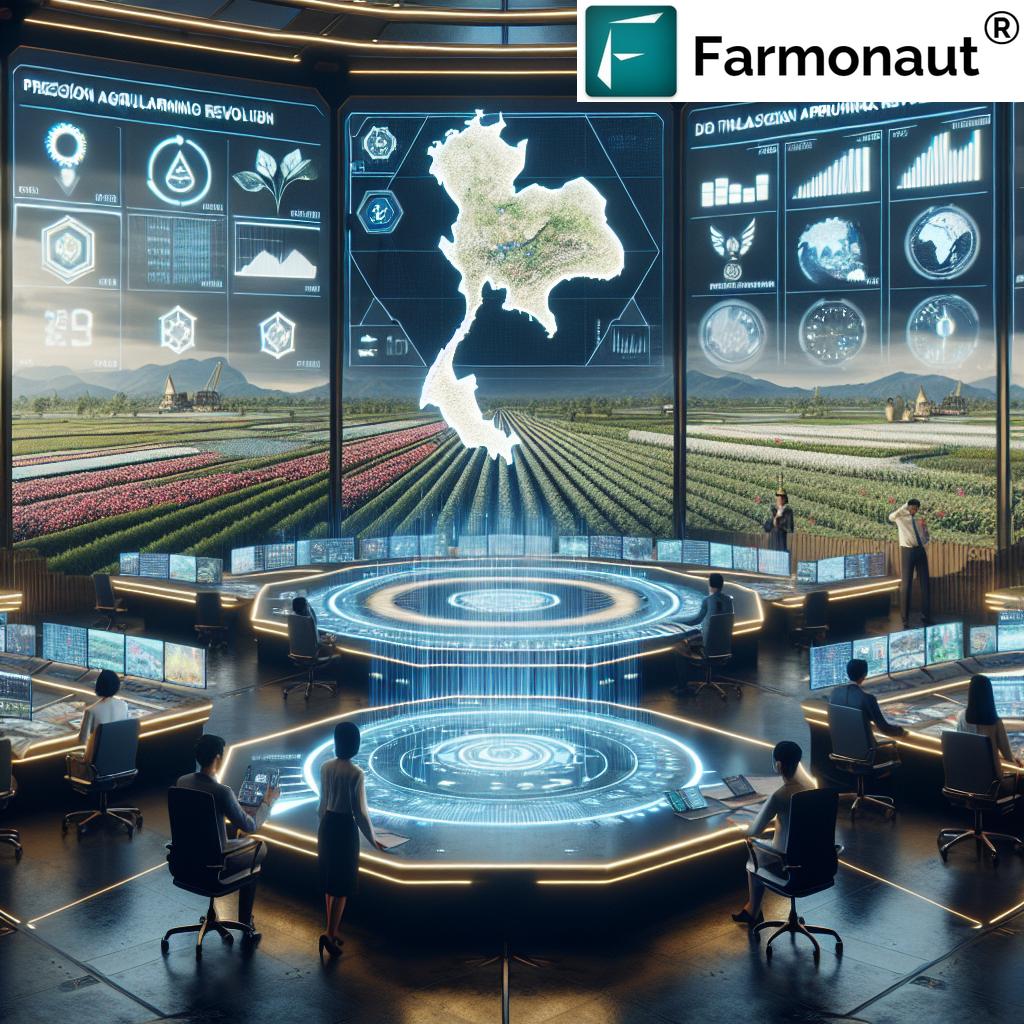
Thailand’s Smart Farmer program is not a slogan — it’s a defined status with income and knowledge criteria set by the Ministry of Agriculture and Cooperatives (MOAC). The original Smart Farmer initiative dates to 2006; MOAC then expanded it into the wider Smart Farmer Development Project, rolled out to 12.6 million farmers starting in 2013 (Food and Fertilizer Technology Center for the Asian and Pacific Region). To qualify, a farming household must earn at least THB 180,000 a year from agriculture — about $5,143 at the exchange rate used in FFTC’s analysis, so check a current THB/USD rate for today’s equivalent — and must also demonstrate agricultural knowledge, data-informed decision-making, market awareness, and environmental responsibility. The rollout wasn’t just paperwork: MOAC built 7,000 Community Rice Centers to extend the training, and by the mid-2010s the program had put 35,000 farmers through Smart Farmer training and registered 3,011,997 livestock-rearing farmers, as of 2015 (same source). Searches for “smart farm Thailand” or “smart farming Thailand” are usually looking for exactly this program rather than any single company’s product — it’s a government status, not a technology category.
Thailand Agriculture and the Agribusiness Market: Scale Without Productivity
Thai agriculture shows an unusual imbalance for an economy this developed. Agriculture, forestry, and fishing contributed 8.7% of Thailand’s GDP in 2024, yet agriculture still employed 30.1% of the country’s total workforce in 2023 (World Bank, Agriculture value added; World Bank, Employment in agriculture). That’s 3.45 times as many workers as the sector’s GDP share would suggest if output and employment were proportional.
For comparison, direct farm production is a far smaller share of the U.S. economy: the output of America’s farms was about 0.8% of U.S. GDP in 2023, though the wider agriculture-and-food sector — processing, retail, food service — reached 5.5% of GDP that same year, and direct U.S. farm employment stood at 1.18 million jobs in 2024, up 10% from 2010 (USDA Economic Research Service). One figure we could not verify from a live, fetchable, authoritative source is a current dollar size for “Thailand’s agribusiness market” as a whole — estimates circulate but move depending on which sub-sectors a given report counts. The defensible way to get that number is to pull it directly from Thailand’s National Statistical Office or the World Bank data portal linked above, both of which republish updated agriculture value-added figures annually. Keeping productivity gains from being cannibalized by soil degradation is also why sustainable land use planning matters here — it’s a large part of the deeper reason Thailand’s employment share hasn’t fallen in step with its GDP share.
The Smart Farming Technology Stack: IoT, Drones, AI Advisory, and What’s Next
The “smart” half of smart digital farming is the sensor-and-automation layer sitting underneath precision agriculture: IoT soil and weather sensors that log conditions continuously instead of at a single sample point, drones for aerial imaging and targeted spraying, and AI advisory systems that turn that data into a specific recommendation rather than a raw feed. None of this is captured well by USDA’s ARMS survey, which tracks equipment ownership rather than sensor networks or leased hardware, so the adoption figures in the earlier section likely understate how much sensing is happening on farms that rent rather than own guidance-equipped machinery. Where this stack goes next is already visible at the margins: urban agriculture operations are adapting the same sensor-and-advisory logic to vertical, indoor growing, where every input is metered because there’s no soil buffer to absorb a bad guess.



Frequently Asked Questions (FAQ)
Q1: What is smart digital farming, exactly?
A1: It’s the combination of whole-operation smart farming tools (IoT sensors, drones, AI advisory, connected machinery) with field-level precision agriculture techniques, unified on one data platform — what industry groups call digital farming.
Q2: What’s the actual difference between smart farming and digital farming?
A2: Smart farming covers the whole operation — livestock, logistics, machinery, labor. Digital farming is smart farming plus precision agriculture plus the networking and platforms that connect a farm’s data end-to-end. Precision agriculture alone stays at the field level.
Q3: What does blockchain actually do in farming, if it doesn’t affect yield?
A3: It records custody — who handled a shipment and when — as a tamper-evident ledger. Walmart’s mango pilot cut trace-back time from 7 days to 2.2 seconds; it didn’t change what was grown or how.
Q4: What is Thailand’s Smart Farmers policy, in one sentence?
A4: A Ministry of Agriculture and Cooperatives program, dating to 2006 and expanded to 12.6 million farmers from 2013, that certifies farming households meeting an income floor of THB 180,000/year plus knowledge and sustainability criteria.
Q5: What is one method of crop production that’s documented to raise yield potential?
A5: Satellite-guided variable-rate input application: map field variability, set a zone-by-zone application rate, apply with auto-steer-guided machinery, then re-map after harvest. It’s the method with the deepest USDA adoption data behind it, and pairing it with farmer education on interpreting the data is what determines whether the extra precision actually gets used.
Discussion
Questions, corrections or field experience? Share them below. First-time comments are reviewed before they appear, and your email is never published.
No comments yet. Be the first to add a question or your experience.

 MapMyCrop
 Cresol
 Atur Kuliner
 MDCV UK
 Zerella Group
 Etech Consulting Madagascar
 Vestlandsforsking
 Agritein
 Delicio
 WB Dev
 Sama Premium
 Prochecker
 Tres Valles
 LACOS Geoinformation
 Magrifly
 LatConnect 60
 Blickwinkel
 Agricultural Credit Policy Council
 Marei Nursery
 eKGIS
eKGIS Mostas Tech
 Exploration consultancy · South Africa · Gold
 Licence holder · Niger · Gold
 Licence holder · Nigeria · Gold + lithium










