

Farm technology · US buyer guide
Farm Software Solutions Ranked by Profit Evidence
A USDA ERS study found GPS mapping, guidance and variable-rate tools raised corn farm operating profit by 1.1% to almost 3%. Here are seven types of farm software ranked by the evidence, with 2025 NASS adoption data, data-ownership checks and a payback calculator.
Key takeaways
- USDA ERS estimated operating profit gains on corn farms of almost 3% for GPS mapping, 2.5% for guidance and 1.1% for variable-rate technology (ERR-217).
- Auto-steer guidance grew from 5.3% of planted corn acres in 2001 to 58% in 2016 (USDA ERS, EIB-248).
- In 2025, 50% of US farms bought inputs online, up from 32% in 2023, while 22% used precision agriculture practices (NASS, August 2025).
- Satellite monitoring, records, online buying and traceability tools are widely used but have no national profit estimate, so test them on your own numbers.
- Read data terms before you sign: the Ag Data Transparent principles say farmers should own data from their operations.
In this article
- Farm software solutions ranked by profit evidence
- How we ranked the seven tool types
- 1. GPS field and yield mapping software
- 2. Auto-steer and guidance software
- 3. Variable-rate prescription software
- 4. Satellite and drone crop monitoring
- 5. Farm records and budgeting software
- 6. Online input buying and grain marketing tools
- 7. Traceability and compliance record tools
- Who uses farm software in the US today
- Does farm software pay on your acres?
- How to choose farm software solutions: a buyer checklist
- Data ownership and contract terms
- Costs beyond the subscription
The farm software solutions with the strongest profit evidence are GPS field and yield mapping, auto-steer guidance and variable-rate prescription tools. A USDA Economic Research Service study of corn farms estimated that GPS mapping raised operating profit by almost 3%, guidance by 2.5% and variable-rate technology by 1.1% (USDA ERS report ERR-217). Satellite monitoring, record-keeping, online buying and traceability tools are widely used, but public studies of their profit effect are thinner.
This guide ranks seven types of farm software by the evidence behind them, not by vendor claims. It shows how many US farms use each kind of tool, what the software costs beyond the subscription, and how to protect your data. A calculator lets you test whether a tool can pay for itself on your own acres before you sign a contract.
Farm software solutions ranked by profit evidence
The table ranks the seven tool types from the strongest to the weakest public evidence of a profit effect on US farms. “Adoption” is the share of planted acres or farms that use the tool, from the USDA source named in each row.
| Tool type | Best for | Profit evidence | Adoption (USDA) |
|---|---|---|---|
| 1. Field and yield maps | Row-crop farms with a yield monitor | Operating profit up almost 3% on corn farms (ERS, 2016) | About 40% of corn and soybean acres (2010-12) |
| 2. Auto-steer guidance | Large acreage, long days in the cab | Operating profit up 2.5%, net returns up 1.5% (ERS, 2016) | 58% of corn acres in 2016 |
| 3. Variable-rate tools | Fields with uneven soils or yields | Operating profit and net returns up 1.1% (ERS, 2016) | 28-34% of corn and soybean acres (2010-12) |
| 4. Satellite and drone | Scouting large or distant fields | No national profit estimate; used with other tools | Used with maps, VRT and guidance on 2-5% of acres (2016-19) |
| 5. Records and budgets | Every farm, lenders, family partners | Time savings reported by users; no national estimate | 68% of farms have a computer (2025) |
| 6. Online buying and sales | Input purchases and grain marketing | Price discovery; no national estimate | 50% buy inputs online (2025) |
| 7. Traceability records | Contracts, audits and buyer programmes | Market access rather than yield | No national adoption figure |
Two points stand out. First, the three tools with measured profit gains all work together: a yield map is made from yield monitor data, and a variable-rate prescription is often drawn from the same maps. Second, the gains are a few percent of operating profit, not a doubling of yield. That is useful on a large farm, but it means the subscription and setup time matter.
Chart
Estimated gain in operating profit on US corn farms
Percent change in operating profit for an average-size corn farm, by precision tool
How we ranked the seven tool types
We sorted the tool types by the type of evidence available. Rank 1 to 3 have estimates from national farm survey data, published by USDA economists. Rank 4 has strong adoption data but no national profit estimate. Ranks 5 to 7 have adoption or usage data and user reports, but no national study of their effect on profit.
The profit figures come from the Agricultural Resource Management Survey (ARMS), run by USDA ERS and the National Agricultural Statistics Service (NASS). The study behind ERR-217 used the 2010 corn survey and 2012 soybean survey. That is older data, but no later national study has replaced it. A newer ERS report, Precision Agriculture in the Digital Era (EIB-248), updates adoption rates up to 2019 but does not re-estimate profit.
Farm use of computers, phones and online services comes from the NASS survey Technology Use (Farm Computer Usage and Ownership), August 2025. We left out vendor claims such as “cut costs by 30%” when no study stood behind them, and we did not rank named brands, because prices and features change each season.
1. GPS field and yield mapping software
Best for: corn, soybean and wheat farms that already run a yield monitor on the combine.
Mapping software turns yield monitor and soil test data into maps that show where a field does well and where it falls short. ERR-217 found GPS mapping had the largest estimated effect of the three tools it studied: operating profit up almost 3% on an average-size corn farm, and net returns, which include overhead, up almost 2%. The same report put yield mapping on about 40% of US corn and soybean acres and GPS soil maps on about 30%.
Maps on their own change nothing. The gain comes when a map changes a decision, such as which zone gets more seed, which drainage tile to fix, or which rented field to give up. EIB-248 notes that corn and winter wheat farmers use yield monitors to track grain moisture, while cotton, soybean and sorghum growers use them to guide chemical input decisions.
- Pros: builds a record of each field over several seasons; feeds variable-rate tools.
- Cons: needs a calibrated yield monitor; one season of data can mislead.
- Check before buying: whether the software reads files from your combine brand without manual conversion.
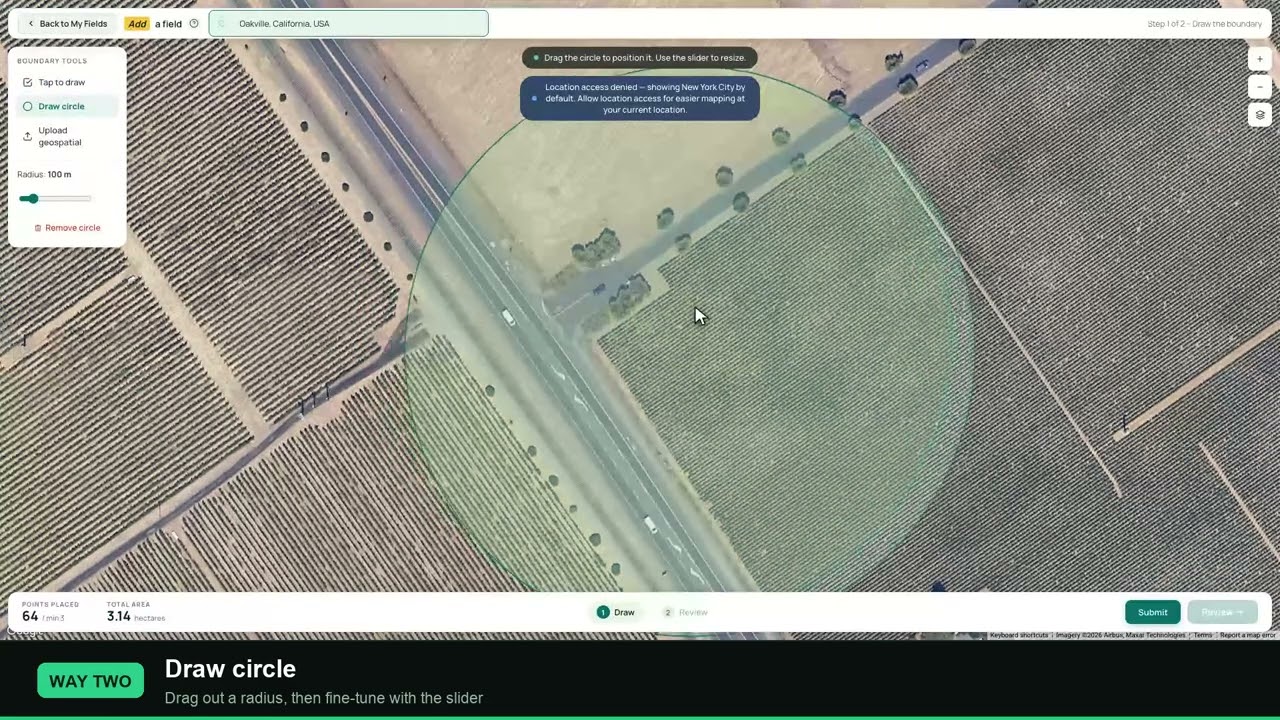
▶ Every map starts with a field boundary: three ways to add a field in the Farmonaut app. · 3:50
2. Auto-steer and guidance software
Best for: farms with many hours of field passes each year, including custom operators.
Chart
Auto-steer guidance use by crop
Percent of planted acres using auto-steer or guidance systems
Guidance is the most widely adopted precision tool in US row crops. Auto-steer was used on 5.3% of planted corn acres in 2001 and 58% in 2016, according to EIB-248. Estimates for 2019 put it on 72.9% of sorghum acres and 64.5% of cotton acres.
ERR-217 estimated that guidance raised operating profit on corn farms by 2.5% and net returns by 1.5%. The savings come from less overlap, less operator fatigue and work that can continue into the evening. The same report found hired labour costs were 60-70% lower on small corn farms using any of the three tools it studied, although larger farms using mapping and guidance spent more on hired labour.
- Pros: clear, measured savings; easy for new operators.
- Cons: correction signal subscriptions add a yearly cost; benefits shrink on small, irregular fields.
- Check before buying: the accuracy level you need (sub-metre or centimetre) and whether the signal covers all your fields.
3. Variable-rate prescription software
Best for: fields with clear differences in soil type, water holding or past yields.
Variable-rate technology (VRT) uses a prescription map to change the rate of seed, fertilizer or lime as the machine crosses the field. ERR-217 found VRT raised both operating profit and net returns on corn farms by about 1.1%, the smallest of the three effects. It put VRT on 28-34% of corn and soybean acres.
The gain depends on how much a field varies. A uniform field gives a prescription little to work with. EIB-248 found that the full set of maps, VRT and guidance was used together on 23% of corn acres, and that the maps-plus-VRT pair on its own was used on about 2% of corn and soybean acres. In other words, farmers rarely use VRT without guidance.
An industry study for the Association of Equipment Manufacturers estimated that current precision adoption has raised fertilizer placement efficiency by 7% and cut herbicide and pesticide use by 9% (AEM summary). These are industry estimates, not field trial results. Check every fertilizer and pesticide rate against the product label, local rules and your agronomist’s advice.
4. Satellite and drone crop monitoring
Best for: farms with many fields, fields far from the yard, or crops where early stress warnings help.
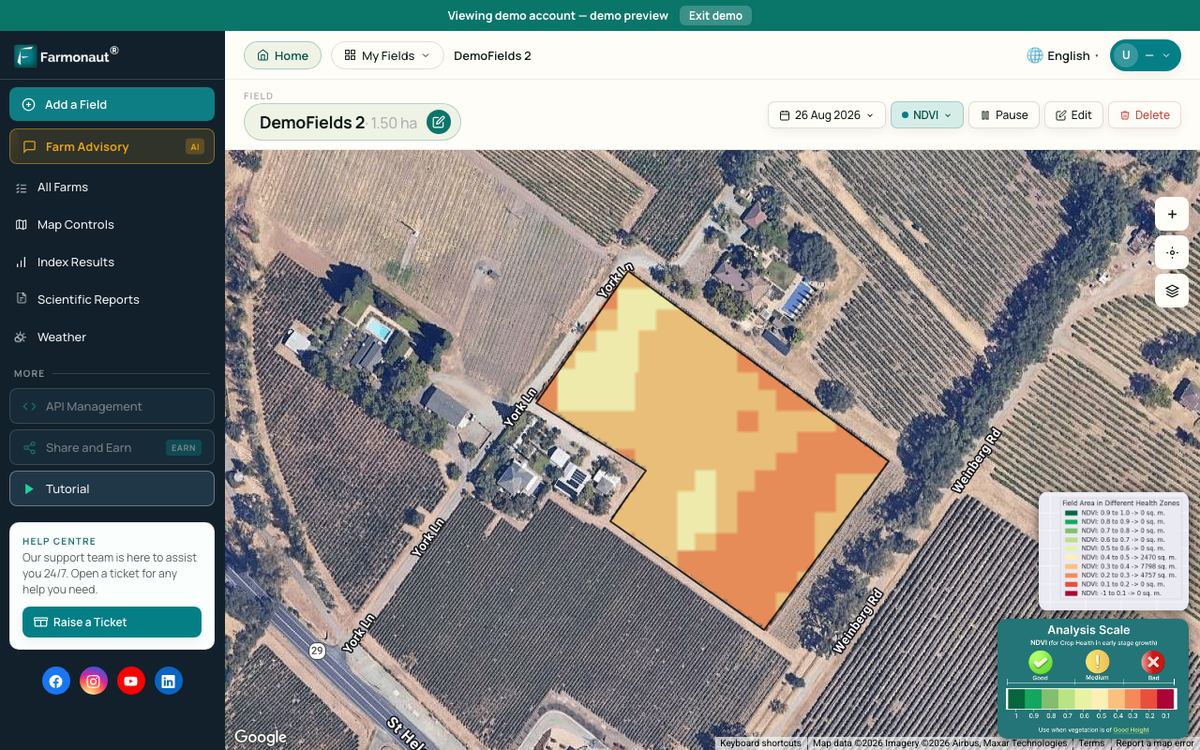
Satellite and drone software shows a vegetation index such as NDVI for each field. Low patches point a scout to the right spot before the problem shows from the road. EIB-248 groups drones, aircraft and satellite imagery as a separate tool. It found that use of all four tool groups together (maps, VRT, guidance and imagery) occurred on 2-5% of national acreage across four major crops in 2016-2019.
No national study has yet measured the profit effect of imagery on its own. The value is mainly scouting time and earlier action. Satellite imagery covers every field on each pass, while drones give finer detail on a single field but need a pilot and flying time. For a walk-through of reading NDVI and acting on a stressed zone, see the video below. Farmonaut is one satellite monitoring option: you draw each field once and get vegetation maps for it through the season.
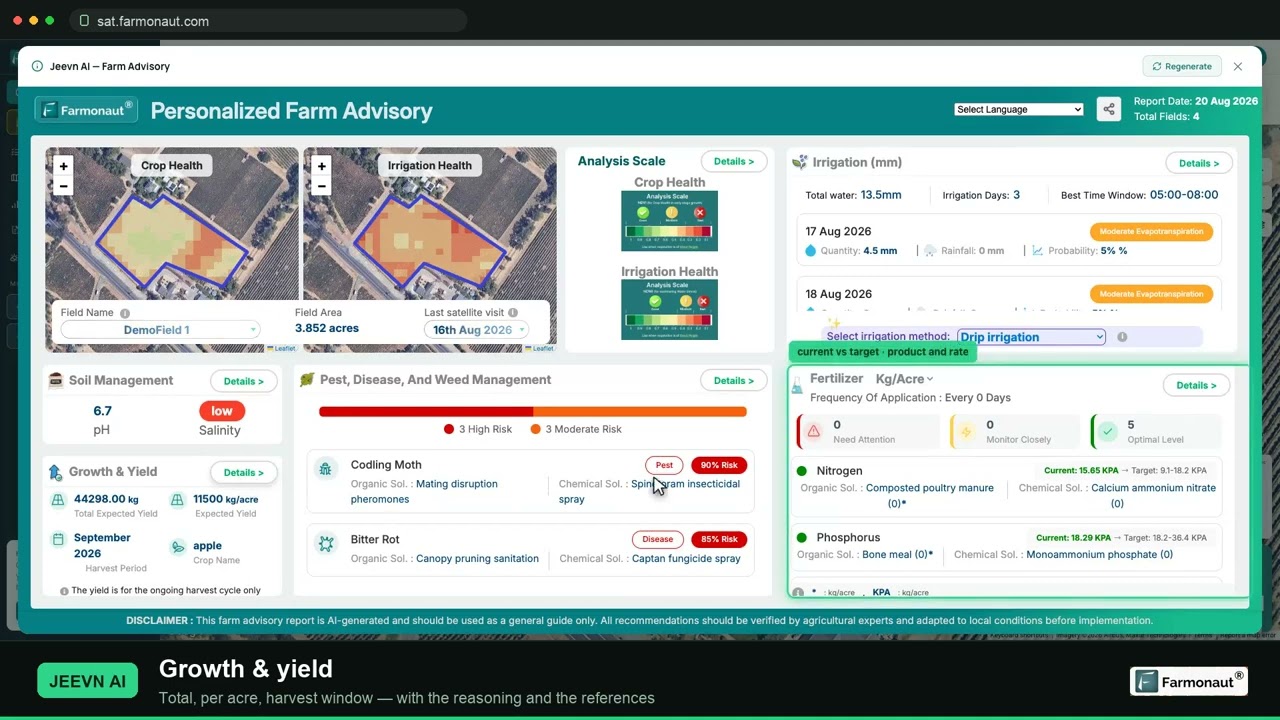
▶ A full walk-through of satellite crop monitoring: reading NDVI and spotting crop stress early. · 19:36
5. Farm records and budgeting software
Best for: every farm that needs clean records for a lender, crop insurance, taxes or a family partner.
Records software tracks inputs, field operations, labour and sales, and turns them into enterprise budgets. NASS reported that 68% of US farms had a desktop or laptop computer in 2025 and 82% had a smartphone. That makes records software usable on most farms, whether it runs in the office or on a phone in the field.
There is no national profit estimate for record-keeping tools. User reports point to time savings instead. The University of Nebraska-Lincoln’s Center for Agricultural Profitability says its online Agricultural Business Calculator had more than 1,100 users and 2,250 enterprise budget records in 2023 (UNL Center for Agricultural Profitability). University budget tools like this one are a low-cost way to start before paying for a commercial platform.
- Pros: one source of truth for each field; faster loan and insurance paperwork.
- Cons: only as good as the data entered; staff must use it every day.
- Check before buying: export to a spreadsheet or your accountant’s software.
6. Online input buying and grain marketing tools
Best for: farms that compare input prices across dealers and sell grain to several buyers.
This is the fastest-growing use of farm software in the NASS survey. In 2025, 50% of US farms used the internet to buy agricultural inputs, up from 32% in 2023. The share that used the internet for marketing activities rose from 23% to 29%. Online tools make it easier to compare dealer quotes and track cash bids and basis.
The benefit is price discovery rather than yield, so its size depends on how far prices differ between your local dealers and buyers. When you compare prices online, note the date of each quote and whether it is a list price, a dealer ask or a delivered price, since these are not the same thing.
7. Traceability and compliance record tools
Best for: farms in contracts or buyer programmes that ask for proof of practices, such as identity-preserved grain, sustainability programmes or food safety audits.
Traceability software links each lot of product to the field, inputs and dates behind it. Its value is access to a market or premium, not a change in yield, so it pays only if a buyer rewards it or requires it. There is no national adoption figure for these tools. Ask the buyer which records format it accepts before you pay for a separate platform, because many farm records tools can already export the same field and input logs.
Compliance records also matter for pesticide and nutrient rules. These vary by state and by country, so check the label, your state or provincial rules and any buyer standard before you rely on a software template.
Who uses farm software in the US today
The NASS survey shows that devices are not the barrier. Most farms have a smartphone and internet access: 85% reported internet access in 2025, and 74% connected through a cellular data plan. The bigger change between 2023 and 2025 was in what farms do online, led by input buying.
Chart
How US farms use technology, 2023 vs 2025
Percent of all US farms
The share of farms that said they used precision agriculture practices fell from 27% in 2023 to 22% in 2025. This question covers all farms, including small livestock and hobby farms, so it is much lower than the share of planted acres under guidance. Adoption rises with farm size: EIB-248 found at least half of larger row-crop farms rely on maps, VRT or guidance, while less than 25% of the smallest farms use any of the four (cotton excepted).
Crop yields set the scale of any per-acre gain. NASS forecast the 2026 US corn yield at 181.2 bushels per acre and soybeans at a record 53.1 bushels per acre, based on conditions on 1 October 2026 (NASS Crop Production, October 2026). A 1% yield gain on 181 bushels is under 2 bushels an acre, which is why the cost side of the decision matters as much as the benefit.
Does farm software pay on your acres?
Use the calculator to test a tool before you buy it. Enter your acres, your operating profit per acre, the profit gain you expect and the yearly cost, including your own time. The ERS estimates above (1.1% to almost 3% of operating profit) are a sensible range for the expected gain on row-crop farms. The default values are examples set close to break-even, not a forecast for your farm.
If the result is negative, the tool may still be worth it for other reasons, such as easier loan paperwork or a buyer requirement. But you then know you are paying for convenience or market access, not for higher profit.
Try the numbers for your own farm below.
Calculator
Will this farm software pay for itself?
Enter your acres, profit per acre and the full yearly cost of the tool.
- Extra operating profit: $2,500 US$
- Total yearly cost incl. your time: $2,000 US$
- Break-even gain needed: 2.0 %
Example values only, set close to break-even; they are not a benchmark or a forecast. Operating profit per acre is an example, use your own budget figure. The expected gain is your estimate; USDA ERS estimated 1.1% to almost 3% of operating profit on corn farms for VRT, guidance and GPS mapping (ERR-217). Count all costs: subscription, hardware, correction signals and training. This is not financial or tax advice.
How to choose farm software solutions: a buyer checklist
Use these steps to compare platforms side by side. They apply whether you are looking at a full farm management platform or a single-purpose app.
- Name the decision. Write down the one decision the software must improve, such as nitrogen rate, scouting route or grain sale timing. If a vendor cannot show how its tool changes that decision, move on.
- Check your data. List the data you already have: yield monitor files, soil tests, field boundaries and as-applied records. Software that cannot read those files will cost you hours of re-entry.
- Ask for a trial on your own fields. A demo on a sample farm proves little. Ask to load one season of your data.
- Price the full cost. Add the subscription, any hardware, correction signals, training and the hours you or your staff will spend each week.
- Read the data terms. Find out who owns the data, who it is shared with and how you can take it out if you leave (see the next section).
- Check support in season. Ask how fast the vendor or dealer answers during planting and harvest, when a problem costs the most.
- Plan the review. Set a date after harvest to compare results with the year before, field by field.
For a short guide to getting started without buying new machines, see the video below.

▶ Six plain steps to start precision farming without buying a robot. · 4:18
Data ownership and contract terms
Farm data has value to the vendor as well as to you, so read the terms before you upload a field. The Ag Data Transparent core principles, first drawn up in 2014 with the American Farm Bureau Federation and updated in 2024, start from the view that farmers should own information that originates from their farming operations (Ag Data Transparent core principles). They also ask providers to use simple contracts in plain language.
Vendor terms vary. For example, the Climate FieldView terms of service say the company may share your data with the maker of third-party equipment when you raise a support request about that equipment, unless you tell customer support you do not want this (Climate FieldView terms of service). Clauses like this are not unusual, but you should know them before you sign.
- Can you export all your raw data in a standard format at any time?
- Is your data deleted when you cancel, and how quickly?
- Is anonymised data sold or shared, and can you opt out?
- Does the contract follow the Ag Data Transparent principles or carry its certification?
Costs beyond the subscription
Two costs are easy to miss. The first is service. A farmdoc daily article from the University of Illinois notes that equipment dealerships remain the main providers of precision technology and that a shortage of qualified service technicians can mean longer waits during planting or harvest. Where technicians are most common, there are roughly 3 to 7 per 100 farms (farmdoc daily, January 2026).
The second is tax treatment. In the US, off-the-shelf software that meets IRS tests can be depreciated straight-line over 36 months and may qualify for the section 179 deduction (IRS Publication 946). A subscription is usually handled differently from a purchase. Rules differ in Canada, the UK, Europe and Australia, so ask your accountant or tax adviser how a given contract should be treated before you sign.
How we checked the numbers
Every figure on this page comes from a named public source, listed below with its date. Profit effects come from USDA ERS report ERR-217, which used ARMS survey data for corn (2010) and soybeans (2012). Adoption by acreage comes from USDA ERS report EIB-248, which uses ARMS crop surveys from 1996 to 2019. Farm use of devices and online services comes from the NASS Technology Use survey of August 2025, and crop yields come from the NASS Crop Production report of October 2026.
Industry estimates, such as the AEM study, are labelled as such and are not mixed with survey results. We do not rank named brands, because features and prices change each season and differ by country.
FAQ
What are farm software solutions?
They are digital tools that help plan, run and record a farm. The main types are field and yield mapping, auto-steer guidance, variable-rate prescriptions, satellite and drone monitoring, records and budgeting, online buying and marketing, and traceability records.
Which farm software has the best evidence of higher profit?
GPS mapping, guidance and variable-rate technology. A USDA ERS study of corn farms estimated operating profit gains of almost 3%, 2.5% and 1.1% for these three tools.
How many US farms use precision agriculture?
NASS found that 22% of US farms used precision agriculture practices in 2025, down from 27% in 2023. Measured by planted acres, use is much higher: auto-steer covered 58% of corn acres in 2016.
Is farm management software worth it for a small farm?
It can be, but the gain per acre is small, so the cost must be low too. Start with a records and budgeting tool, such as a university budget calculator, and test any paid tool with the calculator on this page.
Who owns the data I put into farm software?
It depends on the contract. The Ag Data Transparent principles say farmers should own data from their operations, but each vendor sets its own terms. Check export, deletion and sharing clauses before you sign.
Related pages on our site: satellite mineral detection, mineral survey request form, contact us.
Farmonaut crop monitoring
See your own fields from space
Draw your fields once and Farmonaut shows satellite vegetation maps for them through the season, on web, Android or iOS.


Sources
- USDA ERS, The Profit Potential of Precision Agriculture Technologies (ERR-217), 2016: ers.usda.gov
- USDA ERS, Precision Agriculture in the Digital Era: Recent Adoption on U.S. Farms (EIB-248), 2023: ers.usda.gov
- USDA NASS, Technology Use (Farm Computer Usage and Ownership), August 2025: esmis.nal.usda.gov
- USDA NASS, Crop Production, October 2026: release.nass.usda.gov
- AEM, The Environmental Benefits of Precision Agriculture Quantified (industry study summary): aem.org
- University of Nebraska-Lincoln Center for Agricultural Profitability, Technology use growing on Nebraska farms and ranches, August 2023: cap.unl.edu
- Ag Data Transparent, Core Principles (updated 2024): agdatatransparent.com
- Climate FieldView, Terms of Service: climate.com
- Kalva and Janzen, The People Behind the Machines, farmdoc daily, University of Illinois, January 2026: farmdocdaily.illinois.edu
- IRS, Publication 946 (2025), How To Depreciate Property: irs.gov
Discussion
Questions, corrections or field experience? Share them below. First-time comments are reviewed before they appear, and your email is never published.
No comments yet. Be the first to add a question or your experience.

 Gen Chayat
 Chimera Innovation
 Hiteshi Infotech
 Clubhouse OS
 SkyHarvest
 Polaris Digitech
 Teledarbas
 Wild Oak Farm
 SFX
 BACF Africa
 Doodlakine
 Exurbia Geospatial
 FieldZero
 Indico Company

 Licence holder · Niger · Gold
 Client · Tanzania · Gold










