

Are Trees Producers or Consumers? USDA Data Explained
Reviewed August 2026 against the USDA Forest Service, the EPA Greenhouse Gas Inventory, and USDA’s National Agricultural Statistics Service.
The Short Answer: Are Trees Producers or Consumers?
Trees are producers. In ecological terms, a tree is an autotroph: it builds its own food from sunlight, water, and carbon dioxide through photosynthesis — the textbook definition of a producer in any food web. Trees also draw water and mineral nutrients from soil and use a small amount of oxygen for respiration, functions that look “consumer-like,” but that role is secondary to their production of biomass and oxygen. So when the question is a tree a producer or a consumer comes up, the scientifically correct classification is producer, with a minor, well-documented consumer function layered on top.
This isn’t just a classroom distinction. The U.S. Environmental Protection Agency’s Greenhouse Gas Inventory shows forestland is one of the few land uses in the country that removes more carbon dioxide than it emits, and that fact underpins federal climate accounting, state forestry tax incentives, and agroforestry cost-share programs. The chart below shows how forestland’s net carbon role compares with cropland’s, using the 2018 EPA land-use accounting cited by USDA and industry analysts.
Keep reading for the biochemistry, the USDA and EPA numbers behind it, how trees function as consumers within a working farm, and a calculator to estimate your own land’s carbon balance.



Producer vs. Consumer: The Definitions That Settle It
- Producer definition: an organism that manufactures its own food from inorganic inputs — sunlight, water, carbon dioxide — through photosynthesis, generating the organic matter that feeds the rest of the food web.
- Consumer definition: an organism that gets energy by taking in organic matter or resources already produced by something else — water, minerals, or other organisms.
- Jump to the calculator
By that test, is a tree a consumer or a producer stops being ambiguous once you separate two different things: what a tree does with sunlight (produces) and what a tree does with soil (consumes, in small amounts, to support production). Three checks classify any specific tree on any specific day:
- Is it photosynthesizing in daylight? Building sugars from CO2 and water is the producer function, active in every chlorophyll-bearing leaf during daylight hours.
- Is it drawing water or dissolved nutrients from the soil through its roots? That’s the consumer function, running continuously alongside photosynthesis.
- Is it respiring in the dark? At night, a tree takes in oxygen and releases CO2 to drive cellular respiration — chemistry identical to how animals respire, just small relative to the tree’s own stored biomass.
Run those three checks on any tree and the producer role dominates by volume and by ecological consequence, which is why are trees consumers or producers resolves, in every standard biology and forestry reference, to “producers, with a consumer function.”

Carbon farming and soil health both hinge on the producer role trees and cover crops play in a working system.
Trees as Producers: What Photosynthesis Actually Does
How Trees Produce
- Photosynthesis: chlorophyll in leaves converts sunlight, water, and carbon dioxide into glucose and oxygen.
- Organic matter creation: that glucose becomes wood, leaves, roots, and root exudates, building the biomass and soil organic matter that support the rest of the ecosystem.
- Oxygen generation: oxygen release is the by-product of photosynthesis that supports every other aerobic organism sharing the same air.

Core Contributions of Trees as Producers
- Foundational layer: trees anchor most terrestrial food webs, from soil fungi to grazing animals to timber and nut buyers.
- Carbon sequestration, by the numbers: U.S. forestland was a net carbon sink of about 754 million metric tons of CO2-equivalent in 2018, according to the American Farm Bureau Federation’s analysis of that year’s EPA Greenhouse Gas Inventory. On a per-acre basis, that works out to roughly 105 metric tons of CO2 removed per 100 acres of forestland annually (1.05 metric tons per acre) — compared with 9.7 metric tons of net CO2 emitted per 100 acres of cropland in the same accounting year.
- National offset: land use and forestry sequestered 764 million metric tons of CO2 nationwide in 2018, cutting net U.S. greenhouse gas emissions from 6.7 billion to 5.7 billion metric tons, close to 12% of that year’s gross emissions. By 2022, the EPA’s Greenhouse Gas Inventory put the land sector’s net offset at 13% of total U.S. emissions — though the agency also reports that total land-sector sequestration capacity fell 11% between 1990 and 2022 as forest carbon accumulation slowed and land was converted to urban use. Check the EPA inventory link directly for the next annual update; it is republished on a yearly cycle.
- Oxygen output: urban forests across the coterminous United States produce an estimated 61 million metric tons (67 million tons) of oxygen a year, enough to match the annual oxygen consumption of about two-thirds of the U.S. population, per USDA Forest Service research (Nowak et al., 2007). That figure is nearly two decades old and has not been re-run nationally at the same scale, so treat it as an order-of-magnitude baseline; the USDA Forest Service’s urban tree canopy datasets are the place to check for a city-specific update, and the study’s own authors note that atmospheric oxygen is so abundant globally that local production has little practical effect on air supply.
- Sustainable land use: in agroforestry, integrating trees with crops and livestock leverages the producer role — shade, wind protection, and nitrogen from certain species — to build a farm with more than one output.
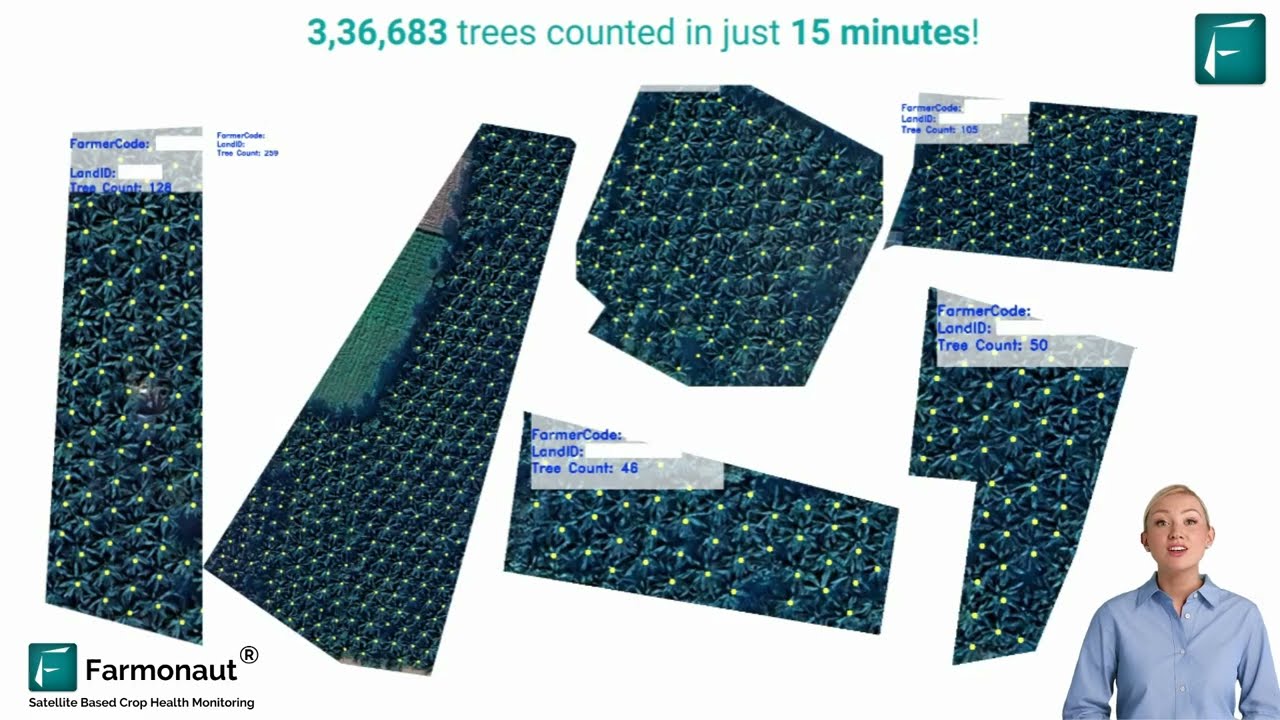
Satellite and AI tree detection — the kind we build at Farmonaut — lets landowners count and map producer-role tree cover at a scale field surveys can’t match.
Sustainable management of trees as producers is central to carbon footprinting programs and to healthy agricultural landscapes generally reliant on the same forest cover.
Trees as Consumers: Water, Nutrients, and Respiration
How Trees Consume
- Water uptake: roots draw water from soil, competing with neighboring plants and crops for the same moisture.
- Nutrient absorption: trees take up nitrogen, phosphorus, potassium, and trace minerals to support growth and metabolic function.
- Respiration: without sunlight, trees consume oxygen and release carbon dioxide to drive cellular respiration — the same basic chemistry as animal respiration, just small relative to the tree’s own mass.
- Solar energy consumption: trees capture sunlight the way a solar panel captures light — as an energy input they convert rather than store as-is.

Why the Consumer Role Matters on a Working Farm
- Competition: in alley-cropping and windbreak systems, trees and companion crops draw on the same soil moisture and nutrient pool. USDA’s Sustainable Agriculture Research and Education (SARE) program notes that alley-cropping layouts only lower economic risk when tree spacing is matched to both the tree’s and the crop’s light, water, and nutrient requirements — mismatched spacing is what turns a tree’s ordinary consumer role into a yield problem for the crop next to it.
- Nutrient cycling: trees give some of what they take back, returning nutrients to soil through leaf litter and root turnover.
- Resource allocation over time: in SARE-documented alley-cropping systems, annual row crops — hay, wheat, soybeans, corn, and vegetables — provide yearly income while young nut or timber trees mature, with most nut-tree species reaching commercial production 5 to 10 years after planting. That timeline is what growers plan tree spacing and irrigation capacity around, not a guess.
- Environmental inputs: like every organism, a tree’s growth is capped by whichever input — water, a specific nutrient, or light — is scarcest on that site, so consumer-side monitoring (soil moisture probes, tissue nutrient tests) is how growers keep the producer function healthy.
Ecosystem Dynamics: Producer and Consumer Roles Together
- Supporting food webs: as producers, trees feed herbivores, decomposers, and soil microbial communities.
- Carbon balance: the same 1.05 metric tons of CO2 per acre that forestland removes annually is partly offset by the CO2 trees themselves release through respiration and by biomass that eventually decomposes — which is why national accounting reports a net figure, not a gross one.
- Soil health: root systems, leaf litter, and root exudates build the organic layers that feed nutrient cycling below ground.
- Water dynamics: trees draw meaningful volumes of water from the soil profile, shaping retention and availability for whatever is planted near them.

Producer and Consumer Roles Across Landscapes
- Terrestrial forests: the base structural layer supporting insects, mammals, fungi, and birds.
- Agricultural intercropping: in agroforestry, trees interwoven with crops produce shade and, for some species, nitrogen, while consuming soil moisture and nutrients from the same rooting zone. Adoption of these systems is measurable: USDA’s National Agricultural Statistics Service counted 32,717 U.S. farm operations reporting at least one agroforestry practice in the 2022 Census of Agriculture, up 6% from 30,853 operations in 2017, per a USDA Forest Service analysis of that census data.
- Urban landscapes: city trees regulate microclimates, intercept stormwater runoff, and produce the oxygen volumes cited above, while consuming urban runoff nutrients as part of stormwater management.
Forestry, Agriculture & Land Use: Managing Both Roles
Where agroforestry takes hold isn’t uniform across the country. In the 2022 Census of Agriculture, Vermont led the nation with 7.8% of all farms reporting an agroforestry practice, followed by Maine at 6.0% and New Hampshire at 5.6%; Arizona (0.3%), Utah, and North Dakota (0.4% each) reported the least, reflecting how climate, farm size, and regional extension programs shape adoption. The next Census of Agriculture is conducted by USDA/NASS on a five-year cycle, with the following round due in 2027 — check the agency’s Census of Agriculture publications for the refreshed state-by-state count.
Strategies for Optimizing the Role of Trees
- Precision agroforestry: satellite and AI-based tools help place trees and select species to raise productivity while limiting resource competition.
- Nutrient management: nitrogen-fixing tree species and mycorrhizal inoculation replenish soil fertility even as trees consume nutrients for their own growth.
- Soil health conservation: maintaining organic matter and root structure protects against erosion and supports long-term productivity.
- Water balance: monitoring tree water consumption in mixed crop-forest landscapes keeps systems resilient through dry spells.
- Diversified production: tree-based output — biomass, timber, nuts, or fruit — adds an income stream alongside row crops.
For large-scale land owners and agri-businesses, our Large Scale Farm & Forest Management platform offers remote monitoring and resource-management tools to weigh both the producer and consumer sides of a mixed landscape.

Calculator: Your Land’s Carbon Balance
Using the same 2018 EPA/American Farm Bureau Federation per-acre rates cited above, estimate whether your own mix of forestland and cropland is a net carbon sink or source.
Assumptions: uses national average net-flux rates from the 2018 EPA Greenhouse Gas Inventory as summarized by the American Farm Bureau Federation — 1.05 metric tons CO2 removed per acre of forestland per year, and 0.097 metric tons net CO2 emitted per acre of cropland per year. It excludes soil type, forest age, species mix, tillage practice, and regional differences, all of which shift the real number on any given property; USDA Forest Service FIA data is the source for a site-specific rate.
Monitoring Tree and Crop Roles with Farmonaut
As a satellite technology company, we at Farmonaut build tools that make monitoring the producer and consumer sides of land management accessible for farms, forests, and agri-businesses of any size.
- Real-Time Monitoring: multi-spectral satellite imagery tracks tree biomass, nutrient dynamics, water stress, and overall canopy health.
- Blockchain Traceability: our Traceability Solutions track timber, non-timber, and agricultural products through the supply chain.
- AI Advisory: the Jeevn AI system delivers resource-optimization guidance to help balance tree production and consumption for better yields.
- Fleet Management: our fleet management tools reduce logistics costs for businesses managing large areas of forest and farmland.
- API Access: integrate carbon tracking and forest health analytics into your own systems using the Farmonaut API (API documentation).

For sustainable plantation initiatives, our Crop, Plantation, & Forest Advisory helps select, monitor, and optimize tree and crop combinations for both ecosystem services and yield.

Producer vs. Consumer: Comparison Table
| Role | What It Does | Documented U.S. Figure | Source & Vintage | Practical Implication |
|---|---|---|---|---|
| Producer | Photosynthesis creates organic matter and releases oxygen | Forestland net sink of ~1.05 metric tons CO2/acre/year; urban forests produce ~61 million metric tons O2/year nationally | American Farm Bureau/EPA GHG Inventory, 2018; USDA Forest Service (Nowak et al.), 2007 | Anchors carbon-offset accounting and urban forestry planning |
| Consumer | Absorbs water and soil nutrients; respires oxygen and releases CO2 | Cropland net emission of ~0.097 metric tons CO2/acre/year (comparison benchmark, same accounting) | American Farm Bureau/EPA GHG Inventory, 2018 | Drives spacing and irrigation planning in agroforestry to limit crop competition |
| Both, in agroforestry | Trees produce shade/nitrogen while consuming shared soil moisture | 32,717 U.S. farms reported agroforestry practices in 2022, up from 30,853 in 2017 (+6%) | USDA Forest Service analysis of USDA/NASS Census of Agriculture, published 2025 | Guides where and how tree-crop systems are being adopted nationally |
Water consumption per tree and per-species carbon rates are not summarized in a single national figure; the USDA Forest Service's FIA program and university extension transpiration calculators are the correct source for a species- and site-specific number rather than a national average.
FAQs: Are Trees Consumers or Producers?
Q1. Is a tree a producer or a consumer?
A: A tree is classified as a producer because it makes its own food through photosynthesis. It also performs a consumer function — absorbing water and nutrients, and respiring oxygen — but that is secondary to its role as a producer in any food-web diagram.
Q2. Are trees consumers?
A: Trees behave like consumers only in specific, minor respects: taking up water and soil nutrients through roots, and consuming oxygen during night-time respiration. These functions don't override the primary producer classification, which is based on photosynthesis.
Q3. Is a tree a consumer or a producer, definitively?
A: Producer, definitively, in every standard ecology and forestry reference. The consumer-like functions (water and nutrient uptake, respiration) support the tree's growth but do not classify it as a consumer in food-web terms, which is reserved for organisms that cannot make their own food.
Q4. How much carbon do U.S. forests actually remove, and where can I check a newer number?
A: U.S. forestland was a net sink of about 754 million metric tons of CO2-equivalent in 2018 (American Farm Bureau Federation analysis of the EPA GHG Inventory), and by 2022 the land sector as a whole offset 13% of total U.S. greenhouse gas emissions per the EPA's own inventory. The EPA republishes this inventory annually — check the EPA's LULUCF page directly for the current year's figure.
Q5. Do trees compete with crops for water and nutrients?
A: Yes. Tree roots draw from the same soil layers as crops, and USDA's SARE program documents that alley-cropping systems only avoid yield loss when tree and crop spacing is matched to both species' light, water, and nutrient needs. Poorly spaced trees can reduce the yield of the crop planted next to them.
Q6. What produces more oxygen — a single tree, or an acre of cropland?
A: There's no single national figure comparing the two directly, but the USDA Forest Service's 2007 research found urban forests across the coterminous U.S. produce roughly 61 million metric tons of oxygen a year, enough to match about two-thirds of the country's population-level oxygen consumption — a scale effect from tree canopy cover, not from any one tree.
Conclusion: The Dual Role, Summarized
Are trees consumers or producers? The evidence points one way: trees are producers, first and foremost, because photosynthesis is how they build the organic matter and oxygen the rest of the ecosystem depends on. The consumer side — water uptake, nutrient absorption, night-time respiration — is real, documented, and worth managing in any agroforestry or land-use plan, but it does not change the classification.
The USDA and EPA data above give that answer a number: forestland removed carbon at roughly 1.05 metric tons of CO2 per acre per year against cropland's 0.097-metric-ton net emission in the 2018 accounting cycle, and 32,717 U.S. farms had adopted agroforestry practices by the 2022 Census of Agriculture. Both figures will be updated on their normal federal cycles — annually for the EPA inventory, every five years for the Census of Agriculture — so use the calculator above with your own acreage and check those sources directly when you need the freshest number.
With satellite monitoring and AI-driven advisory tools — the kind we build at Farmonaut — landowners can track both sides of that balance on their own land rather than relying on a national average.
Discussion
Questions, corrections or field experience? Share them below. First-time comments are reviewed before they appear, and your email is never published.
No comments yet. Be the first to add a question or your experience.

 Crossprod
 Aamoksh One Eighty
 Patrick America
 Liquify Digital
 CU Foods
 BeyondTech Global
 Rouge VC
 AgroGreen Dynamics
 AgroRisk
 Oath Inc
 Reddane Farming
 Esri North East Africa
 Cresol
 MDCV UK
 Zerella Group
 Etech Consulting Madagascar
 Vestlandsforsking
 Delicio
 WB Dev
 Sama Premium
 Exploration consultancy · South Africa · Gold
 Licence holder · Niger · Gold










