

Reviewed September 2026 against farmdoc daily (University of Illinois), Defra Farm Accounts for England, and Statistics Canada Census of Agriculture.
Try it: Run your own numbers →
Replacing a tractor, combine, or sprayer now costs meaningfully more than it did three years ago: US machinery costs rose 25% from 2021 to 2024, and a 310 HP tractor’s US list price hit $623,657 in 2025 — up 7.5% year-on-year, according to farmdoc daily at the University of Illinois. In England, cereal farms carried £78,700 a year in machinery, fuel, running costs and depreciation in 2024/25, per Defra’s Farm Accounts. This article covers when to replace, how to finance the gap, what maintenance actually costs, and where track systems fit into that decision — with the real numbers behind each call.
Table of Contents
- The Cost Baseline: What Machinery Ownership Runs Today
- Farm Machinery Replacements: When the Math Says Go
- Financing Your Farm Machinery: What’s Actually Available
- Repair and Maintenance: Budgeting for Uptime
- Track Systems: Where They Fit (and Where They Don’t)
- Dealer Networks and Named Suppliers
- Automation and Modular Retrofits Changing the Replacement Calculus
- Leasing, Pay-Per-Use and Certified Pre-Owned Marketplaces
- Workforce Shift: From Manual Tasks to Fleet Supervision
- Lifecycle Management and Traceability
- Replacement Timing Calculator
- Farmonaut Technology Insight
- Frequently Asked Questions
- Conclusion
The Cost Baseline: What Machinery Ownership Runs Today
Before deciding whether to replace, finance, or repair a machine, it helps to know what ownership actually costs where you farm. The figures below are the clearest public baselines available for the United States, United Kingdom, Australia and Canada as of September 2026.
In the United States, the University of Arkansas Cooperative Extension Service and farmdoc daily put average machinery ownership and operating costs at $171 per acre in 2024. Operating a 310 PTO HP tractor specifically runs $255.80 per hour in 2025 figures, covering fuel, lubrication, repairs and labor. These are annual updates — farmdoc daily republishes its machinery cost estimates every September, so the 2025 figures cited here will be superseded by a 2026 release; check farmdoc daily’s machinery cost estimates directly for the current year’s numbers.
In England, Defra’s Farm Accounts for England (2024/25) show two useful benchmarks: cereal farms carried £78,700 a year in machinery, fuel, running costs and depreciation, while general cropping farms — which run heavier tillage and harvesting fleets — carried £99,100. On cereal farms, machinery costs represent 18% of total farm output, a ratio Defra and AHDB use as a rough affordability check: if your machinery line exceeds that share of output, it’s worth reviewing your fleet size against your acreage.
Combine harvester pricing in the UK sits between £350,000 and £550,000 for a new 200–250 hp machine as of 2026, according to AHDB guidance summarized by British Farmers. That range alone explains why leasing and certified pre-owned routes (covered below) get so much attention from mid-size arable operations.
Australia’s farm equipment market is forecast to grow at a 2.6% compound annual growth rate from 2024 to 2031, per Markets and Markets’ Australia farm equipment market report. That’s a market-size trend, not a cost-per-hectare figure — ABARES does not currently publish granular per-hectare machinery investment data in its public releases, so Australian growers benchmarking their own spend should track their own cost-per-hectare against their agronomist or accountant’s regional averages rather than a national figure that doesn’t yet exist publicly.
Canada’s picture comes from the Census of Agriculture, run by Statistics Canada every five years. The 2021 Census is the current authoritative source for the value of farm machinery and equipment by farm size and geography. The next Census is scheduled for 2026, with data expected to release around May 2027 — mark that date if you’re benchmarking a Canadian operation, since the 2021 figures will otherwise be five to six years stale by the time you read this. Check Statistics Canada’s Census of Agriculture machinery value table for whichever vintage is current when you look.
| Market | Key Machinery Cost Figure | Period | Source |
|---|---|---|---|
| United States | $171/acre ownership + operating cost; $255.80/hr for 310 PTO HP tractor | 2024–2025 | farmdoc daily, University of Illinois |
| United Kingdom (cereal farms) | £78,700/year machinery, fuel, running costs, depreciation (18% of output) | 2024/25 | Defra Farm Accounts for England |
| United Kingdom (general cropping) | £99,100/year machinery, fuel, running costs, depreciation | 2024/25 | Defra Farm Accounts for England |
| Australia | 2.6% CAGR, farm equipment market, 2024–2031 | 2024–2031 forecast | Markets and Markets |
| Canada | Machinery/equipment value by farm size (5-year census) | 2021 (next: 2026, released ~May 2027) | Statistics Canada Census of Agriculture |

Farm Machinery Replacements: When the Math Says Go
Replacement timing is a maintenance-manual task most operators handle on gut feel — but AHDB’s UK guidance gives a defensible starting point: tractors in heavy use (6,000–8,000 hours) should be replaced on a 7–10 year cycle, and owned combines (1,500–2,500 hours) on a 6–9 year cycle. Those ranges exist because repair frequency and downtime risk climb sharply once a machine passes its design service life, not because of an arbitrary age cutoff.
The pain point most operators actually describe is a maintenance manual task list that grows every season: more diagnostic codes, more parts on backorder, more hours spent chasing a fault instead of running the machine. That’s the practical trigger for a replacement decision — not the calendar, but the trendline in your own repair log. If your repair bill for a single machine is climbing year over year and now approaches what a lease payment or loan installment on a newer unit would cost, that’s the signal AHDB’s replacement-cycle guidance is trying to formalize.
Three inputs matter for a replacement decision on any machine, in any of these four markets:
- Hours logged against the recommended cycle — 6,000–8,000 hours for a heavily used tractor, 1,500–2,500 for a combine, per AHDB.
- Trend in repair spend — track it separately from routine service; a rising trend, not a single expensive year, is the signal.
- Resale value decay — machines sold before their hour count crosses into the next depreciation band typically retain more resale value; your dealer or auction house can quote current comparables for your specific model.
- Try it: Run your own numbers
AHDB’s replacement-cycle guidance (7–10 years for heavy-use tractors, 6–9 years for owned combines) is a starting framework, not a rule — an operation running fewer annual hours can extend both ranges. Track your own hours against these bands rather than defaulting to a fixed calendar age.
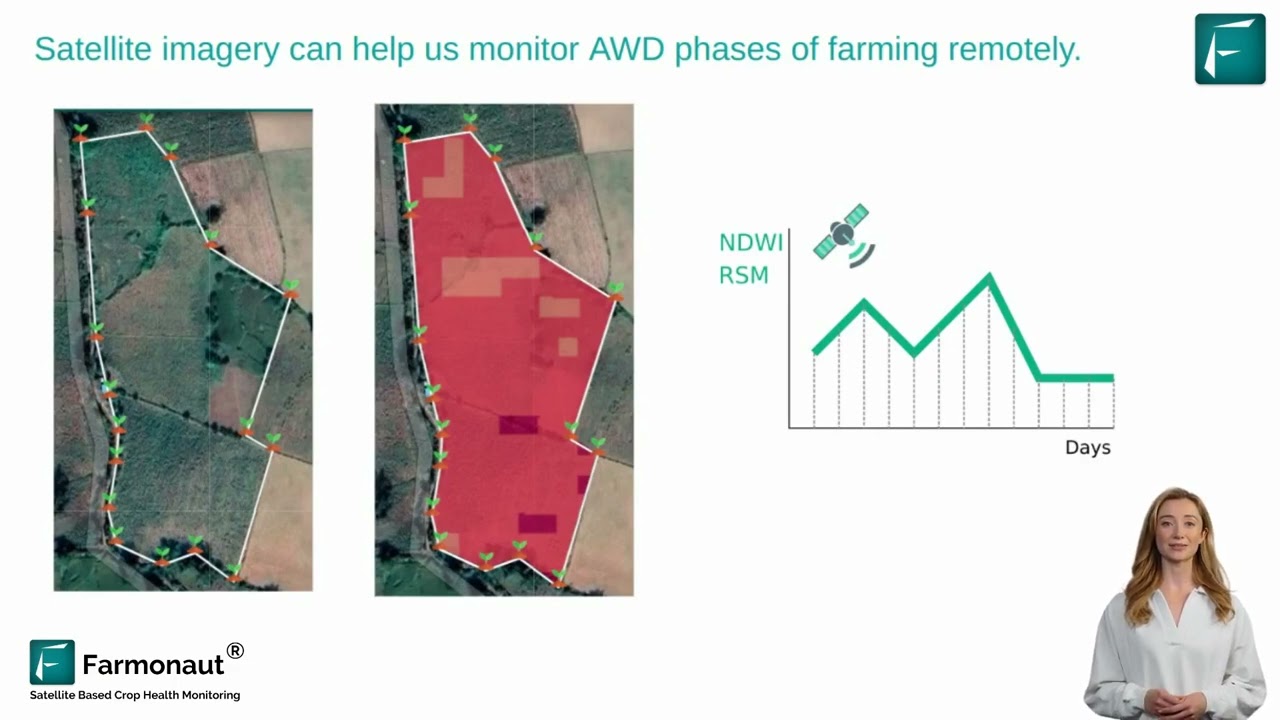
For operators running mixed fleets across multiple fields or sites, matching machinery investment to actual field conditions — rather than replacing on a fixed schedule regardless of terrain and yield variability — is where satellite field data earns its keep. Our Fleet Management solutions track utilization and field-level conditions so replacement and deployment decisions are based on real usage patterns rather than calendar age alone.

Financing Your Farm Machinery: What’s Actually Available
Financing is where most replacement decisions actually get made, since few operations pay $623,657 for a tractor or £350,000–£550,000 for a combine in cash. The honest answer on current rates: specific APRs and loan terms for farm machinery financing in the US, UK, Canada and Australia change by lender, farm size, and region often enough that no single published figure stays accurate for more than a quarter or two, and the research base for this article did not turn up a current, citable national rate table for any of the four markets.
What you can do instead is treat financing as a comparison against the cost baselines above. If your dealer or lender quotes a monthly payment, divide it by your acreage and compare it against the US $171/acre ownership-and-operating benchmark, or against the UK’s £78,700–£99,100 annual machinery-cost range scaled to your farm size — that tells you whether a specific financing offer is in line with what comparable operations are already carrying, even without a published national rate.
Three financing routes show up across these markets:
- Dealer or manufacturer finance — often bundled with a new-equipment purchase; compare the total cost against a straight bank loan before signing, since promotional rates can carry a higher equipment list price to offset them.
- Bank or agricultural credit lending — typically requires a farm financial history and collateral; ask specifically for the amortization schedule so you can compare it against your expected resale value at trade-in.
- Leasing — lower upfront cost, no ownership at term end unless you exercise a purchase option; useful for machines with fast technology turnover (guidance systems, telematics) where owning long-term risks obsolescence.
For UK growers specifically, AHDB’s guidance on machinery costs and depreciation also covers available tax relief on new equipment purchases — worth checking against current HMRC capital allowances rules before financing a purchase, since relief rules shift by tax year in a way this article can’t durably capture.
Ask at least two lenders (your equipment dealer’s finance arm and an independent agricultural bank or credit union) for a like-for-like quote on the same machine and term. Compare the total cost of financing — not just the monthly payment — against the ownership-cost benchmarks in the table above for your market.
Repair and Maintenance: Budgeting for Uptime
Maintenance budgeting is the piece most operators under-plan for, and it’s also where the clearest cost data exists. In the US, the $171/acre and $255.80/hour figures from farmdoc daily already fold in repair costs alongside fuel and depreciation — they are not a repairs-only line item, which is worth knowing before you try to isolate a maintenance-specific number from that source.
No source in the current research base breaks out a national average maintenance cost by individual equipment type — tractor, combine, and sprayer maintenance separately — for the US, UK, Canada or Australia. Most public sources report either a bundled ownership-and-operating figure (as above) or a wide range rather than a single average. If you need a maintenance-only figure for a specific machine class, your two most reliable paths are: (1) your own dealer’s service department, which can quote average annual service cost by model and hour band, and (2) your own repair log compared year over year — the trendline matters more than any single external benchmark.
What the England data does make clear is the scale of the maintenance-and-running bill relative to total output: at 18% of output on cereal farms (Defra, 2024/25), machinery running costs are a large enough share that a maintenance-manual task list growing out of control is not a minor inconvenience — it’s a line item worth tracking against that 18% benchmark every season.
| Maintenance Planning Input | Figure | What It Tells You |
|---|---|---|
| US bundled ownership + operating cost | $171/acre (2024) | Includes repairs, fuel, depreciation — not repair-only |
| US 310 PTO HP tractor operating cost | $255.80/hour (2025) | Per-hour basis for budgeting large-tractor use |
| UK cereal farm machinery share of output | 18% (2024/25) | Benchmark ratio to flag an oversized fleet or rising repair trend |
| Maintenance cost by equipment type (tractor vs. combine vs. sprayer) | Not published nationally | Get from your dealer’s service department or your own repair log |
Predictive maintenance tools reduce the gap between “the machine breaks” and “you knew it was coming.” Connected sensors tracking hydraulic pressure, engine temperature, tire wear and battery health give operators a lead time on failures that a fixed service calendar can’t. Pairing that telemetry with environmental and compliance monitoring — tracking emissions and input use alongside machine health — is where our Carbon Footprinting solutions fit for operations that need both uptime data and regulatory reporting in one place.

Track Systems: Where They Fit (and Where They Don’t)
Rubber track systems replace conventional wheeled undercarriages on tractors and combines to reduce soil compaction and improve traction in wet or uneven fields. It’s worth being direct about the evidence here: the research base for this article does not contain adoption-rate percentages or cost-differential figures for track versus wheel systems in the US, UK, Australia or Canadian markets specifically. Any percentage you see quoted elsewhere without a named source and date should be treated with caution.
What can be said honestly: track systems carry a higher upfront cost than an equivalent wheeled configuration on the same base machine, and that premium is typically quoted by the dealer at time of order rather than published as a national average, because it varies by manufacturer, track width, and machine class. If track systems are a live decision for your operation, the two things worth asking your dealer directly are the incremental purchase price over the wheeled equivalent for your specific model, and the track belt’s replacement interval and cost — since belts, unlike tires, are usually not rebuildable and represent a distinct maintenance-budget line once installed.
Where tracks do show up in the replacement-cost data available: they add to the base machine price that feeds into the US $623,657 and UK £350,000–£550,000 figures cited above, so factor a track option into your financing comparison rather than pricing it separately.
Dealer Networks and Named Suppliers
Searches for specific dealer and supplier names — including regional and multi-branch dealer groups — are common when operators are actively shopping a replacement, and dealer choice affects financing terms, parts availability, and service turnaround as much as the machine itself does. This article deliberately does not rank or recommend specific dealer networks, since dealer coverage and service quality are local and change with ownership consolidation. The comparison worth running before committing to any dealer: ask for their average parts lead time and whether they carry certified pre-owned inventory with documented service histories, since both directly affect the maintenance and resale factors covered above.
Automation and Modular Retrofits Changing the Replacement Calculus
A growing share of the replacement decision now runs through retrofit and modular-upgrade options rather than full machine replacement. Guidance systems, sensor packages and telematics units can often be added to an existing tractor or combine rather than requiring a new chassis — which changes the AHDB replacement-cycle math above, since a machine with an upgraded guidance and sensor package may justify running past the standard 7–10 year window if the core drivetrain is sound.
- Modularity and retrofits: guidance systems, sensors and power units added to older machines extend useful life and defer full replacement capital.
- Interoperability: standardized data protocols now let mixed-fleet operations (multiple manufacturers) share telemetry and management software.
- Precision modules: variable-rate sprayers and planters cut input costs by only treating what’s needed, which is a real offset against the $171/acre US ownership-and-operating baseline.
Adding a retrofit module without checking compatibility with your existing telemetry standard limits future upgrades and can lower resale value. Confirm interoperability with your dealer before installing.
Robotic and autonomous options are also reshaping which manual tasks even need a machine replacement to solve. For a closer look at where autonomous field robots currently stand, see our guide to AI agriculture robots transforming farming, and for harvesting-specific automation trends, our piece on harvesting machines in agriculture and timber.

Leasing, Pay-Per-Use and Certified Pre-Owned Marketplaces
Given the scale of the purchase prices above — a US 310 HP tractor at $623,657, a UK combine at £350,000–£550,000 — it’s no surprise that leasing, pay-per-use, and certified pre-owned channels have grown as alternatives to outright purchase, particularly for smaller operations and cooperatives that can’t absorb the full capital outlay in one cycle.
- Leasing: spreads cost over a fixed term without tying up capital; best suited to equipment with fast technology turnover.
- Pay-per-use: scales fleet capacity to actual seasonal need rather than year-round ownership.
- Certified pre-owned: buyers should require a documented service history and remote-diagnostic capability, not just a odometer/hour-meter reading, to protect against inheriting the repair-trend problem described in the maintenance section above.
When reviewing second-hand equipment, check for enabled remote diagnostics — not just a paper maintenance record. This speeds up troubleshooting and cuts downtime once the machine is in your fleet.
Workforce Shift: From Manual Tasks to Fleet Supervision
As machinery takes on more of the repetitive field work, the labor requirement shifts from manual operation toward supervision, diagnostics and data interpretation. This is a direct response to the same maintenance-manual-task pain point covered above: an operator who can read a telemetry alert and dispatch a mobile repair crew resolves a fault faster than one working from a printed service manual alone.
- Tech literacy: sensor networks, basic hydraulics and pneumatics diagnosis, and fleet software are now baseline skills rather than specialist ones.
- Data-informed workflows: staff move from constant manual operation to monitoring exception alerts from autonomous or semi-autonomous units.
- Multi-site oversight: remote monitoring tools let a smaller team supervise machinery across several fields or locations.
For operations managing multiple sites, real-time monitoring tools that consolidate field conditions and machinery status in one dashboard reduce the travel time otherwise spent just checking on equipment. Our Large Scale Farm Management tools are built for exactly that multi-site oversight need.

Lifecycle Management and Traceability
Total cost of ownership — not sticker price — is the right frame for a replacement decision, and every figure in this article supports that: the US $255.80/hour operating cost, the UK’s 18%-of-output machinery share, and AHDB’s 7–10 year replacement cycle are all lifecycle inputs, not one-time purchase numbers.
- Modular design: upgradeable components mean a machine doesn’t need full replacement just because one system (guidance, sensors) is outdated.
- Lifecycle analytics: forecasting service needs, depreciation and resale value across the full ownership period, not just at purchase.
- Traceability: documented, verifiable maintenance and ownership records support resale value and reduce fraud risk in the certified pre-owned market described above.
For supply-chain and machinery-record transparency across a fleet, see Farmonaut’s Blockchain Traceability systems.

Replacement Timing Calculator
Use your own hours and repair spend against the AHDB replacement-cycle benchmarks and the farmdoc daily cost baseline to see where your machine sits relative to typical replacement timing.
Run your own numbers
Assumptions: uses AHDB’s UK replacement-cycle bands (7–10 years / 6,000–8,000 hours for tractors, 6–9 years / 1,500–2,500 hours for combines) and farmdoc daily’s US $171/acre ownership-and-operating benchmark. It does not account for financing terms, regional labor rates, or machine-specific resale values — treat the output as a starting comparison, not a purchase decision.
Farmonaut Technology Insight: Satellite-Driven Data for Machinery Decisions
Replacement, financing and maintenance decisions are only as good as the field and fleet data behind them. Farmonaut’s platform gives farmers, and fleet managers real-time inputs for exactly these calls:
- 🛰 Real-Time Satellite Monitoring: Track crop health, soil conditions and field-level variability that should inform which fields justify a heavier machinery investment.
- 🤖 AI-Based Advisory: Our Jeevn AI delivers field-specific recommendations from your smartphone or web dashboard.
- 🔗 Blockchain Traceability: Authenticated machinery and supply-chain records support resale value and reduce fraud risk in certified pre-owned purchases.
- 🗂 Fleet Management: Optimize logistics, scheduling and utilization tracking across your machinery fleet.
- 🌍 Environmental Monitoring: Track carbon footprint, emissions and compliance alongside machinery uptime data.
The platform runs on Android, iOS, web browser, and API — no additional hardware purchase required to start tracking the data that informs these decisions.
For developers and integrators:
Farmonaut API
Farmonaut API Developer Docs
Frequently Asked Questions
-
Q: When should I replace a tractor instead of repairing it?
A: AHDB guidance puts the typical replacement window for a heavily used tractor at 7–10 years or 6,000–8,000 hours. Inside that window, compare your actual annual repair spend against the US benchmark of $171/acre (farmdoc daily, 2024) or your local equivalent — a rising repair trend approaching lease-payment territory is the stronger signal than age alone. -
Q: How much does a new tractor or combine actually cost right now?
A: A 310 HP tractor listed at $623,657 in the US in 2025 (farmdoc daily), up 7.5% year-on-year. A new 200–250 hp combine in the UK runs £350,000–£550,000 as of 2026 (AHDB via British Farmers). Both figures update on their own schedules — check the source links in this article for the current year’s number. -
Q: Where can I find current farm machinery financing rates?
A: No current, citable national rate table exists for the US, UK, Canada or Australia in the sources checked for this article. Request like-for-like quotes from at least two lenders — your dealer’s finance arm and an independent agricultural bank — and compare total financing cost against the ownership-cost benchmarks above. -
Q: Do rubber tracks cost significantly more than wheels?
A: Track systems carry a higher upfront cost than an equivalent wheeled configuration, but no published adoption-rate or cost-differential percentage exists for the US, UK, Australia or Canada in the current research base. Ask your dealer for the incremental price and the track belt’s replacement interval for your specific model. -
Q: What’s a reasonable annual maintenance budget?
A: No national source breaks out maintenance cost by individual equipment type. The closest public benchmark is the US bundled ownership-and-operating figure of $171/acre (farmdoc daily, 2024) or the UK’s 18%-of-output ratio for cereal farms (Defra, 2024/25). For a maintenance-only figure, ask your dealer’s service department for an average by model and hour band. -
Q: Where can I find authoritative carbon monitoring, traceability, and advisory solutions?
A: Farmonaut’s Carbon Footprinting, Traceability, and Environmental Advisory modules deliver satellite, AI, and blockchain-powered oversight for agriculture and related sectors.
Conclusion: Replacement Decisions Backed by Real Numbers
The clearest throughline across all four markets: replacement, financing and maintenance decisions hold up better against a repair-cost trend and a published replacement-cycle band than against a fixed calendar age. AHDB’s 7–10 year tractor and 6–9 year combine bands, farmdoc daily’s $171/acre and $255.80/hour US figures, and Defra’s 18%-of-output UK ratio all point to the same method: track your own numbers against a named benchmark, and revisit the decision when the trend — not a single year — crosses it.
Where this article has been honest about gaps — financing rates, track-system cost differentials, and equipment-type-specific maintenance averages — the fastest path to a real number is your own dealer, lender, or repair log, compared against the benchmarks above rather than against guesswork.

 Rouge VC
 Yutz Automation
 AgroGreen Dynamics
 Leher
Leher AgroRisk
 Oath Inc
 Reddane Farming
 Esri North East Africa
 Cresol
 Atur Kuliner
 MDCV UK
 Zerella Group
 Etech Consulting Madagascar
 Vestlandsforsking
 Delicio
 WB Dev
 Sama Premium
 Prochecker
 Tres Valles
 LACOS Geoinformation
 Magrifly
 LatConnect 60
 Blickwinkel
