

Customer case study · Avocado
Avocado Orchard Monitoring: A Western Cape Case Study
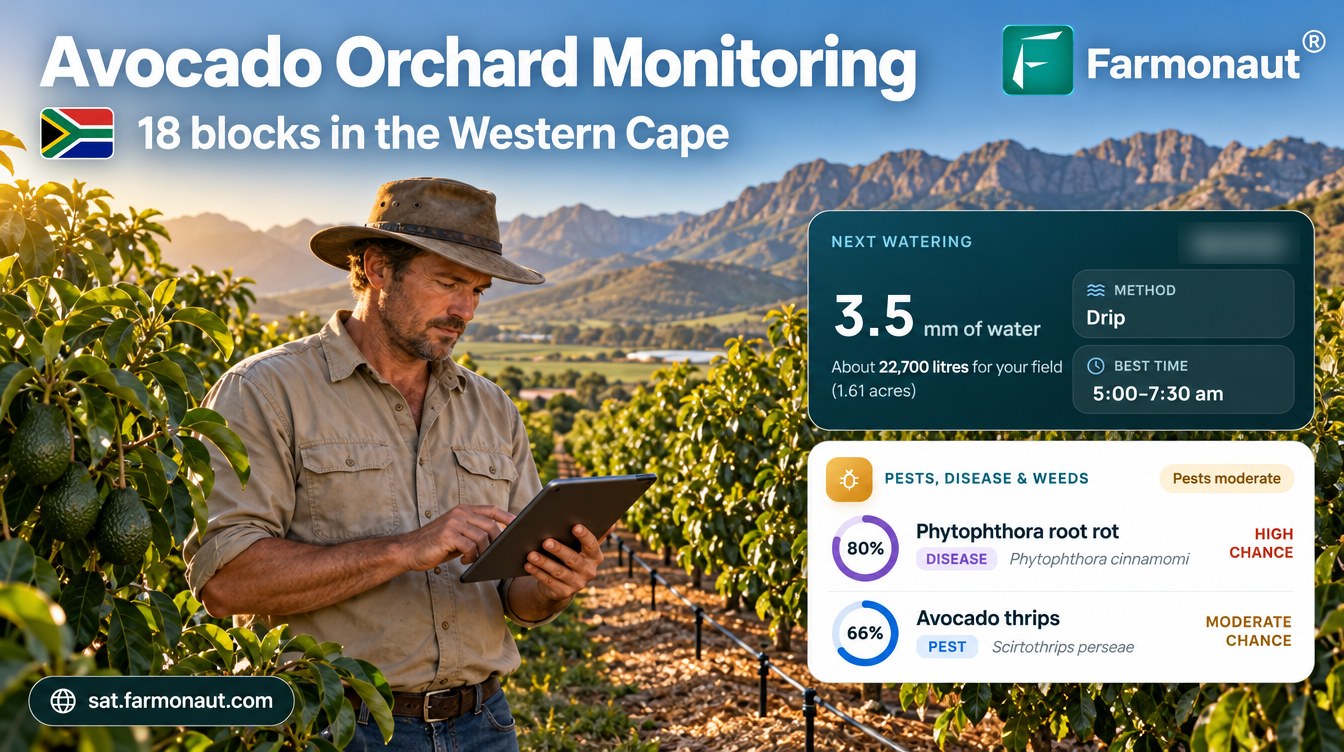
Avocado orchard monitoring planned no water on 47% of block-days across 18 avocado fields in the Western Cape, about 47% less water than a same-dose daily routine, and tracked Phytophthora root rot, thrips and false codling moth risk stage by stage.
Key takeaways
- A grower in the Western Cape’s Breede River Valley received 994 satellite advisories for 18 avocado fields (about 21.6 ha) from February to October 2026.
- 1,877 of 3,962 planned block-days (47.4%) had no irrigation, about 47% less water than a same-dose daily routine.
- Phytophthora root rot was the highest-scored threat from July to October, at 79% to 85%.
- Thrips risk rose from 64% in July to 79% in September as the trees flowered and set fruit.
- Every one of 4,970 nutrient recommendations included an organic source option.
In this article
- The orchard and the brief
- Why the Western Cape is a new avocado region
- How avocado orchard monitoring works on these blocks
- A season in advisories
- Root rot, thrips and other risks by stage
- Water: micro-sprinkler and drip scheduling
- Nutrition and soil
- The same system on avocados in Morocco
- What other avocado growers can take from it
- FAQ
Avocado orchard monitoring from satellites gave a grower in South Africa’s Western Cape a fresh irrigation plan, a pest and disease risk score and a nutrient plan for each of 18 blocks every few days. From February to October 2026 the advisories planned no water on 47% of block-days, which cut the planned water by about 47% compared with giving each block the same dose every day. Phytophthora root rot was the threat scored highest from July to October, while thrips risk climbed as the trees flowered.
This case study walks through 994 advisories sent to the grower between 23 February and 21 October 2026. It shows what the satellite saw, what each advisory recommended and how other avocado growers can use the same data. All figures come from the grower’s advisory records unless a source is named. Risk scores are modelled probabilities, not confirmed outbreaks, and the water figures are planned amounts, not metered use.
The orchard and the brief
The grower farms avocados in the Breede River Valley, a dry, irrigated fruit and wine valley inland from Cape Town. The orchard covers about 21.6 hectares (53 acres). The grower drew it in the Farmonaut app as 18 fields: 17 blocks of about 0.2 to 3.6 hectares each, plus one outline of the whole orchard. Each field has received its own advisory every few days since late February 2026.
Where the orchard is
Western Cape shaded; marker shows the approximate area only
A dry valley brings its own set of jobs. Rain is low, so the trees depend on micro-sprinklers and drip lines all year. Too little water stresses the trees, but too much keeps the roots wet, and wet roots are where Phytophthora root rot starts. The grower wanted one place to see canopy health, water needs and pest and disease risk for every block, so the farm team could decide where to walk first.
| Item | Detail |
|---|---|
| Region | Breede River Valley, Western Cape, South Africa |
| Crop | Avocado |
| Fields | 18: 17 blocks plus a whole-orchard outline |
| Area | About 21.6 ha (53 acres); blocks 0.2 to 3.6 ha |
| Irrigation | Micro-sprinkler and drip |
| Monitoring period | February to October 2026 |
| Advisories | 994 in total |
| Soil (modelled) | pH about 6 to 6.3, low salinity, organic carbon rated low |
Why the Western Cape is a new avocado region
South Africa grows avocados on about 21,240 hectares and produces around 160,000 tonnes a year, according to the 2026 industry figures from Subtrop, the body that runs the South African Avocado Growers’ Association. Its figures show that 46% of the crop is exported fresh, 45.4% is sold fresh at home and 8.6% goes to oil and guacamole. Most of it still comes from the warm north-east. A 2023 study by South Africa’s National Agricultural Marketing Council (NAMC) puts Limpopo at 60% of the national crop and Mpumalanga at 30%, with the Eastern and Western Cape together at about 1%.
Chart
Share of South Africa’s avocado crop by province
% of national production
That small share is changing. The NAMC study notes that production has expanded into KwaZulu-Natal, the Eastern Cape and the Western Cape because of rising demand, and Subtrop puts the industry’s annual expansion at about 800 hectares. It is a good example of how new farming technology makes it possible to grow avocados in more places. The NAMC study notes that some South African orchards in semi-arid areas get only about 400 mm of rain a year, against more than 1,000 mm in most of the older regions. In a valley like this one, the irrigation plan matters as much as the soil.
Growers in the new region are not on their own. The Agricultural Research Council’s Tropical and Subtropical Crops campus lists avocado among its mandate crops and runs avocado pest and disease scout training. Satellite advisories add a block-by-block view on top of that local advice.
How avocado orchard monitoring works on these blocks
Each advisory starts with fresh satellite images of the block. The Sentinel-2 satellites have a revisit time of five days with its two satellites and 10-metre detail in the visible and near-infrared bands. From these bands the system works out vegetation indices such as NDVI, which compares red and near-infrared light reflected by the land surface to show how much green leaf is present. Avocado trees keep their leaves all year, so a drop in NDVI on one block is a reason to check that block for water stress or root problems.
Infographic
How each block advisory is built in 4 steps
- 1Satellite passSentinel-2 images each block every few days; Sentinel-1 radar covers cloudy dates.
- 2Read the canopyNDVI and moisture indices show leaf health and wetness block by block.
- 3Add weather and stageThe weather outlook and growth stage set water need and pest and disease risk.
- 4Block planIrrigation by method, risk scores, nutrients with organic options, and a yield estimate.
When cloud hides the orchard, the system switches to radar. Sentinel-1 radar can image the ground by day or night, whatever the weather. In this orchard, 102 advisories on 7 cloudy dates were built from radar data.
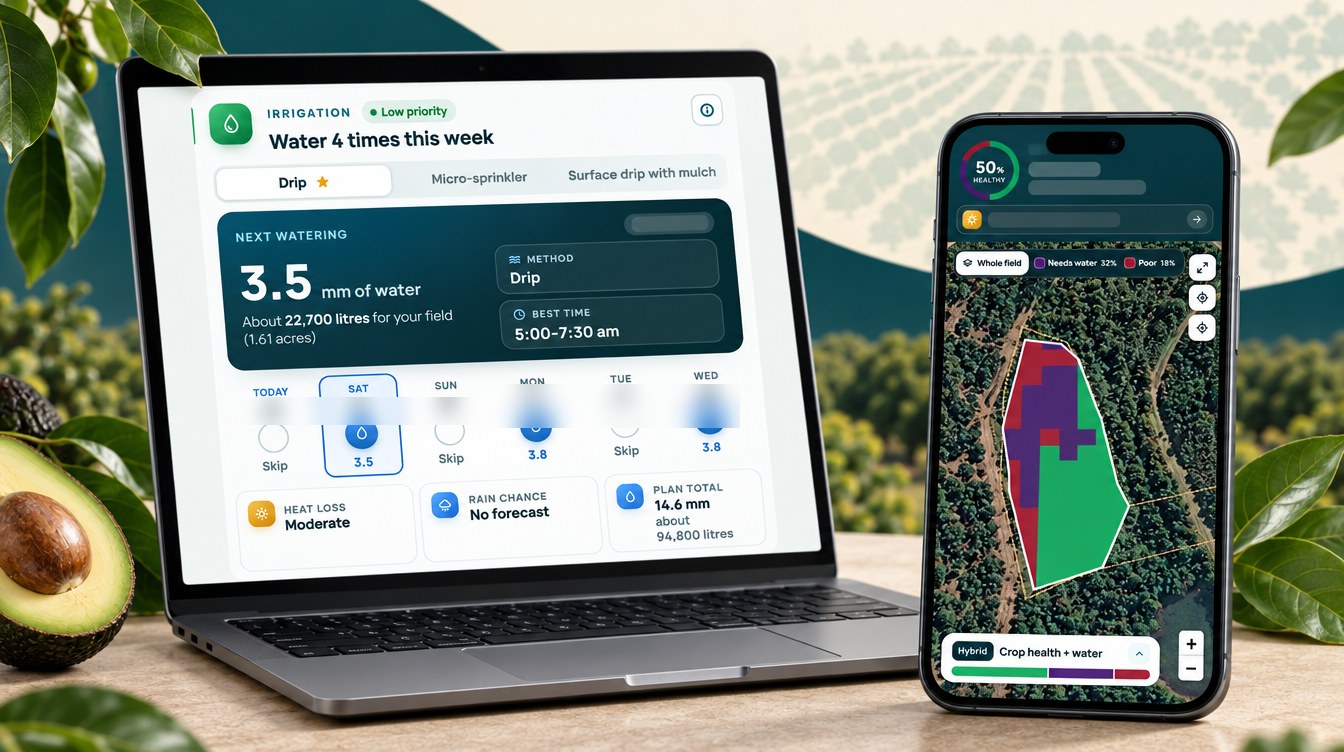
The images are combined with the weather outlook, the block’s growth stage and the crop’s known water and nutrient needs. The result is one advisory per block with five parts: an irrigation plan for the next week, pest and disease risk scores, weed risk, a fertilizer plan with organic options, and a yield estimate.
A season in advisories
From late February to October 2026, the 18 fields received 994 advisories, or about one every four to five days per field. The growth stage in each advisory followed the trees from fruit maturing on the tree, through the winter flush, to spring flowering and fruit set.
| Months | Main stage reported | What the advisories focused on |
|---|---|---|
| Mar to Jun | Fruit maturity | False codling moth and anthracnose risk at their peak |
| Jul | Pre-flowering flush | Root rot risk rising, planned water up in a dry month |
| Aug to Sep | Flowering | Root rot risk at its highest, thrips risk climbing |
| Oct | Fruit set | Thrips watch on young fruit, steady watering |
Because each block gets its own advisory, a block that runs ahead or behind shows up quickly. The latest advisories, in October, reported fruit set and early fruit growth on most blocks, and the yield card pointed to a picking window of October to November for the fruit already on the trees.
▶ How a Farmonaut satellite farm advisory is read, section by section · 9:13
Root rot, thrips and other risks by stage
Four threats appeared in almost every advisory: anthracnose (in 991 of 994), false codling moth (964), thrips (902) and Phytophthora root rot (805). Each score is a modelled probability built from the block’s canopy, moisture and weather data, and it tells the grower where and when to look first. The scores moved with the season.
Chart
Modelled risk by month, 2026
Average risk score across 18 fields, %
Phytophthora root rot
The root rot score never fell below 78% in any month from March to October, and it was the highest-scored threat from July to October, at 79% to 85%. That fits what the disease needs. The UC IPM avocado guidelines say root rot thrives in areas of excess soil moisture and poor drainage, and that good irrigation management is the most important control. They advise against watering soil that is already wet and recommend a thick layer of coarse wood-chip mulch under the trees.
For chemical control, the advisories paired a phosphonate option with an organic one such as a Trichoderma drench. A 2021 paper in the South African Avocado Growers’ Association yearbook notes that in South Africa only trunk injections were then used for phosphonate control, while foliar sprays are also used in other parts of the world. Always follow the product label and local rules.
Thrips
Thrips risk fell to 64% in July, then rose to 79% in September as the trees flowered and set fruit. That timing matters. UC IPM notes that almost all avocado thrips damage occurs when fruit are 5 to 15 mm long, and the scars that look like alligator skin only show as the fruit grows. A rising score at fruit set is the cue to start checking young fruit and the undersides of new leaves.
Anthracnose and false codling moth
Anthracnose and false codling moth scores peaked while fruit was maturing on the trees. Anthracnose averaged 85% in April and eased to 63% by October. UC IPM explains that most anthracnose fruit damage only shows after harvest, so pre-harvest risk is mainly a reason to handle and cool fruit with care. The false codling moth score peaked at 95% in April and fell to 62% in October. The EPPO database lists avocado as a host of this moth and records it as a quarantine pest in the European Union, one of the main markets for South African fruit, so growers who export watch it closely.
Over the season, the advisories also flagged stem-end rot (182 times), mites (64) and coconut bug (41), mostly during fruit maturity.
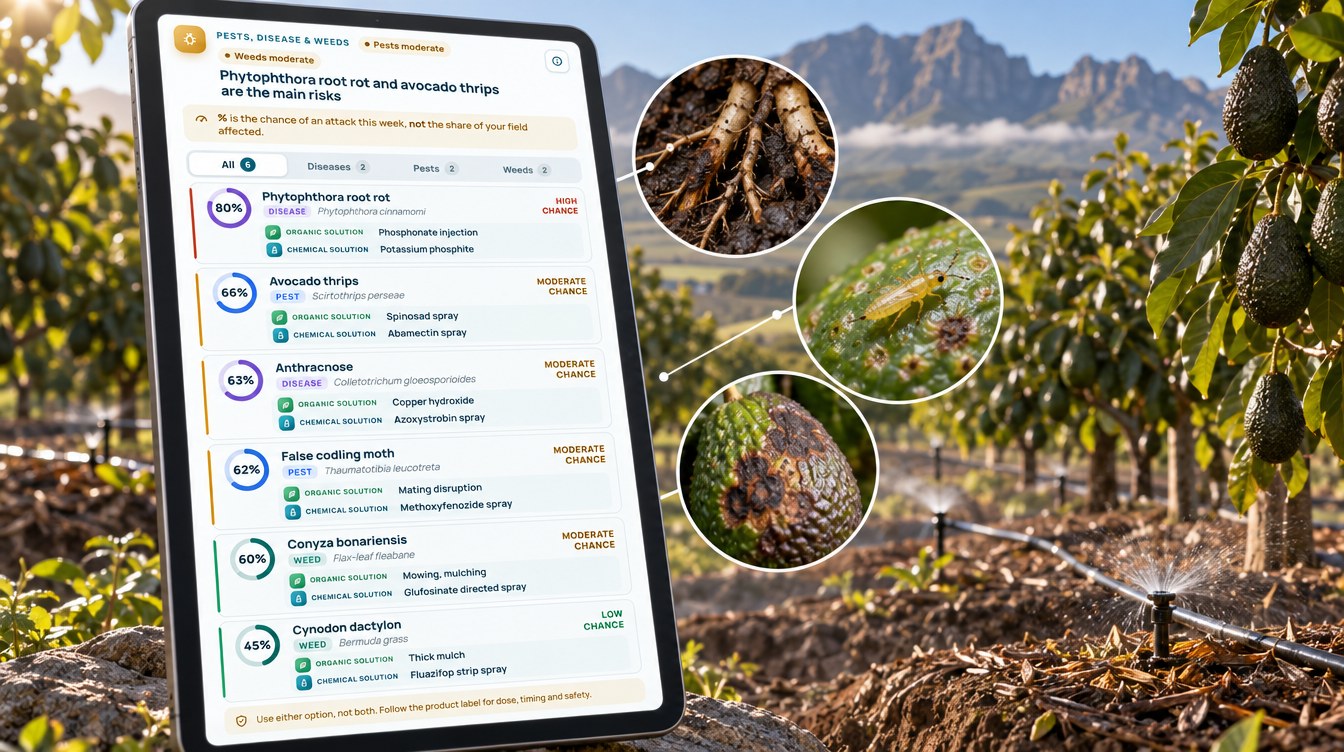

▶ Organic options for managing thrips in orchards · 11:56
Water: micro-sprinkler and drip scheduling
The irrigation part of each advisory plans a dose for each of the next several days and names the best method. About 55% of advisories named micro-sprinklers as the main method and most of the rest named drip. When advisories overlapped, we kept the newest plan for each block and day. That left 3,962 block-days of planned irrigation from 24 February to 28 October 2026. On 1,877 of them, or 47.4%, the advisory planned no water at all.
Chart
Rainfall vs planned irrigation by month
mm per month; Robertson long-term mean vs advisory plan per field, 2026
The rest of the plan followed the crop and the weather. On days when water was planned, the dose averaged 3.5 mm. Across all days, the plan averaged 1.9 mm a day, and from April to October it stayed between 1.25 and 2.0 mm a day. The FAO irrigation guide gives avocado without ground cover a crop coefficient of 0.60 at the start of the season, 0.85 in mid-season and 0.75 at the end, so the trees keep using a steady amount of water through the year.
Local rainfall explains why the trees need that water. At the Robertson weather station in the Breede River Valley, the 1971–2000 normals show between 18 mm and 49 mm of rain a month, and about 335 mm a year. July 2026 was unusually dry: the South African Weather Service reported that parts of the south-western Western Cape recorded their lowest rainfall on record in July. The advisories raised the planned dose from 1.25 mm a day in May and June to 2.0 mm a day in July.
Planned water compared with a daily routine
To compare, we worked out what each block would have received if it had been given its own average watering dose every day. Against that same-dose routine, the advisory plan used 42% to 53% less water per block, and about 47% less across all 18 fields. In cubic metres, each block’s plan came to about 3,520 to 4,660 m³ per hectare over the eight months, against 7,230 to 8,160 m³/ha with a same-dose daily routine. This is a comparison of plans, not a metered saving, but it shows how much of the season’s water depends on timing. For a crop that is sensitive to wet roots, fewer and better-timed waterings also help with root rot.
Chart
Water per block: plan vs daily routine
Planned m³ per hectare, 24 Feb–28 Oct 2026; 8 of 18 fields shown
Nutrition and soil
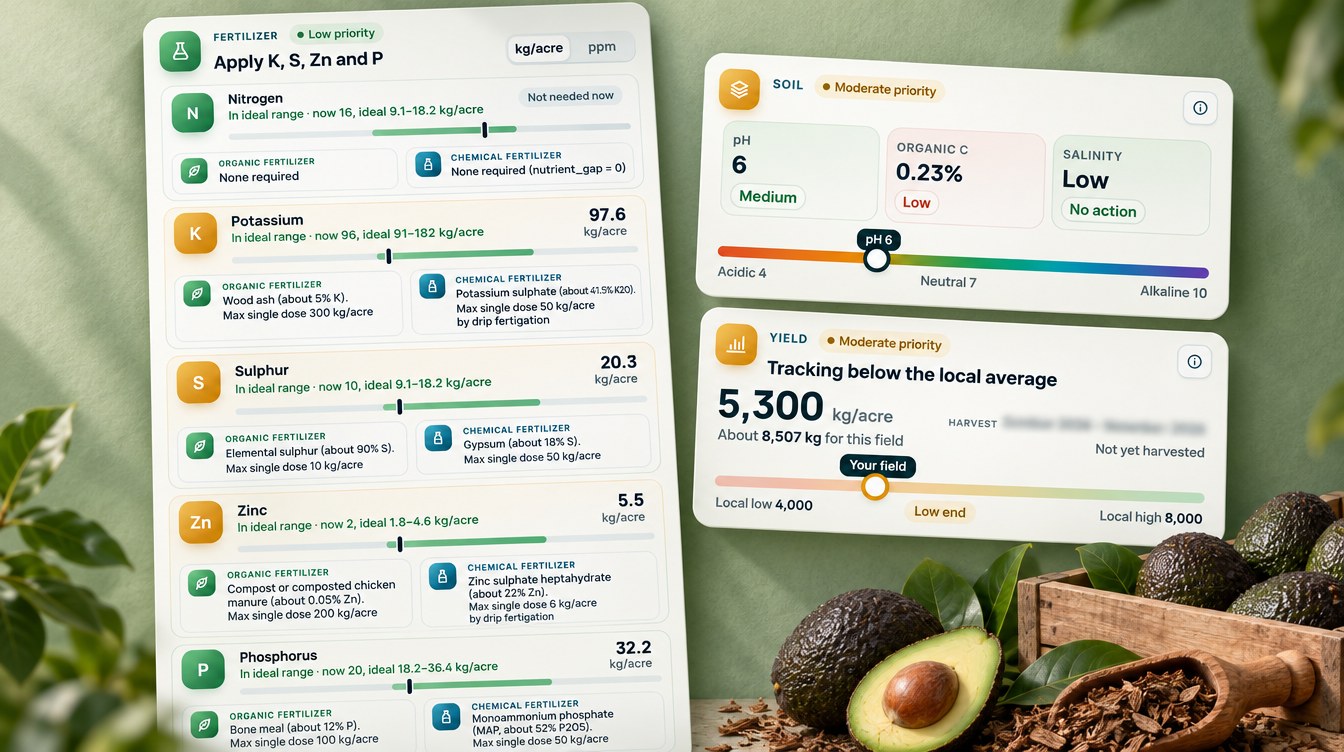
The fertilizer part of each advisory compares the block’s modelled nutrient levels with the ideal range for the current growth stage, then gives a rate for each nutrient that is short. Each advisory covered nitrogen, phosphorus, potassium, sulphur and zinc. That made 4,970 nutrient recommendations, and every one of them came with an organic source as well as a conventional fertilizer. In October, for example, one block was told nitrogen was already in range and to apply potassium, sulphur, zinc and phosphorus, with options such as wood ash, elemental sulphur, compost and bone meal.
The soil section rated the blocks at pH about 6 to 6.3 with low salinity and organic carbon rated low. Low organic carbon is one more reason the advisories leaned on compost and mulch: they feed the trees, build soil and, as UC IPM notes for root rot, coarse mulch also helps the roots. The weed section flagged flax-leaf fleabane, Bermuda grass, annual ryegrass and black nightshade, and suggested mowing and mulching as organic options.
The same system on avocados in Morocco
The same advisories run on another avocado farm, in north-west Morocco. Five fields there, about 78 hectares (194 acres), received 170 advisories from April to October 2026. Phytophthora root rot and anthracnose appeared in every one of them, with root rot scored between 68% and 80% in each month. Persea mite and Mediterranean fruit fly were the other main threats, with the fruit fly score reaching 94% in June.
The water pattern was different. The Moroccan plan left 31% of 604 block-days dry, and on watering days the dose averaged 4.7 mm. Against a same-dose daily routine, that plan was 31% lower. Two avocado farms in two climates got two different plans, which is the point of planning per block.

▶ Why radar satellites can see crops through cloud · 2:37
What other avocado growers can take from it
Three lessons stand out from this grower’s eight months of data.
Chart
Share of days planned with no irrigation
All 18 fields, by month, %
- Treat water as root rot control. Almost half of the planned days were dry, and the plan was about 47% lower than a same-dose routine. For avocados, that also means fewer days with wet roots.
- Watch risk by stage, not by calendar. False codling moth and anthracnose scores peaked while fruit matured; root rot and thrips scores peaked around flowering and fruit set.
- Plan for dry spells. When July turned out drier than normal, the plan raised the daily dose instead of following a fixed winter routine.
Avocado orchard monitoring works best as a guide for where to look, not a replacement for walking the blocks and checking roots and young fruit. If you run your own orchard, the calculator below estimates how much water planned dry days could save on your blocks, and what that water is worth at your own price per cubic metre.
Try the numbers for your own farm below.
Calculator
How much water could planned dry days save in your orchard?
Enter your own orchard size, usual daily dose, season length, share of dry days and water cost.
- Water with a same-dose daily routine: 72,000 m³
- Water with planned dry days: 50,400 m³
- Saving per hectare: 2,160 m³/ha
- Value of water not applied: 43,200 ZAR
- Value in US dollars: $2,400
Example values only, not a benchmark or forecast. Enter your own water cost per cubic metre and today’s exchange rate. 1 mm of water over 1 hectare is 10 cubic metres (fixed in the formula).
FAQ
What is avocado orchard monitoring?
It uses regular satellite images of each orchard block to track canopy health, moisture and change over time. Farmonaut turns those images, plus weather data and the trees’ growth stage, into a plan for irrigation, nutrition and pest and disease risk for each block.
Can a satellite detect Phytophthora root rot?
Not directly. A satellite sees changes in the canopy and soil moisture, not the pathogen in the roots. The advisory combines those signals with weather and growth stage to score the risk, and the grower confirms any problem by checking the roots and trees on the ground.
How often does an avocado block get a new advisory?
In this case study each field received an advisory about every four to five days. Radar images filled the gaps on cloudy dates.
Does it work for micro-sprinklers and drip?
Yes. Each irrigation plan gives a dose in millimetres and names the recommended method. In this orchard the advisories named micro-sprinklers in about 55% of cases and drip in most of the others, and they compared the dose for each method.
How much water can an avocado orchard save with an irrigation plan?
It depends on the site and season. In this case study the advisory plan was about 47% lower than giving each block the same dose every day, but that is a planned figure, not a metered one. Use the calculator above with your own numbers.
Farmonaut orchard monitoring
Get a block-by-block plan for your orchard
Draw your blocks once, and Farmonaut sends a satellite-based irrigation, nutrient and pest and disease risk plan for each one every few days on web, Android or iOS.




Keep reading
Sources
- Farmonaut advisory records for a Western Cape avocado orchard and a Moroccan avocado farm (2026): sat.farmonaut.com
- Subtrop, Industry perspectives: DoA–Subtrop special markets coordinating meeting (16 July 2026): ecert.co.za
- NAMC, The South African Avocado Value Chain Study (March 2023): namc.co.za
- ARC Tropical and Subtropical Crops, division homepage: arc.agric.za
- SAnews / South African Weather Service, Parts of Western Cape record lowest rainfall (2 August 2026): sanews.gov.za
- Meteostat, Robertson weather station (WMO 68718), climate normals: meteostat.net
- ESA, Sentinel-2 facts and figures: esa.int
- Copernicus SentiWiki, Sentinel-1 mission: sentiwiki.copernicus.eu
- NASA Earth Observatory, Measuring vegetation (NDVI and EVI): science.nasa.gov
- FAO, Irrigation and Drainage Paper 56, Chapter 6 crop coefficients (1998): fao.org
- UC IPM, Phytophthora root rot of avocado: ipm.ucanr.edu
- UC IPM, Avocado thrips: ipm.ucanr.edu
- UC IPM, Anthracnose of avocado: ipm.ucanr.edu
- South African Avocado Growers’ Association Yearbook 44, foliar phosphonate sprays for Phytophthora root rot (2021): avocadosource.com
- EPPO Global Database, Thaumatotibia leucotreta host plants: gd.eppo.int
- EPPO Global Database, Thaumatotibia leucotreta categorization: gd.eppo.int
Discussion
Questions, corrections or field experience? Share them below. First-time comments are reviewed before they appear, and your email is never published.
No comments yet. Be the first to add a question or your experience.

 Kisanwala
 Agro La Gándara
 Global Agrifood
 HIPSAC
 ZOL Zimbabwe
 Juligerm
 AdBio
 MISE Maroc
 NWNS
 Red August Group
 Farm Inc
 WeMe Global
 Agrotoken
 Blue BearX
 Insignito
 Croptimum
 DnCubed
 Field Capacity
 Indosistim Teknologi

 Licence holder · Niger · Gold
 Licence holder · Nigeria · Gold + lithium










