

Customer case study · Apples
Apple Orchard Monitoring: Ontario Harvest, Brazil Bloom
Apple orchard monitoring scored scab risk at 40% to 45% in an Ontario cidery orchard at harvest and left 19 of 25 days dry, while nine Brazilian blocks in bloom had no planned water on 50.7% of block-days, about half a same-dose routine.
Key takeaways
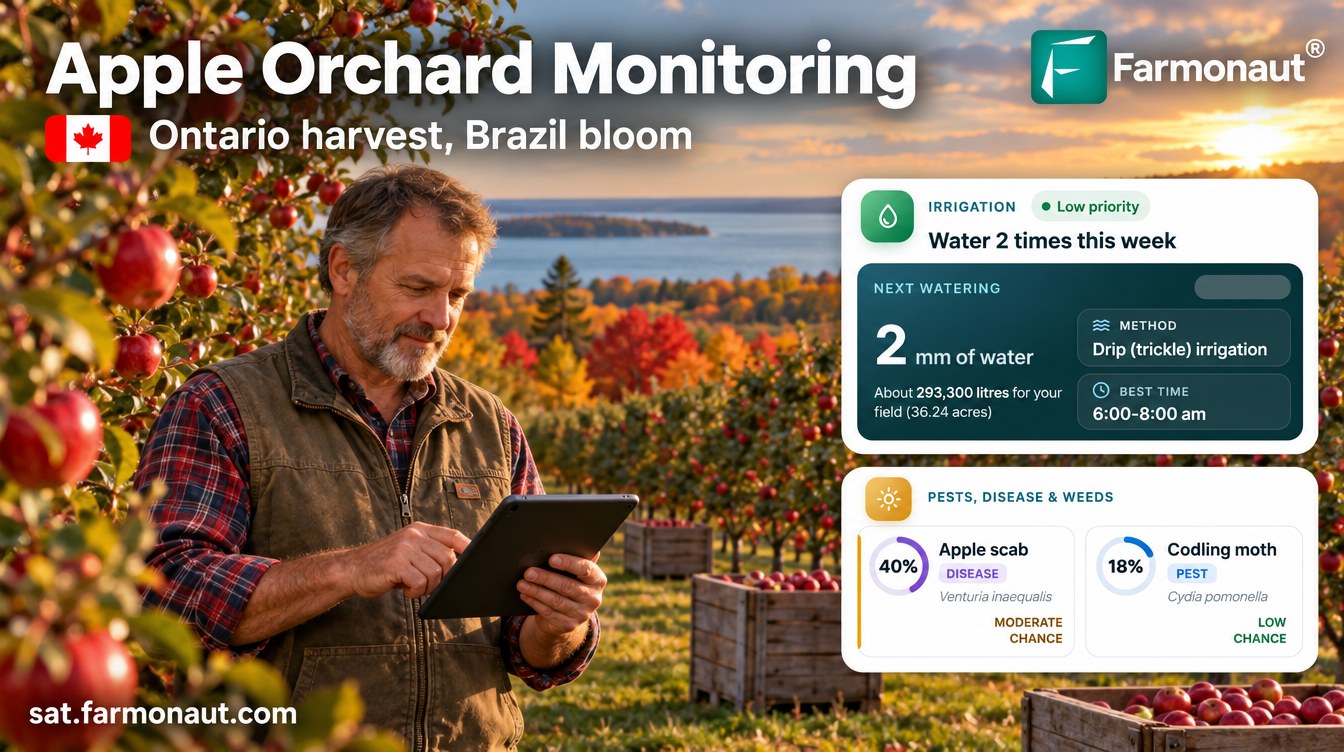
- A 36-acre (14.7 ha) Ontario cidery orchard received five satellite advisories at harvest in October 2026; apple scab scored 40% to 45%.
- The Ontario plan left 19 of 25 days dry and held back all fertilizer until spring bud break.
- Nine apple blocks in Rio Grande do Sul, Brazil, had no planned water on 50.7% of block-days, 51% less than a same-dose daily routine.
- In Brazil, scab risk rose to 85% to 89% from bud break to bloom, and red mite peaked at 79% in September.
- Every one of 4,180 nutrient recommendations for the Brazilian blocks included an organic option.
In this article
- The orchard and the brief
- Why Ontario apples are worth watching
- How apple orchard monitoring works
- Two ends of the apple season
- Ontario at harvest: apple scab risk and other threats
- Brazil in bloom: scab, red mite and Grapholita
- Water: dry days at both ends of the season
- Planned water compared with a daily routine
- Nutrition, soil and yield
- More orchards on the same system
- What other apple growers can take from it
- FAQ
Apple orchard monitoring by satellite gave a 36-acre (14.7 ha) cidery orchard in Ontario a fresh scab, pest, water and nutrient plan every five days at harvest. At the same time, nine apple blocks in southern Brazil were moving through bloom on the same system. In October 2026 the Ontario orchard’s apple scab risk sat at a moderate 40% to 45%, and its plan left 19 of 25 days dry. Over the past 12 months the Brazilian blocks had no planned water on 50.7% of block-days, about half the water of a same-dose daily routine.
We first wrote about this Ontario grower in our corn yield case study. This follow-up covers the new orchard and sets it beside a Brazilian orchard at the other end of the apple year. All figures come from the growers’ advisory records. Risk scores are modelled probabilities, not confirmed outbreaks, water figures are planned amounts, not metered use, and yields are estimates.
The orchard and the brief
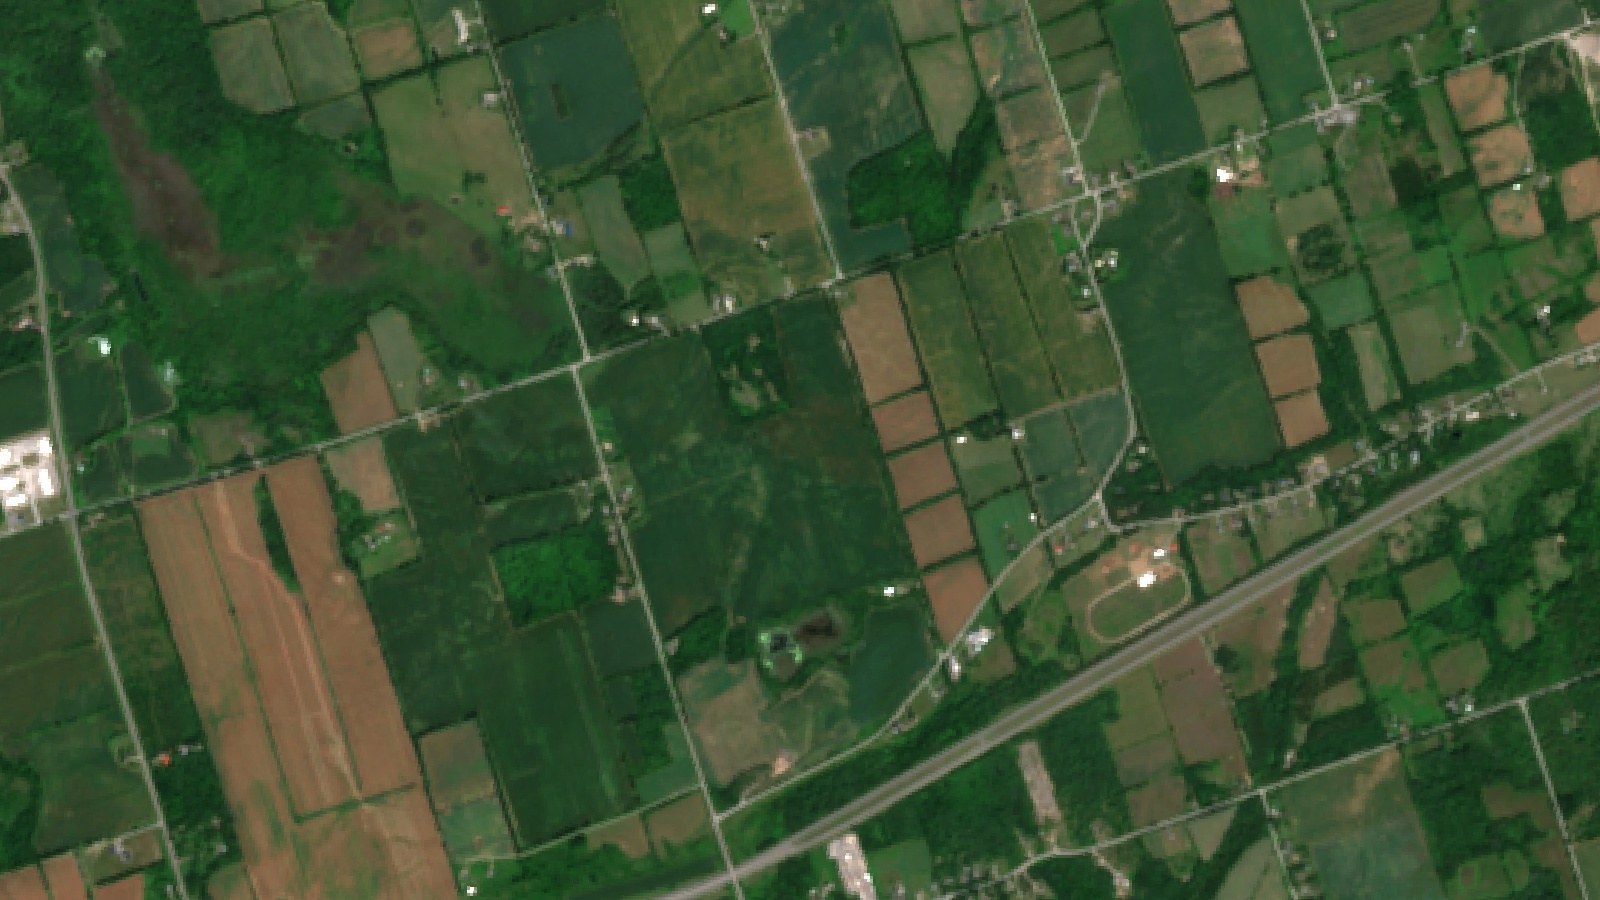
The grower runs a cidery orchard of about 36 acres (14.7 ha) on the eastern shore of Lake Ontario, alongside a larger area of corn and soybeans. The orchard was added to the Farmonaut app in early October 2026, and its first five advisories used satellite images taken between 1 and 19 October, during the last weeks of harvest. The grower wanted the same view for the orchard that the corn fields already had: one screen with canopy health, water, pest and disease risk and nutrients, without walking every row first.
Where the orchard is
Ontario shaded; the marker shows the approximate area only
To show what the system does across a whole apple year, we compare it with an orchard in the highlands of Rio Grande do Sul, Brazil. There, nine apple blocks have received advisories since mid-2025, and they reached full bloom in September 2026, just as Ontario was picking its last fruit.
| Item | Ontario orchard | Brazil orchard |
|---|---|---|
| Region | Eastern Lake Ontario, Canada | Northeast Rio Grande do Sul |
| Area | 36.2 acres (14.7 ha), one block | 45.7 acres (18.5 ha), nine blocks |
| Irrigation | Drip | Drip |
| Advisories | 5, 1 to 19 October 2026 | 836, July 2025 to October 2026 |
| Stage in October | Late harvest | Petal fall and fruit set |
| Soil (modelled) | pH 6.5 to 6.8, low salinity, low organic carbon | pH about 6.2, low salinity, low organic carbon |
Why Ontario apples are worth watching
Ontario is Canada’s largest apple province. Agriculture and Agri-Food Canada reports that the Ontario crop reached 161,641 tonnes in 2024, close to 42% of the country’s apple crop. Statistics Canada’s fruit table puts the 2025 Ontario crop at 148,493 tonnes from 5,706 hectares (14,101 acres) of bearing orchards, with a farm-gate value of CAD 128.2 million.
Chart
Ontario apple production by year
Total production, thousand tonnes, 2018–2025
That works out to about 26 tonnes per hectare, or 10.5 tonnes per acre, on average in 2025. Production has swung between about 128,000 and 166,000 tonnes a year since 2018, so a grower’s own block-by-block view matters more than the provincial average.
How apple orchard monitoring works
Each advisory starts with fresh satellite images of the orchard. The Sentinel-2 satellites have a revisit time of five days with its two satellites and 10-metre detail in the visible and near-infrared bands. From these bands the system works out vegetation indices such as NDVI, which compares red and near-infrared light reflected by the land surface to show how much green leaf is present.
Infographic
How each orchard advisory is built in 4 steps
- 1Satellite passSentinel-2 images each block every few days; Sentinel-1 radar adds data through cloud.
- 2Read the canopyNDVI, moisture and radar indices show vigour and wetness block by block.
- 3Add weather and stageThe weather outlook and growth stage set water need and pest and disease risk.
- 4Block planIrrigation, risk scores, nutrients with organic options, and a yield estimate.
When cloud hides the orchard, the system uses radar as well. Sentinel-1 radar can image the ground by day or night, whatever the weather. In the Ontario advisories, a radar vegetation index and a radar soil-moisture reading backed up the optical data.
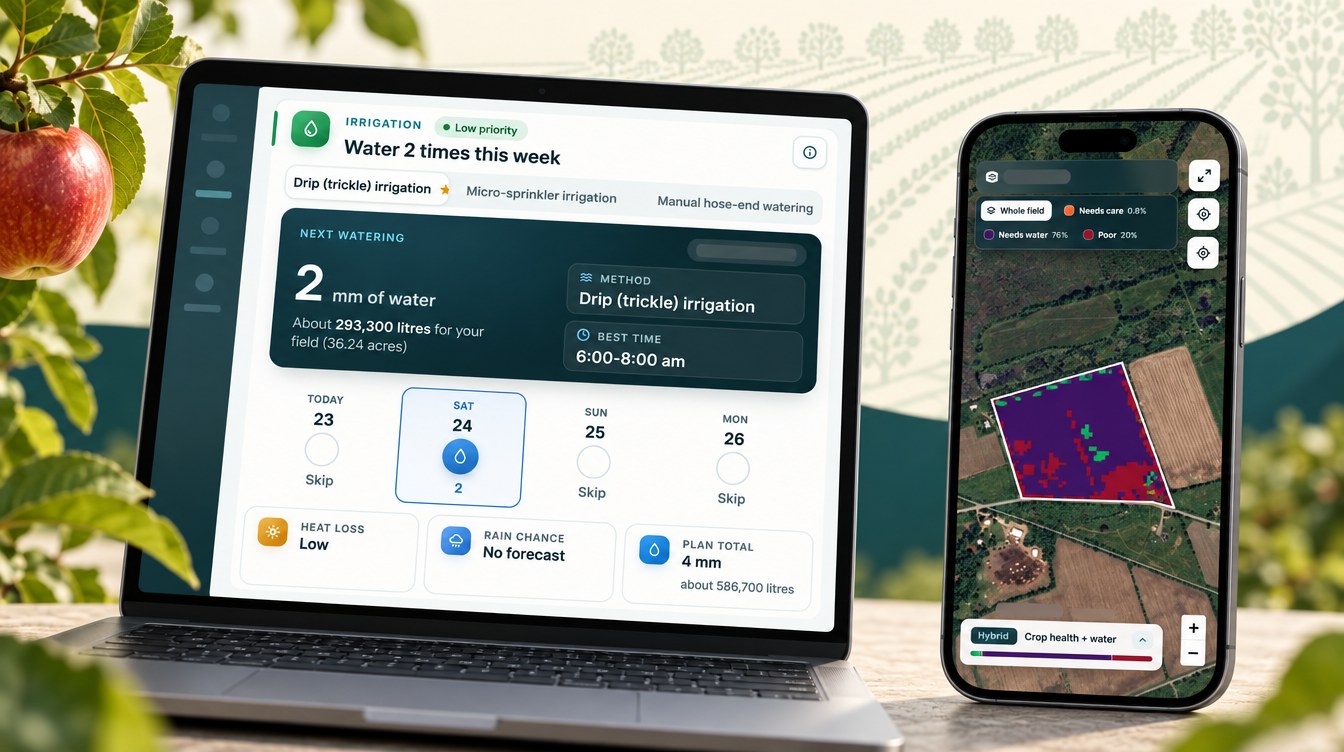
The images are combined with the weather outlook, the trees’ growth stage and the crop’s known water and nutrient needs. The result is one advisory per block with five parts: an irrigation plan for the next week, pest and disease risk scores, weed risk, a fertilizer plan with organic options, and a yield estimate.
Two ends of the apple season
Apples in the two hemispheres run about six months apart. When Ontario picks in September and October, Brazil’s trees are in bloom. The growth stage reported in each advisory followed the trees through the year.
| Months | Brazil stage reported | Ontario at the same time (typical) |
|---|---|---|
| Aug | Bud swell and green tip | Fruit sizing |
| Sep | Pink bud to full bloom | Harvest begins |
| Oct | Petal fall and fruit set | Late harvest (advisories start) |
| Nov | Fruit set and thinning | Leaf fall |
| Dec to Jan | Fruit growth | Dormancy |
| Feb to Apr | Ripening and harvest | Dormancy to bud break |
| May to Jul | Post-harvest and dormancy | Bloom, fruit set and fruit growth |
The Ontario canopy stayed green to the end. Its NDVI read 0.58 to 0.60 through October, above the 0.30 to 0.45 the advisory expected for an orchard at harvest. The advisory read this as a healthy canopy with no early stress, helped by a green orchard floor. In Brazil, one block’s NDVI rose from 0.30 on 5 October 2026 to 0.70 on 20 October as the leaves and young fruit filled out after bloom.
▶ How a Farmonaut satellite farm advisory is read, section by section · 9:13
Ontario at harvest: apple scab risk and other threats
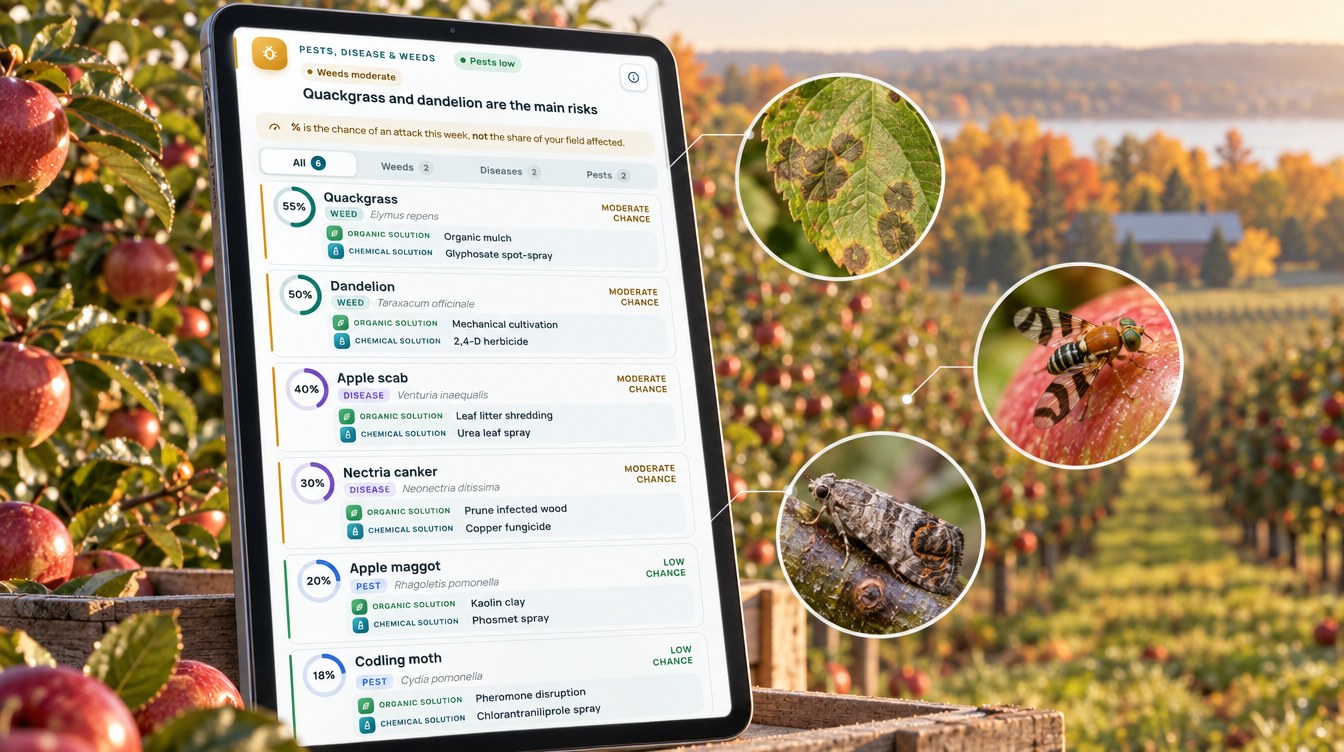
At harvest the advisories scored four orchard threats and two weeds. Apple scab was the highest disease score, at 40% to 45% across the five advisories. Nectria canker scored 25% to 30%, black rot 20% to 25%, apple maggot 15% to 20%, European red mite 10% to 15% and codling moth 18%. Quackgrass and dandelion in the tree rows scored 50% to 55%.

▶ Preventing apple scab and other fungal diseases in fruit trees · 10:51
Chart
Ontario orchard: highest modelled risk in October
Highest score across five advisories, 1–19 October 2026, %
The advisories explained why fruit pests were low: late-season insect activity falls away, and the remaining risk comes from fruit left in the orchard and insects getting ready to overwinter. The disease and weed scores mattered more, because they shape next spring.
Apple scab after harvest
Scab spores for next spring form in this autumn’s fallen leaves. OMAFRA’s ONfruit team, citing the Mills Table in Publication 360A, notes that a primary scab infection needs at least 11 hours of leaf wetness at 10 degrees Celsius, and less time when it is warmer. A wet, cool autumn therefore loads the orchard floor for April.
The Ontario advisory’s options were leaf litter shredding (organic) or a urea spray on fallen leaves. Cornell Cooperative Extension lists urea sprays of 40 lb per acre on fallen leaves and shredding leaf litter with a flail mower among the proven methods, and says any one of them can reduce inoculum production by 80% or more. Cornell also warns that late nitrogen can extend growth on young trees, so check the needs of each block. Always follow the product label and local rules.
Canker, black rot and the fruit pests
Nectria canker scored higher later in October because leaf scars from autumn leaf fall are an entry point for the fungus. The advisory paired it with pruning out infected wood and a copper option at leaf fall. Apple maggot and codling moth scores stayed at 15% to 20%, with kaolin clay and pheromone disruption as the organic options. For a cidery, this matters less for this year’s fruit than for next year’s starting population.
Brazil in bloom: scab, red mite and Grapholita
The Brazilian blocks show what the same system does through a whole season. Over the 12 months to October 2026, apple scab was the threat scored most often (750 times), followed by Grapholita, the oriental fruit moth (508), South American fruit fly (406), bitter rot (395), European red mite (276) and woolly apple aphid (267).

▶ Aphid biology, damage and control, including how crop monitoring helps · 28:21
The monthly scores moved with the trees. Fruit fly, Grapholita and bitter rot peaked at 91% to 97% in January and February, during fruit growth and early harvest. Scab fell to 62% to 67% through autumn and winter, then climbed to 85% to 89% from bud break to bloom in August to October 2026. European red mite peaked at 79% in September; the advisories noted that its overwintering eggs hatch around bud break.
Embrapa, Brazil’s farm research agency, describes Grapholita as having four to five generations a year, with the first flight between August and October. It also notes that fruit damaged by scab helps the pest establish, so good scab control is part of Grapholita control. Embrapa’s guidance favours pheromone mating disruption against the first generation, applied close to August. The advisories offered the same pairing: pheromone disruption as the organic option and an insecticide as the conventional one. Always follow the product label and local rules.
The South American fruit fly is a native pest. Embrapa reports it as the most abundant fruit fly in apple orchards of southern Brazil, which is why its score rose as fruit sized up in December and January.
Woolly apple aphid vs mealybug
Woolly apple aphid scored 72% to 79% on the Brazilian blocks from August to October 2026. Growers sometimes confuse it with mealybugs, because both are covered in white wax. UC IPM describes woolly apple aphids as bark-feeding aphids completely covered by masses of white, wool-like, waxy materials, living in colonies on the trunk, limbs and shoots and on the roots in winter. Root galls that stunt young trees are their main damage. Mealybugs, by contrast, are oval, segmented insects that UC IPM says may be confused with woolly aphids, and they usually hide in protected spots such as branch crotches. A quick look at where the colony sits, and whether it forms galls, tells the two apart. Our guide to aphids vs mealybugs covers more of the differences.
Chart
Brazil orchard: modelled risk by month
Average risk score across nine blocks, %, March–October 2026
Water: dry days at both ends of the season
The irrigation part of each advisory plans a drip amount for each of the next several days. When advisories overlapped, we kept the newest plan for each block and day.
Chart
Rainfall near the Ontario orchard
Mean monthly rainfall, mm, April–November, 1981–2010 normals
In Ontario, the plan covered 25 days from 2 to 26 October 2026. It left 19 of them dry (76%) and planned six light drip events of 1.5 to 2 mm, 11.5 mm in total. The advisory estimated the trees’ water use at about 0.5 to 0.7 mm a day in late October, from a crop coefficient of about 0.45 and cool weather. For comparison, the FAO irrigation guide gives apple trees in areas with a killing frost a crop coefficient of 0.45 at the start of the season, 0.95 in mid-season and 0.70 at the end (no ground cover). Soil moisture readings were high, so the plan kept water to a minimum. At Environment and Climate Change Canada’s Mountainview station near the orchard, October rainfall averages about 87 mm (1981–2010 normals).
In Brazil, the 12 months from November 2025 to October 2026 gave 2,829 block-days of planned irrigation. On 1,434 of them, or 50.7%, the advisory planned no water. Planned daily water averaged 3.8 mm in December, during fruit growth, and fell to 0.4 mm in July, during dormancy, when 78% of days were dry. Local rain is high all year: INMET’s long-term normals for Lagoa Vermelha, a station in the same apple region, show 91 to 194 mm a month and 1,691 mm a year (1961–1990).
Chart
Brazil: rainfall vs planned drip by month
mm per month; INMET long-term mean vs advisory plan per block, Dec 2025–Oct 2026
Planned water compared with a daily routine
To compare, we worked out what each Brazilian block would have received if it had been given its own average watering dose every day. Against that same-dose routine, the advisory plan used 46% to 56% less water per block, and 51% less across all nine blocks. For the seven blocks monitored since November 2025, that is about 5,100 to 6,900 cubic metres per hectare in the plan, against 10,900 to 12,800 m³/ha with a same-dose routine. This is a comparison of plans, not a metered saving, but it shows how much of the season’s water depends on timing.
Chart
Brazil: planned water per block vs a daily routine
Planned mm per block, Nov 2025–Oct 2026, seven blocks monitored since November
Nutrition, soil and yield
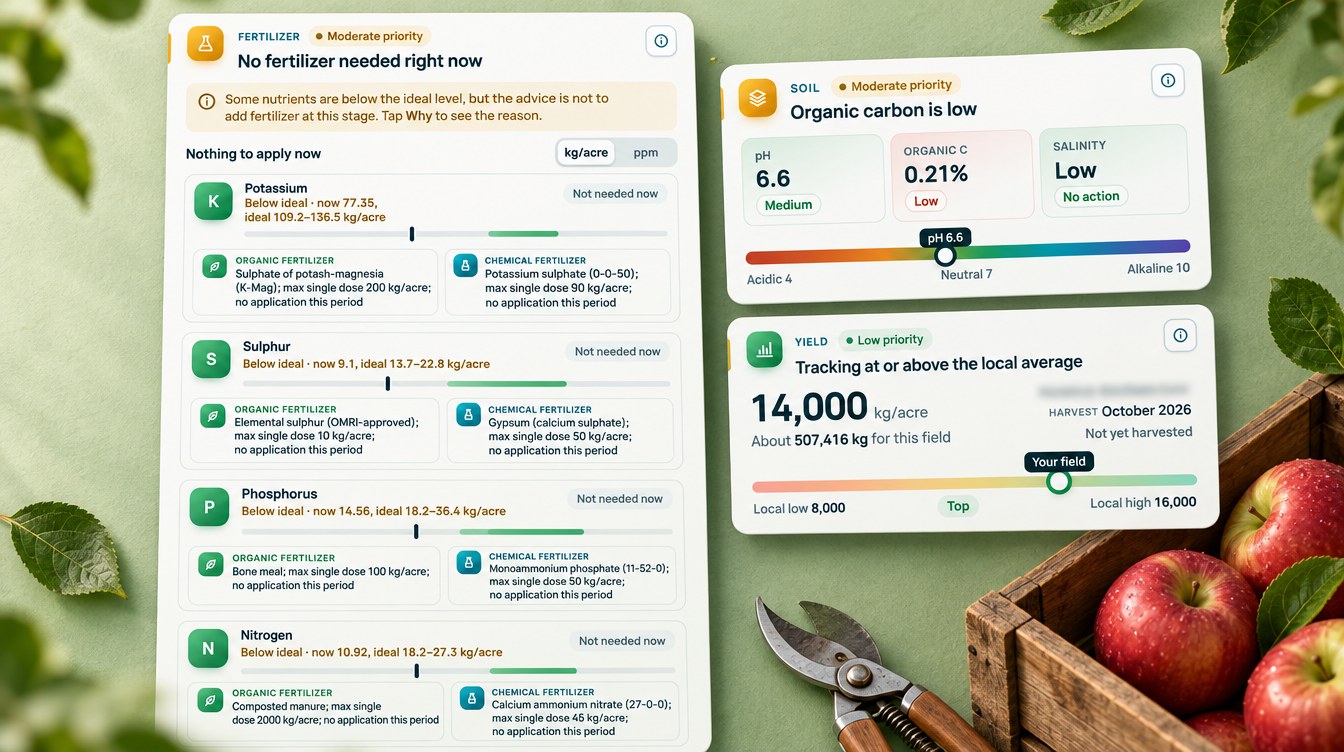
The fertilizer part of each advisory compares the orchard’s modelled nutrient levels with the ideal range for the current stage. In Ontario, nitrogen, phosphorus, potassium, sulphur and zinc were all modelled below the ideal range, yet the advice was to apply nothing in October. The reason was given in plain terms: the trees are not taking up nutrients at harvest, the soil is cold, and late nitrogen can push late growth and reduce winter hardiness. Nitrogen was planned for early spring at bud break, in two splits through the drip line, with composted manure as the organic option.
In Brazil, the advisories gave 4,180 nutrient recommendations from July 2025 to October 2026, and every one came with an organic source as well as a conventional fertilizer. Both orchards were rated low in soil organic carbon, which is why compost and manure options came up so often.
The yield card put the Ontario orchard at about 13,500 to 14,500 kg per acre (about 33 to 36 t/ha) for the October harvest, against a local range of 8,000 to 16,000 kg per acre in the latest advisory. That is above the 2025 Ontario average of about 26 t/ha from Statistics Canada. For the Brazilian blocks, the October estimates for the February 2027 harvest were mostly 14,600 to 18,500 kg per acre (36 to 46 t/ha). IBGE puts the Rio Grande do Sul average at 31.8 t/ha in 2024, from 493,345 tonnes worth BRL 1.41 billion. These are modelled estimates, not forecasts.
More orchards on the same system
The same apple advisories now run on orchards in other climates. An 11-acre orchard in Maine moved from harvest towards dormancy in September and October 2026, with codling moth, apple scab and apple maggot scored at about 50% to 56% on average. A small orchard in northern Greece, in fruit development over the summer, saw codling moth average 85% and European red mite 76%. A half-acre orchard in eastern Denmark had apple scab at 80% and codling moth at 76%. Apple scab was scored in every one of these orchards, from Ontario to Rio Grande do Sul.
What other apple growers can take from it
Three lessons stand out from these two orchards at opposite ends of the season.
- Plan scab control in autumn. The Ontario advisories put the weight on leaf litter and pruning at harvest, because this autumn’s leaves set next spring’s scab pressure.
- Watch risk by stage, not by calendar. In Brazil, scab and red mite peaked from bud break to bloom, while fruit fly, Grapholita and bitter rot peaked during fruit growth and harvest.
- Let the canopy and soil set the water. Both orchards had about half or more of their planned days dry, mostly after harvest and in winter.
If you run your own orchard, the calculator below shows what a share of your crop is worth at your own yield and price, so you can weigh it against the cost of scouting or control.
Try the numbers for your own farm below.
Calculator
What is a share of your apple crop worth?
Enter your own orchard area, yield, price and the share of the crop you want to value.
- Expected crop: 200.0 t
- Expected crop value: $160,000
- Share value per acre: $400
- Share value per hectare: $988
Example values only, not a benchmark or forecast. For context, Statistics Canada’s 2025 Ontario figures work out to about 10.5 tonnes per bearing acre and about CAD 867 per tonne marketed (our calculation from Table 32-10-0364-01). 1 acre = 0.4047 hectares (fixed in the formula).
FAQ
What is apple orchard monitoring by satellite?
It uses regular satellite images of each orchard block to track canopy vigour, moisture and change over time. Farmonaut turns those images, plus weather data and the trees’ growth stage, into a plan for irrigation, nutrition and pest and disease risk for each block.
Can a satellite see apple scab?
Not directly. A satellite sees changes in the canopy and the orchard floor, not the fungus. The advisory combines canopy and moisture data with the weather and the growth stage to score the risk, and the grower confirms any problem in the orchard.
Why would an apple orchard get advisories after harvest?
Autumn work shapes next season. In this case study the October advisories focused on scab in fallen leaves, canker at leaf fall, weeds in the tree rows and when to apply nutrients, which the plan held back until spring.
How often does an orchard get a new advisory?
The Ontario orchard received an advisory about every five days, in line with the Sentinel-2 revisit time. The Brazilian blocks received weekly advisories, with radar data used alongside the optical images.
How much water can an orchard save with an irrigation plan?
It depends on the site and the season. In this case study the Brazilian plan was about 51% lower than giving each block the same dose every day, but that is a planned figure, not a metered one.
Farmonaut orchard monitoring
Get a block-by-block plan for your orchard
Draw your blocks once, and Farmonaut sends a satellite-based irrigation, nutrient and pest-risk plan for each one every few days on web, Android or iOS.




Keep reading
Sources
- Farmonaut advisory records for an Ontario orchard and a Rio Grande do Sul orchard (2025–2026): sat.farmonaut.com
- ESA, Sentinel-2 facts and figures: esa.int
- NASA Earth Observatory, Measuring vegetation (NDVI and EVI): science.nasa.gov
- Copernicus SentiWiki, Sentinel-1 mission: sentiwiki.copernicus.eu
- Agriculture and Agri-Food Canada, Statistical overview of the Canadian fruit industry, 2024: agriculture.canada.ca
- Statistics Canada, Table 32-10-0364-01, Area, production and farm gate value of marketed fruits (2025 data): www150.statcan.gc.ca
- OMAFRA ONfruit, Apple scab and fire blight infection risk with warm, wet weather (2021): onfruit.ca
- Cornell Cooperative Extension, Fall scab inoculum reduction strategies for problem orchards: rvpadmin.cce.cornell.edu
- Embrapa, Manejo de grafolita em pomares de fruteiras de clima temperado (Agapomi 273, 2017): infoteca.cnptia.embrapa.br
- Embrapa, Caracterização e controle das pragas da macieira (mosca-das-frutas): alice.cnptia.embrapa.br
- UC IPM, Woolly apple aphid in apple: ipm.ucanr.edu
- UC IPM, Pest Notes: Mealybugs: ipm.ucanr.edu
- FAO, Irrigation and Drainage Paper 56, Chapter 6 crop coefficients (1998): fao.org
- Environment and Climate Change Canada, Canadian Climate Normals 1981–2010, Mountainview (615EMR7), via MSC GeoMet: api.weather.gc.ca
- INMET, Normais Climatológicas do Brasil 1961–1990, Precipitação Acumulada (Lagoa Vermelha 83916): portal.inmet.gov.br
- IBGE SIDRA, Tabela 1613, Produção Agrícola Municipal: lavouras permanentes (2024): sidra.ibge.gov.br
Discussion
Questions, corrections or field experience? Share them below. First-time comments are reviewed before they appear, and your email is never published.
No comments yet. Be the first to add a question or your experience.

 Farms Easy
 Rouge VC
 Yutz Automation
 AgroGreen Dynamics
 AgroRisk
 Oath Inc
 Reddane Farming
 Esri North East Africa
 Cresol
 Atur Kuliner
 MDCV UK
 Zerella Group
 Etech Consulting Madagascar
 Vestlandsforsking
 Delicio
 WB Dev
 Sama Premium
 Prochecker
 Tres Valles
 LACOS Geoinformation
 Magrifly
 LatConnect 60
 Blickwinkel

 Exploration consultancy · South Africa · Gold
 Licence holder · Niger · Gold










