

Customer case study · Multi-crop farm
Crop Monitoring App for Large Farms: 93 Fields, One Screen
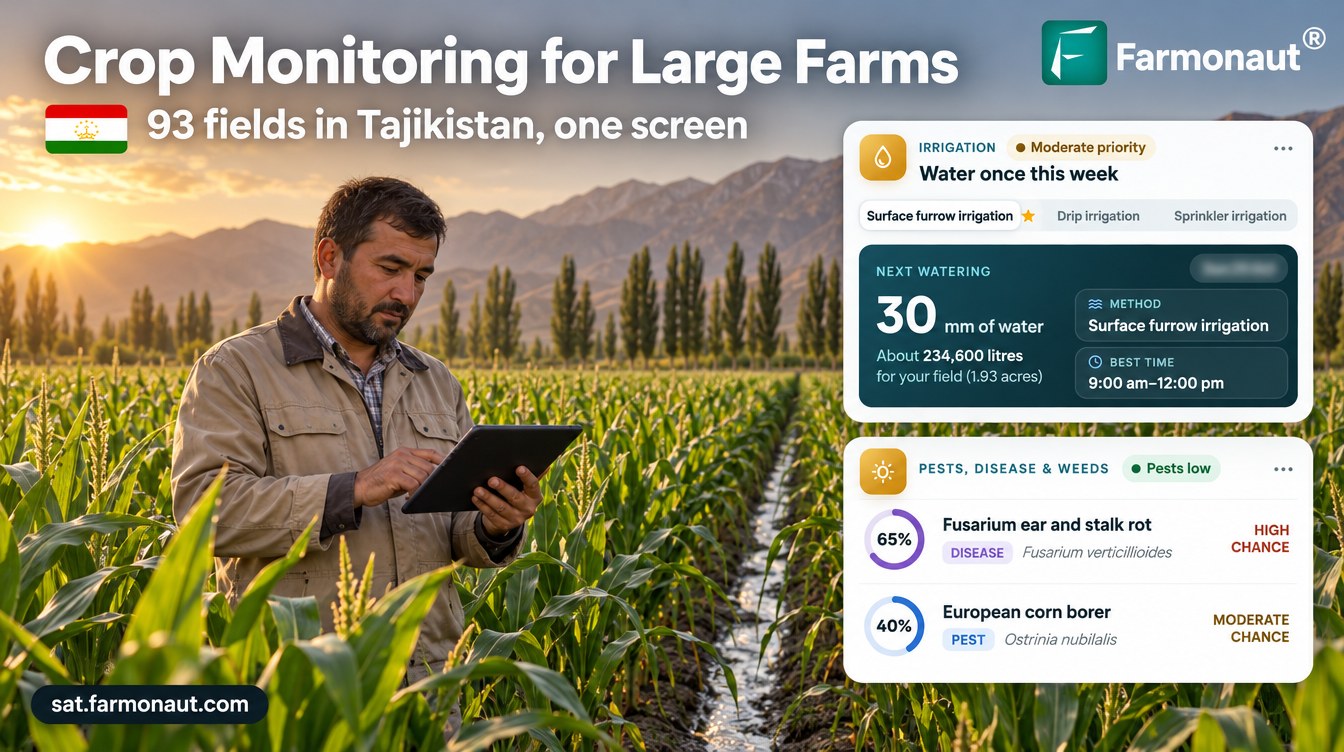
A crop monitoring app for large farms let one manager in Tajikistan’s Sughd region track 93 fields on one screen: weekly risk triage, harvest timing for 72 corn fields, and 43% of April–July field-days planned dry.
Key takeaways
- One farm business watched 93 fields (about 266 ha, nine crops) in northern Tajikistan and received 4,371 satellite advisories from March to October 2026.
- In the week of 15 June all 93 fields had a threat scored at 80% or more; by late August only 23 did, so the scouting list shrank to the fields that mattered.
- 70 of 72 corn fields reached maturity or harvest stage between 13 July and 23 August, 52 of them in the first half of August.
- From April to July, 43% of 10,456 planned field-days had no irrigation, about 43% less water than a same-dose daily routine.
- Every one of 21,850 nutrient recommendations included an organic source option.
In this article
- The farm and the brief
- Why corn, wheat and cotton matter in Sughd
- How a crop monitoring app for large farms works here
- Triage: which fields need attention this week
- The season across 72 corn fields
- Risk by crop and by stage
- Water: dry days across 93 fields
- Nutrition, soil and yield
- What other farm managers can take from it
- FAQ
A crop monitoring app for large farms has one main job: show the manager which fields need attention this week, so nobody has to drive to all of them first. This case study follows one farm business in northern Tajikistan that watched 93 fields, about 266 hectares of corn, wheat, alfalfa, cotton, melons and vegetables, from a single screen. Between March and October 2026 it received 4,371 satellite advisories, roughly one per field every five days.
The data shows how the workload moved through the season. In mid-June every one of the 93 fields had a pest or disease risk score of 80% or more, so the whole farm needed scouting. By late August only 23 did, and the list kept shrinking. Across the main irrigation months, April to July, the advisories planned no water on 43% of field-days. All figures come from the grower’s advisory records. Risk scores are modelled probabilities, not confirmed outbreaks, water figures are planned amounts, not metered use, and yields are estimates.
The farm and the brief
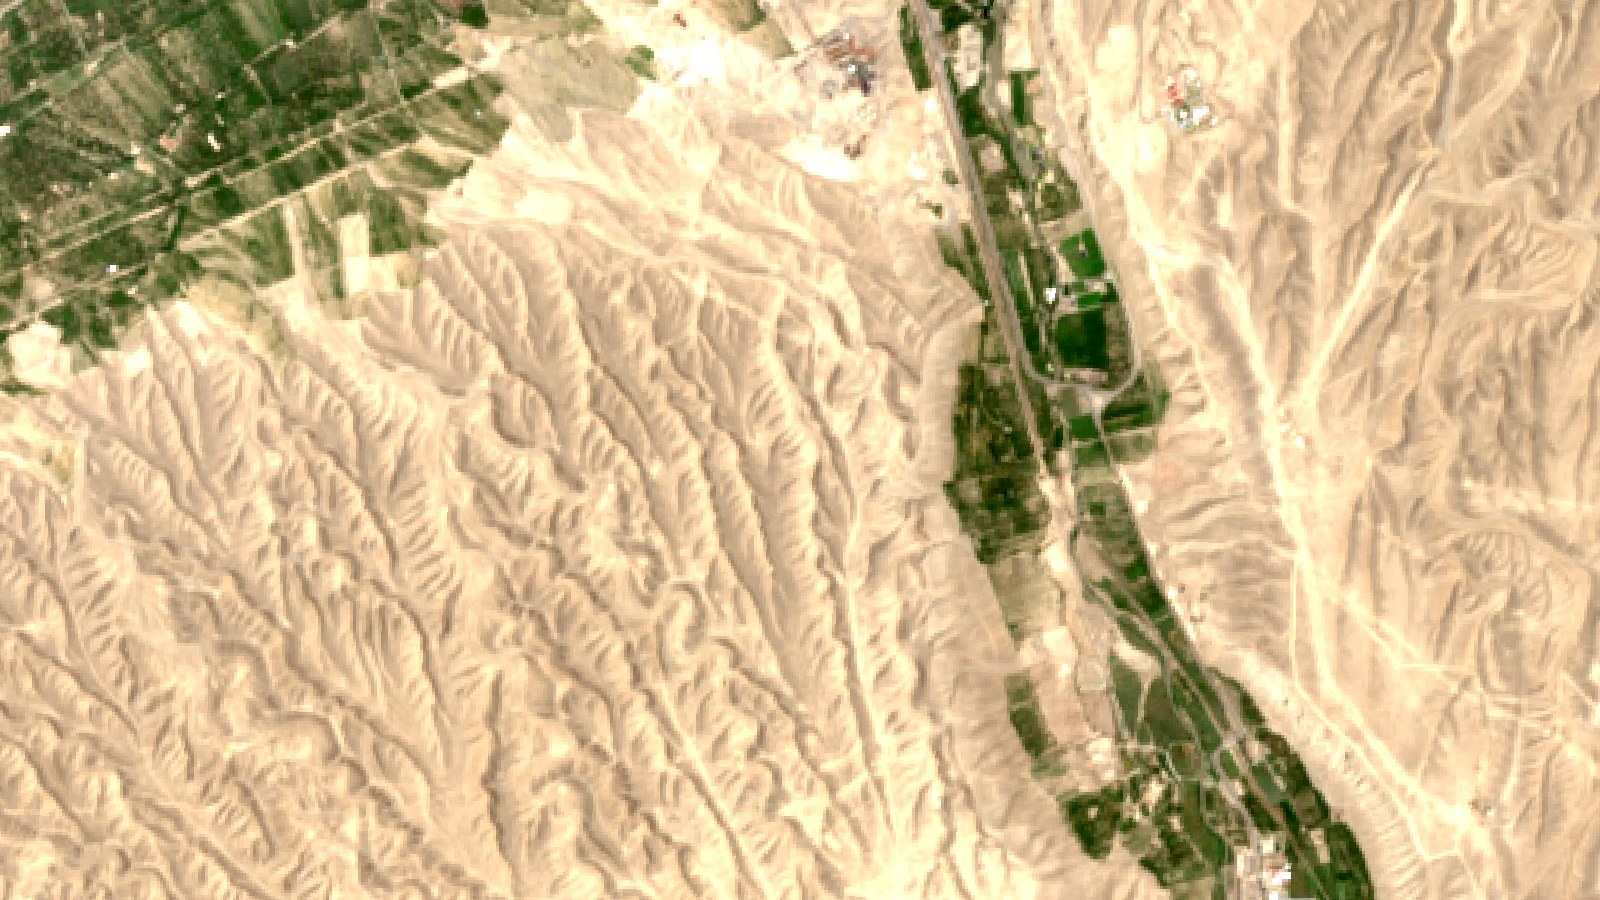
The grower manages 93 fields. Ninety of them sit in the irrigated lowlands of the Sughd region, in the Tajik part of the Fergana Valley. Three more corn fields lie farther south, in central Tajikistan. The fields are small and many: the median field is about 1.8 hectares, the smallest is 0.14 hectares and the largest is about 25 hectares.
Where the fields are
Sughd region shaded; markers show the approximate area only
Corn dominates. Seventy-two fields, about 216 hectares, were sown with corn, almost all between late March and late April 2026. The rest is a mix that a lot of Central Asian farms will recognise: six wheat fields, six alfalfa fields, three watermelon fields, two onion fields, and one field each of barley, cotton, tomato and peach. Most fields are watered by surface furrow or flood irrigation from canals.
With this many fields, the problem is not a lack of data but a lack of time. The manager wanted one place to see crop vigour, water needs and pest and disease risk for every field, and a simple way to sort out which ones to visit first.
| Item | Detail |
|---|---|
| Region | Sughd region, northern Tajikistan (90 fields); central Tajikistan (3 fields) |
| Fields | 93 fields, about 266 ha in total |
| Field sizes | 0.14 to 25 ha; median 1.8 ha |
| Crops | Corn (72 fields), wheat (6), alfalfa (6), watermelon (3), onion (2), barley, cotton, tomato, peach (1 each) |
| Irrigation | Surface furrow and flood |
| Monitoring period | 21 March to 22 October 2026 |
| Advisories | 4,371 in total; 844 in the last 30 days |
| Soil (modelled) | pH about 7.0 to 7.8, low to moderate salinity, organic carbon rated low |
Why corn, wheat and cotton matter in Sughd
Wheat and cotton take up most of Tajikistan’s cropland, and corn is a smaller but important grain. FAOSTAT puts the 2024 harvested area at about 270,600 hectares of wheat, 123,000 hectares of seed cotton and 21,500 hectares of corn, with a similar area of watermelons. The FAO GIEWS country brief estimates the 2025 cereal harvest at about 400 000 tonnes of maize and over 900 000 tonnes of wheat. It also notes that imports cover more than half of the country’s cereal needs, so every tonne grown at home counts.
Chart
Harvested area in Tajikistan, selected crops
Hectares, 2024
The country is also pushing farm software. The Government of Tajikistan has adopted its 2025–2030 Digital Agriculture Programme, developed with FAO support, to bring digital tools into farming. A farm running 93 fields on one app is an early example of that shift.
How a crop monitoring app for large farms works here
Each advisory starts with fresh satellite images of the field. The Sentinel-2 satellites have a revisit time of five days from the two-satellite constellation and 10-metre detail in the visible and near-infrared bands. From these bands the system works out NDVI and other vegetation indices, which compare visible and near-infrared light reflected by the land surface to show how much green leaf is present.
▶ How satellite crop-health maps show stress before you can see it · 4:09
Infographic
How each field advisory is built in 4 steps
- 1Satellite passSentinel-2 images each field every few days; Sentinel-1 radar covers cloudy dates.
- 2Read the canopyNDVI and moisture indices show vigour and water stress field by field.
- 3Add weather and stageThe weather outlook and growth stage set water need and pest risk.
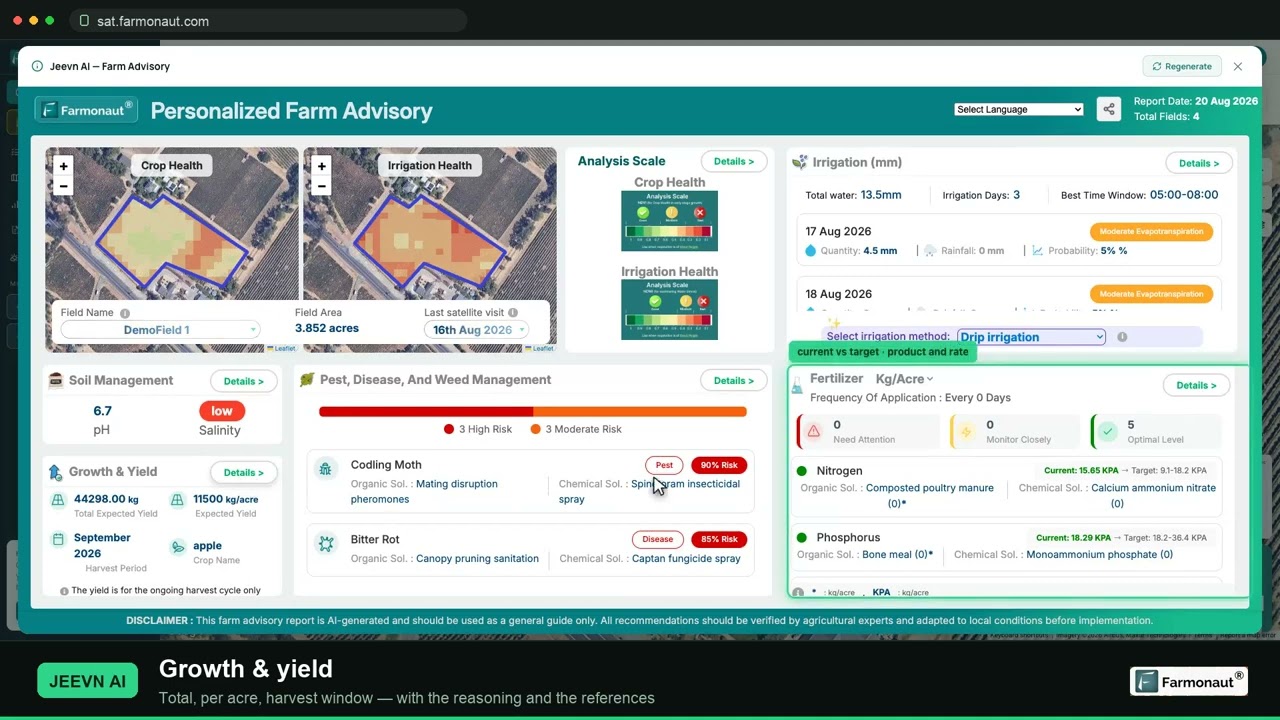
- 4One list for all fieldsIrrigation, risk scores, nutrients with organic options and a yield estimate, sortable by risk.
When cloud hides a field, the system switches to radar. Sentinel-1 radar can observe the Earth’s surface at any time of the day or night, regardless of weather. On this farm, 417 advisories on 16 dates were built from radar images.
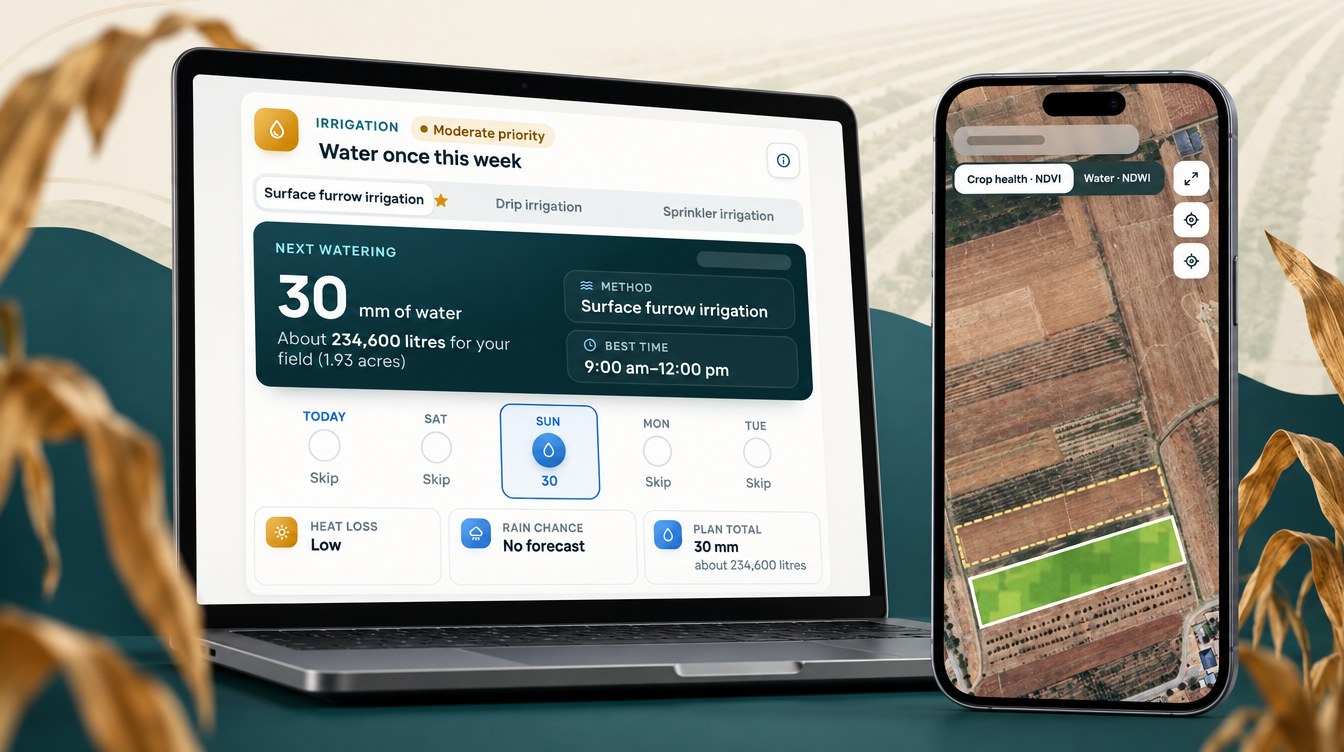
The images are then combined with the weather outlook, the field’s growth stage and the crop’s water and nutrient needs. Every field gets one advisory with five parts: an irrigation plan for the coming days, pest and disease risk scores, weed risk, a fertilizer plan with organic options, and a yield estimate. For a manager with 93 fields, the useful part is that all of these sit in one list that can be sorted by crop, stage or risk.
Triage: which fields need attention this week
The simplest way to use 93 advisories a week is to sort fields by their highest risk score and start at the top. The chart below counts, for each fortnight, how many fields had at least one threat scored at 80% or more, and how many at 90% or more.
Chart
Fields with a high risk score, by fortnight
Number of fields (of 93) whose top threat scored at least 80% or 90%, 2026
The pattern is clear. In early April, while corn was being sown, 44 of the 75 fields with advisories already had a threat at 80% or more, mostly cutworms on young corn and sunn pest on wheat. From late May to mid-June the whole farm was in the red: in the week of 15 June all 93 fields had a threat at 80% or more, and 85 had one at 90% or more. That is the window where a manager needs every scout in the field.
After the corn reached maturity in August, the list shrank fast. By the week of 24 August only 23 fields had a threat at 80% or more and none at 90%. By mid-October none passed 80%. Late in the season the advisory list turned from “check everything” into a short list of about a dozen fields. Most were corn fields still standing after maturity, flagged for Fusarium stalk and ear rot, which is a cue to harvest them first.

▶ Managing many fields and teams from one admin app · 7:27
The season across 72 corn fields
Corn sowing ran from late March to late April 2026, with a median sowing date of 6 April. The growth stage in each advisory followed the crop through the year.
| Months | Main corn stage reported | What the advisories focused on |
|---|---|---|
| Late Mar to Apr | Planting, emergence, early leaf stages | Cutworm risk, first irrigations |
| May | Vegetative growth | Corn borer and leaf blight risk rising, water need rising |
| Jun | Tasseling, silking, blister | Peak bollworm and leaf blight risk, highest water use |
| Jul | Milk, dough, dent | Ear rot and rust watch, steady irrigation |
| Aug | Physiological maturity, harvest | Harvest timing, irrigation cut back |
| Sep to Oct | Post-harvest | Almost no irrigation planned on corn |
Harvest timing across many fields
Harvest is where a field-by-field view saves the most driving. Seventy of the 72 corn fields reached physiological maturity or the harvest stage between 13 July and 23 August, and 52 of them did so in the two weeks from 3 to 16 August. Fields sown earlier tended to finish earlier. With that list, the manager can line up machines, trucks and labour field by field instead of guessing from the calendar.
Timing also matters for grain quality. The Crop Protection Network advises scouting prior to physiological maturity for ear mould, and harvesting affected areas as soon as possible. A maturity date for each field tells the manager which fields to check first.
Chart
Corn fields reaching maturity or harvest stage
Number of fields by week first reported at that stage, 2026
Risk by crop and by stage
Because one account covers nine crops, the advisories scored a long list of threats. The table shows the threats scored most often for each crop and their average score across all advisories from March to October 2026.
| Crop (fields) | Threats scored most often | Average score |
|---|---|---|
| Corn (72) | European corn borer; Fusarium ear rot; cotton bollworm | 56%; 66%; 69% |
| Wheat (6) | Sunn pest; yellow rust | 60%; 64% |
| Alfalfa (6) | Pea aphid; alfalfa weevil | 62%; 76% |
| Watermelon (3) | Fusarium wilt; spider mites; powdery mildew | 59%; 71%; 69% |
| Onion (2) | Onion thrips | 63% |
| Cotton (1) | Cotton bollworm; cotton aphid | 76%; 66% |
| Peach (1) | Oriental fruit moth | 81% |
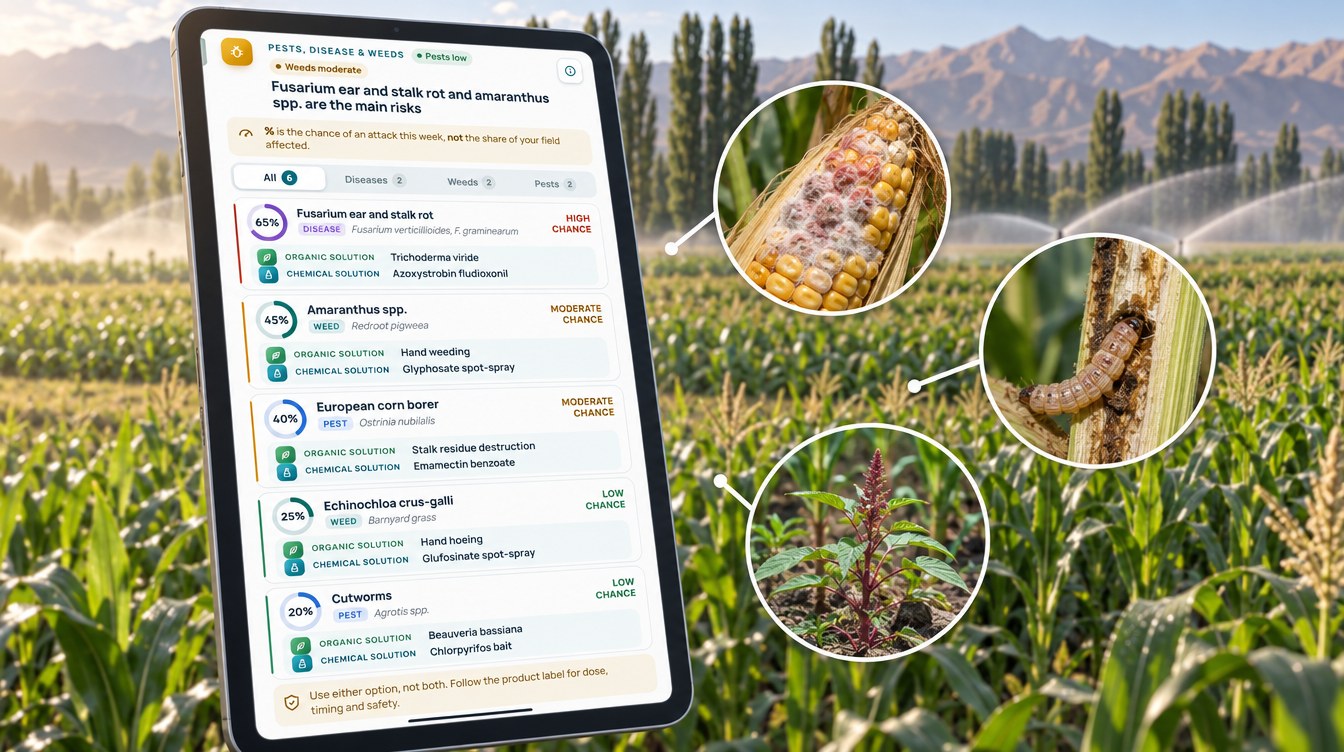
For corn, the monthly averages moved with the crop. Cutworm scores averaged 83% in April and May while plants were small, then dropped away. Leaf blight peaked at 82% in June. Cotton bollworm peaked at 90% in June, around silking, and Fusarium ear rot stayed above 75% through June and July.
European corn borer
Corn borer was the threat scored most often on corn, with an average of 81% in June. Iowa State University notes that larval feeding during the mid-vegetative stages (V6-V16) has a greater impact on yield than feeding that starts later. The June peak in the advisories falls in that window. Always follow the product label and local rules for any control.
Cotton bollworm
The insect scored as “corn earworm” in the advisories is Helicoverpa armigera, which the EPPO Global Database also lists as cotton bollworm and Old World bollworm. It attacks corn ears as well as cotton bolls, which is why it scored high on both crops on this farm.
Fusarium ear rot and northern corn leaf blight
Ear rot scores stayed high from silking to harvest. The Crop Protection Network says the disease is favored by hot and dry weather during and after silking, and that some Fusarium species can produce harmful mycotoxins. Summers in Sughd are hot and dry, so the long run of high scores fits. Northern corn leaf blight is the opposite case. The same network says it is favored by extended periods of leaf wetness and moderate temperatures, so its June peak is a cue to check the lower leaves after long, dewy nights.
Chart
Modelled corn risk by month
Average risk score across 72 corn fields, %, 2026
Water: dry days across 93 fields
The irrigation part of each advisory plans a water amount for each of the next several days. When advisories overlapped, we kept the newest plan for each field and day. That left 10,456 field-days of planned irrigation from April to July 2026. On 4,530 of them, or 43%, the advisory planned no water at all.
Chart
Rainfall vs planned irrigation by month
mm per month; Khujand 1991–2020 normal vs plan per corn field, 2026
Rain does almost nothing for summer crops here. At the Khujand weather station in Sughd, the 1991–2020 normals show 34.5 mm of rain in April and less than 7 mm a month from June to September, and about 176 mm a year. Tajikistan’s national weather service, the Agency for Hydrometeorology, publishes the day-to-day forecasts that sit on top of these long-term averages. The plan therefore carried the crop: a corn field was planned about 111 mm in May, 154 mm in June and 157 mm in July. The FAO irrigation guide gives field corn a mid-season crop coefficient of 1.20, so a corn crop in full canopy uses more water than the reference grass.
Dry days were not spread evenly. In May and June about 40% of field-days were planned dry, in July 48%, and in August, once the corn was mature, 80%. From September almost every field-day was dry.
Planned water compared with a same-dose routine
To compare, we worked out what each field would have received if it had been given its own average watering dose every day from April to July. Against that same-dose routine, the advisory plan used about 43% less water across all fields. Corn came to about 4,680 m³/ha in the plan against 7,830 m³/ha with a same-dose routine. Wheat, which was ripening by June, showed the largest gap, about 1,860 against 6,530 m³/ha. This is a comparison of plans, not a metered saving, but it shows how much of the season’s water depends on timing.
Chart
Share of field-days planned with no irrigation
All 93 fields, by month, %, 2026
Chart
Planned water by crop: plan vs daily routine
m³ per hectare per field, April–July 2026
Nutrition, soil and yield
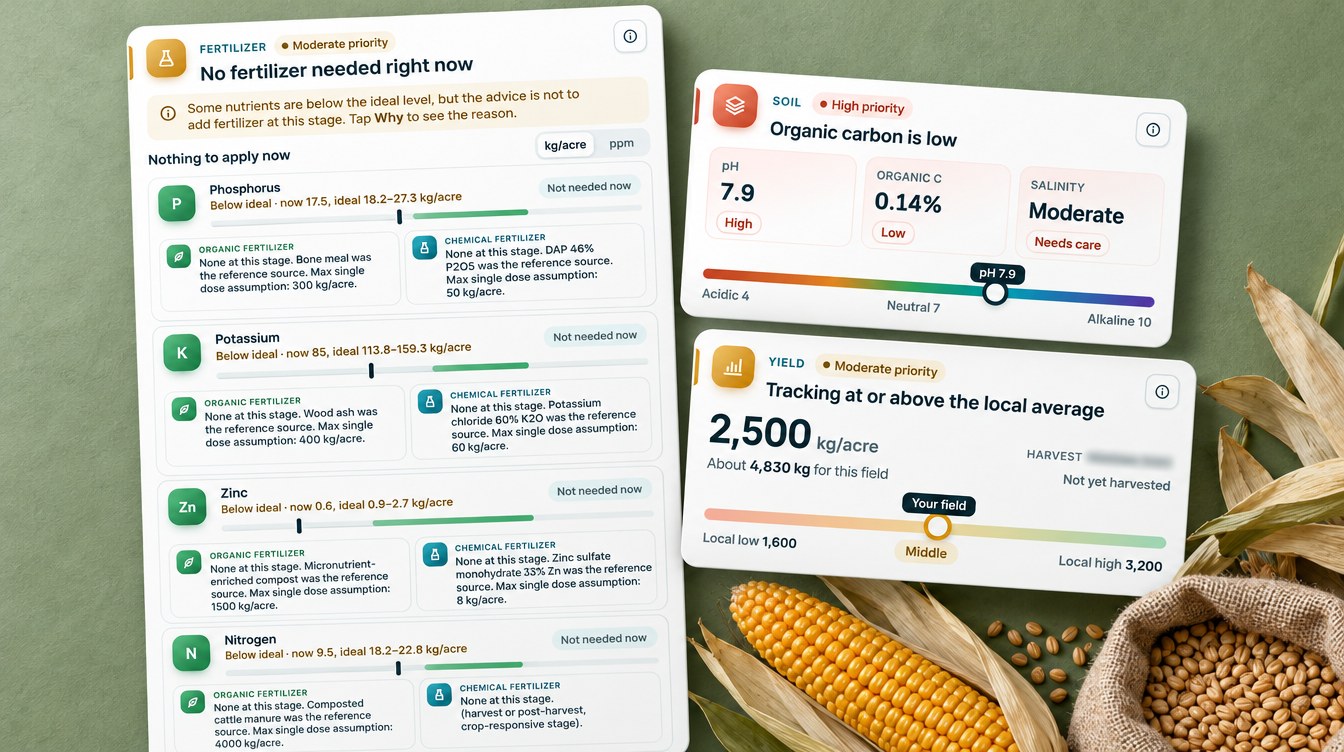
The fertilizer part of each advisory compares the field’s modelled nutrient levels with the ideal range for the current stage, then gives a rate for each nutrient that is short. Across the season the advisories gave 21,850 nutrient recommendations, and every one of them came with an organic source, such as farmyard manure or compost, as well as a mineral fertilizer. Zinc was the nutrient most often flagged as high priority, followed by nitrogen and sulfur.
The soil card rated most fields as slightly alkaline, at about pH 7.0 to 7.8, with low to moderate salinity and low organic carbon. That mix is common on irrigated land in the region, and it is one reason the advisories kept offering manure and compost options.
The yield card gave each field an estimate. In July, the middle half of corn fields were estimated at about 1,950 to 2,800 kg per acre, or about 4.8 to 6.9 t/ha, with a median near 5.9 t/ha. Wheat fields were estimated at about 4.6 t/ha. These are modelled estimates, not harvest weights, but ranking 72 fields by their estimate shows which ones are falling behind.
What other farm managers can take from it
Four lessons stand out from this farm’s 4,371 advisories.
▶ A full walkthrough of satellite crop monitoring on your own field · 19:36
- Sort by risk, then drive. A weekly list of fields with a threat at 80% or more told the manager where to scout. It covered the whole farm in June but only about a dozen fields by September.
- Plan harvest field by field. Seventy corn fields reached maturity over about six weeks, most of them in two. A maturity date per field makes it easier to plan machines and labour.
- Let the plan skip days. Even in a dry summer, 43% of field-days from April to July were planned dry, and the plan was about 43% below a same-dose routine.
- Compare crops on one screen. Corn, wheat, alfalfa and melons each had their own threats and timing. Seeing them side by side helps split labour between crops.
If you are comparing tools, our guide to crop scouting apps covers the main options, and our earlier Central Asia multi-crop case study shows a consultancy using the same system on ten crops. The calculator below estimates how much water planned dry days could save across your own fields, and what that water is worth in somoni and US dollars.
Try the numbers for your own farm below.
Calculator
How much water could planned dry days save across your fields?
Enter your own number of fields, field size, daily dose, season length and the share of days you leave dry.
- Water with a same-dose daily routine: 480,000 m³
- Water with planned dry days: 336,000 m³
- Saving per hectare: 1,440 m³/ha
- Value of water not applied: 14,400 TJS
- Value in US dollars: 1,564 USD
Example values only, not a benchmark or forecast. Enter your own water cost and exchange rate; 9.21 TJS per USD is the National Bank of Tajikistan official rate on 23 October 2026. 1 mm of water over 1 hectare is 10 cubic metres (fixed in the formula).
FAQ
What is the best crop monitoring app for large farms?
Look for an app that covers every field on one screen, updates often, works through cloud, and gives a clear action for each field. In this case study the Farmonaut Satellite + AI Farm Monitoring System sent each of 93 fields a new advisory about every five days, with irrigation, pest and disease risk, nutrients and a yield estimate.
How many fields can one manager watch with satellite advisories?
This grower watched 93 fields across nine crops from one account. The key is triage: in a typical late-season week only about a dozen fields had a threat scored at 80% or more, so the manager could focus on those first.
Can a satellite see corn borer or ear rot?
Not directly. A satellite sees changes in the canopy, not the insect or the fungus. The advisory combines canopy data with weather and the growth stage to score the risk, and the grower confirms any problem in the field.
Does it work on small fields and furrow irrigation?
Yes. The smallest field in this case study is 0.14 hectares, and most fields are watered by furrow or flood. Each field received its own irrigation plan in millimetres, which converts to cubic metres per hectare (1 mm = 10 m³/ha).
How much water can planned dry days save?
It depends on the crop, soil and season. On this farm the April to July plan was about 43% below giving each field its own average dose every day, but that is a planned figure, not a metered one. Use the calculator above with your own numbers.
Farmonaut for large farms
See every field's plan on one screen
Draw your fields once, and Farmonaut sends a satellite-based irrigation, nutrient and pest-risk plan for each one every few days on web, Android or iOS.




Keep reading

Sources
- Farmonaut advisory records for a multi-crop farm in Sughd, Tajikistan (2026): sat.farmonaut.com
- ESA, Sentinel-2 facts and figures: esa.int
- Copernicus SentiWiki, Sentinel-1 mission: sentiwiki.copernicus.eu
- NASA Earth Observatory, Measuring vegetation (NDVI and EVI): science.nasa.gov
- FAO, FAOSTAT Crops and livestock products (QCL), Tajikistan 2024: fao.org
- FAO GIEWS Country Brief: Tajikistan (June 2026): fao.org
- FAO in Tajikistan, Digital Agriculture Programme 2025–2030: fao.org
- FAO, Irrigation and Drainage Paper 56, Chapter 6 crop coefficients (1998): fao.org
- Meteostat, Khujand station (WMO 38599), climate normals 1991–2020: meteostat.net
- Agency for Hydrometeorology of Tajikistan: meteo.tj
- Iowa State University, European corn borer: crops.extension.iastate.edu
- Crop Protection Network, Fusarium ear rot of corn: cropprotectionnetwork.org
- Crop Protection Network, Northern corn leaf blight: cropprotectionnetwork.org
- EPPO Global Database, Helicoverpa armigera: gd.eppo.int
- National Bank of Tajikistan, official exchange rates (23 October 2026): nbt.tj
Discussion
Questions, corrections or field experience? Share them below. First-time comments are reviewed before they appear, and your email is never published.
No comments yet. Be the first to add a question or your experience.

 CU Foods
 BeyondTech Global
 Consulthink Global
 Rouge VC
 Yutz Automation
 AgroGreen Dynamics
 AgroRisk
 Oath Inc
 Reddane Farming
 Esri North East Africa
 Cresol
 Atur Kuliner
 MDCV UK
 Zerella Group
 Etech Consulting Madagascar
 Vestlandsforsking
 Delicio
 WB Dev
 Sama Premium
 Prochecker
 Tres Valles
 LACOS Geoinformation
 Magrifly
 LatConnect 60

 Exploration consultancy · South Africa · Gold
 Licence holder · Niger · Gold










