

Customer case study · Mango
Mango Farming in Egypt: A Luxor Satellite Case Study
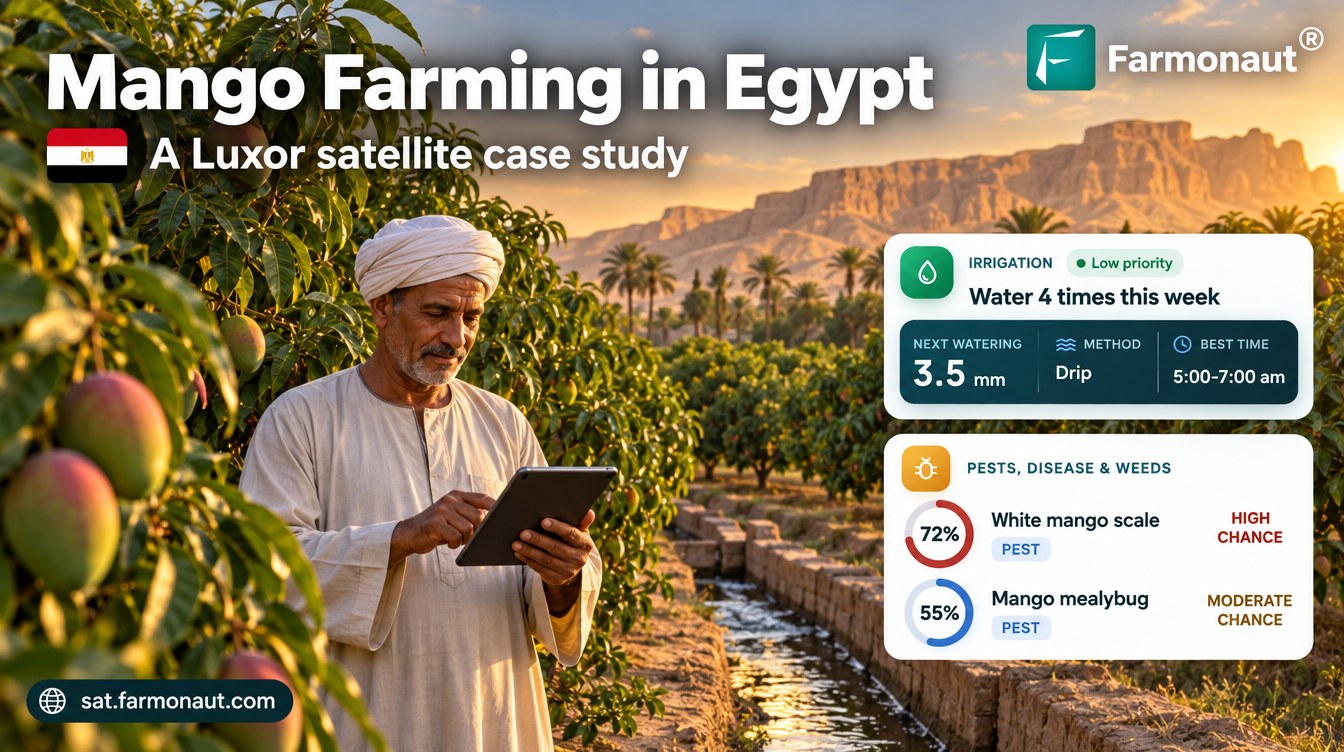
Satellite advisories planned no water on 31.7% of orchard-days across four mango orchards in Luxor, about 32% less than a same-dose daily routine, and tracked fruit fly, scale, mildew and malformation risk stage by stage.
Key takeaways
- A grower in Luxor Governorate received 529 satellite advisories for four mango orchards (89.5 feddan) and three table-grape fields from July 2025 to October 2026.
- From February to October 2026, 312 of 984 planned orchard-days (31.7%) had no irrigation, about 32% less water than a same-dose daily routine.
- Each mango orchard’s plan came to about 3,900 to 4,800 m³ per feddan for the season, in a place with 8.25 mm of rain a year.
- Fruit fly risk averaged 89% to 93% from March to July; malformation and bud mite scores rose to 65% and 66% at bud induction in October.
- Every one of 788 nutrient doses came with an organic source option.
In this article
- The orchards and the brief
- Why mango farming in Egypt is worth watching closely
- How satellite monitoring works on these orchards
- A full mango year in advisories
- Pest and disease risk by stage
- Water in a near-rainless climate
- Nutrition and soil
- Reading an advisory on a mango orchard
- Table grapes in Luxor and the Nile Delta
- What other mango growers can take from it
- FAQ
Mango farming in Egypt runs on Nile water and almost no rain, so timing every irrigation matters. For a grower with four mango orchards near Luxor in Upper Egypt, satellite advisories planned no water on 31.7% of orchard-days from February to October 2026. That plan used about 32% less water than giving each orchard its usual dose every day, while risk scores for fruit flies, scale insects, powdery mildew and anthracnose rose and fell with the trees’ growth stages.
This case study walks through 529 advisories the grower received for four mango orchards and three table-grape fields from July 2025 to October 2026. It shows what the satellite saw, what each advisory recommended, and how other mango and grape growers in Egypt can use the same data. All figures come from the grower’s advisory records. Risk scores are modelled probabilities, not confirmed outbreaks, and the water figures are planned amounts, not metered use.
The orchards and the brief
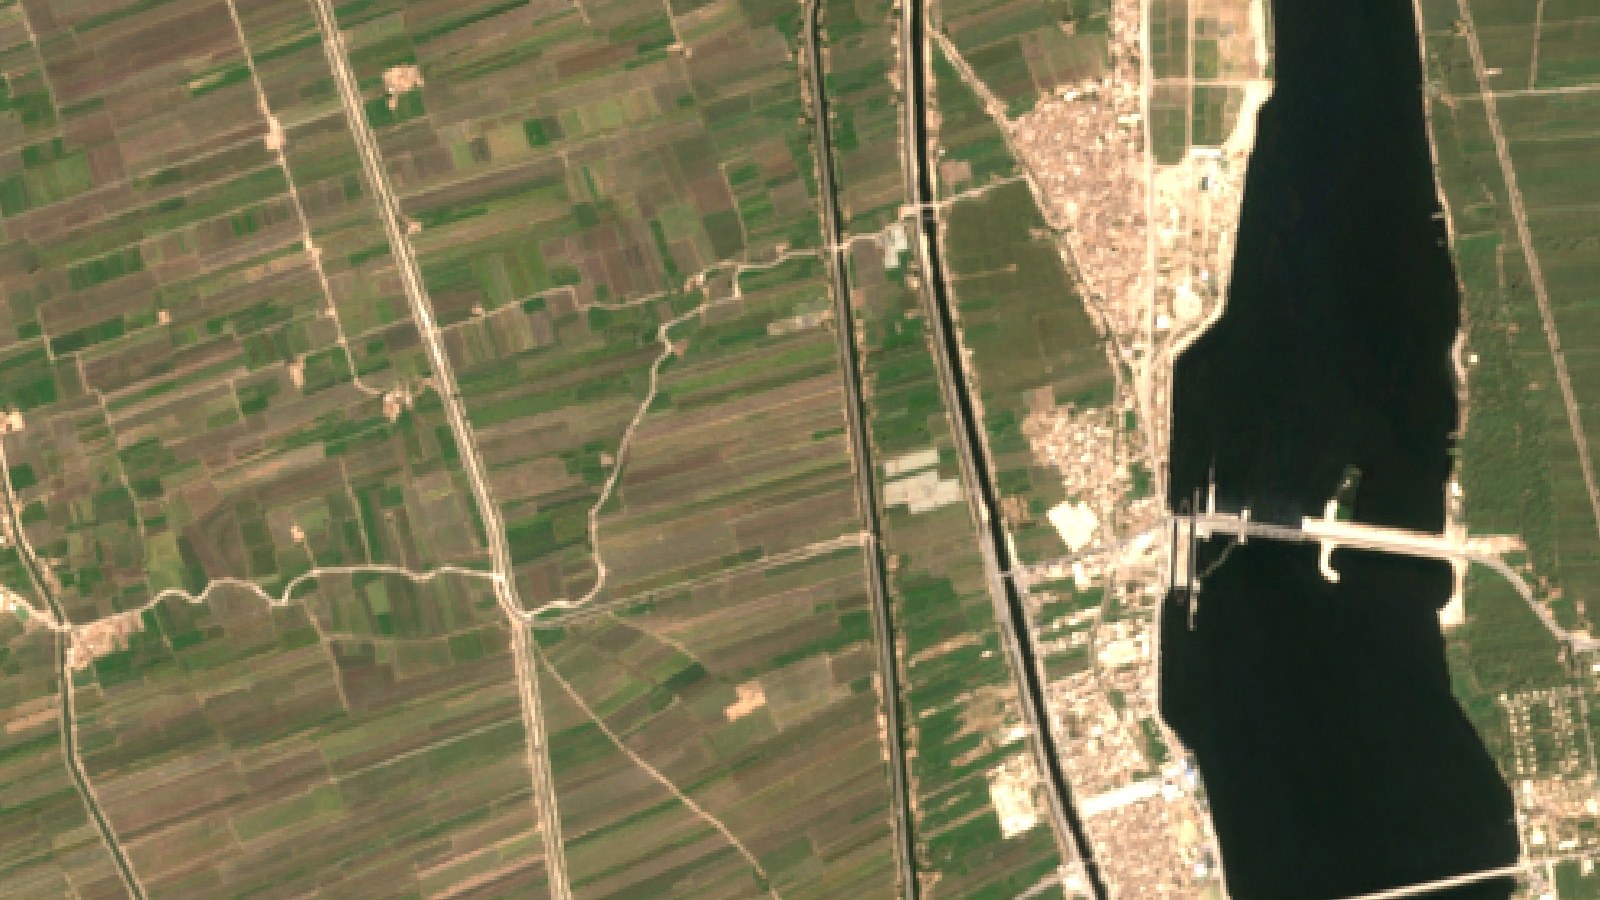
The grower farms mature mango orchards on the Nile valley floor in Luxor Governorate. The four orchards range from about 5.5 to 48.7 feddan (2.3 to 20.5 hectares) and add up to about 89.5 feddan (37.6 hectares). The same grower also follows two table-grape fields near Luxor, about 48.7 feddan in total, and a third grape field of about 51.5 feddan in the Nile Delta. Each field was drawn once in the Farmonaut app, and the advisories have arrived every few days since then.
Where the orchards are
Qina and Luxor governorates shaded; markers show approximate areas only
Upper Egypt brings its own set of jobs. Summer days pass 40°C, rain almost never falls, and irrigation water comes from the Nile. Mango trees in the region also face fruit flies, scale insects and fungal diseases. The grower wanted one place to see crop vigour, irrigation needs and pest and disease risk for every orchard without walking each row first.
| Item | Detail |
|---|---|
| Region | Luxor Governorate, Upper Egypt; one grape field in the Nile Delta |
| Main crop | Mango, mature orchards |
| Mango orchards | 4 orchards, about 89.5 feddan (37.6 ha, 92.9 acres) |
| Grape fields | 3 table-grape fields, about 100 feddan (42 ha) in total |
| Irrigation | Drip recommended; basin and micro-sprinkler options also planned |
| Monitoring period | July 2025 to October 2026 |
| Advisories | 529 in total; 248 for mango from February to October 2026 |
| Soil (modelled) | pH 7.2 to 7.8, moderate salinity, organic carbon rated low |
Why mango farming in Egypt is worth watching closely
Egypt’s mango crop has grown fast. FAOSTAT production data for the item “mangoes, guavas and mangosteens” show Egypt harvesting about 1.40 million tonnes in 2017 and about 1.86 million tonnes in 2024, from 167,276 hectares. The national average yield in 2024 was about 11.1 tonnes per hectare, or about 4.7 tonnes per feddan.
Chart
Egypt’s mango crop by year
Production of mangoes, guavas and mangosteens, thousand tonnes
Water is the limit on that growth. In 2017 the FAO Director-General said in Cairo that the North Africa and Near East region has about ten times less fresh water per person than the world average. The same FAO statement warned that rising sea levels put some of the Nile Delta’s best farmland at risk of salinization. For an orchard in Upper Egypt, that means each cubic metre of water should go where the trees need it.
Satellite data is already used at national scale in Egypt. The video below shows how Farmonaut measured the country’s wheat area from space. The same images, read field by field, drive the orchard advisories in this case study.

▶ How Farmonaut estimated Egypt’s wheat area from satellite images · 1:24
How satellite monitoring works on these orchards
Each advisory starts with fresh satellite images of the orchard. The Sentinel-2 satellites carry a camera with a revisit time of five days with its two satellites and 10-metre detail in the visible and near-infrared bands. From these bands the system works out vegetation indices such as NDVI, which compares red and near-infrared light reflected by the land surface to show how much green leaf is present.
Infographic
How each orchard advisory is built in 4 steps
- 1Satellite passSentinel-2 images each orchard every few days; Sentinel-1 radar fills gaps.
- 2Read the canopyNDVI and moisture indices show vigour and wetness orchard by orchard.
- 3Add heat and stageTemperature-based water demand and the growth stage set water need and risk.
- 4Orchard planIrrigation, risk scores, nutrients with organic options, and a yield estimate.
When no clear optical image is ready, the system switches to radar. Sentinel-1 radar can image the ground by day or night, whatever the weather, and 52 of the advisories in this case study were built from radar data.
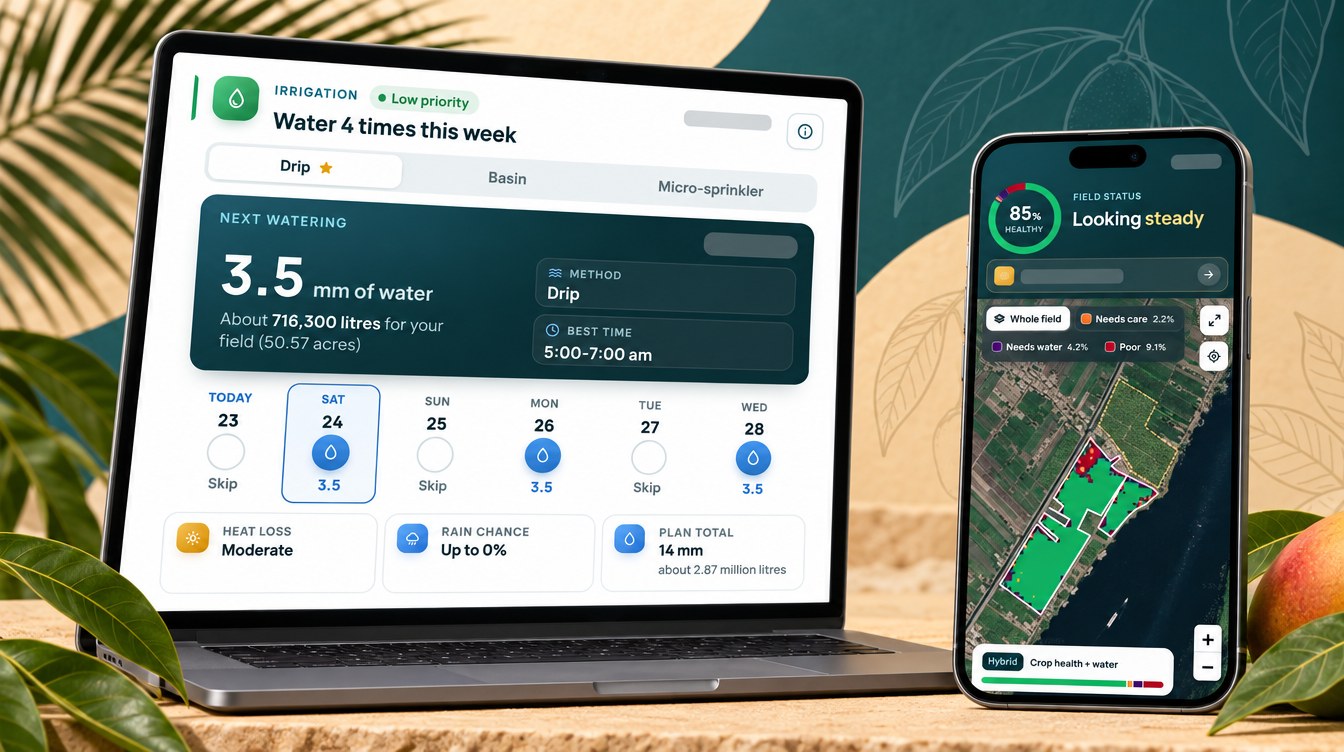
When full weather data are not available, the advisory estimates water demand from temperature. The FAO irrigation guide gives the Hargreaves equation for this case, which estimates reference evapotranspiration from the daily maximum and minimum air temperature. The images, the temperature data, the growth stage and the crop’s known needs are then combined into one advisory per field with five parts: an irrigation plan for the next week, pest and disease risk scores, weed risk, a fertilizer plan with organic options, and a yield estimate.
A full mango year in advisories
The 2026 cycle gives the clearest picture. From 18 February to 21 October 2026 the four mango orchards received 248 advisories. The growth stage in each advisory followed the trees from bud to harvest and back to rest.
| Months | Main stage reported | What the advisories focused on |
|---|---|---|
| Feb | Bud induction, flowering | Powdery mildew and hopper watch on new panicles |
| Mar | Flowering to early fruit | Peak powdery mildew risk, water rising |
| Apr to Jun | Fruit development | Fruit fly and scale risk, most nutrients, highest water |
| Jul | Fruit maturation, harvest begins | Fruit fly risk at its peak, anthracnose on ripening fruit |
| Aug to Sep | Harvest and post-harvest flush | Water cut back, about half the days planned dry |
| Oct | Vegetative flush, then bud dormancy | Malformation and bud mite watch before flowering |
UF/IFAS Extension notes that mango fruit takes 100 to 150 days from flowering to maturity. The advisories showed the same span: flowering in February and March, and the first harvest labels in July.
Because each orchard gets its own advisory, a short dip shows up quickly. In early October 2026, for example, the largest orchard’s NDVI fell to 0.39 and then recovered to 0.64 within about two weeks as a new flush of leaves came through. A drop and recovery like this is something a farm team can check on the ground within days.
▶ How a Farmonaut satellite farm advisory is read, section by section · 9:13
Pest and disease risk by stage
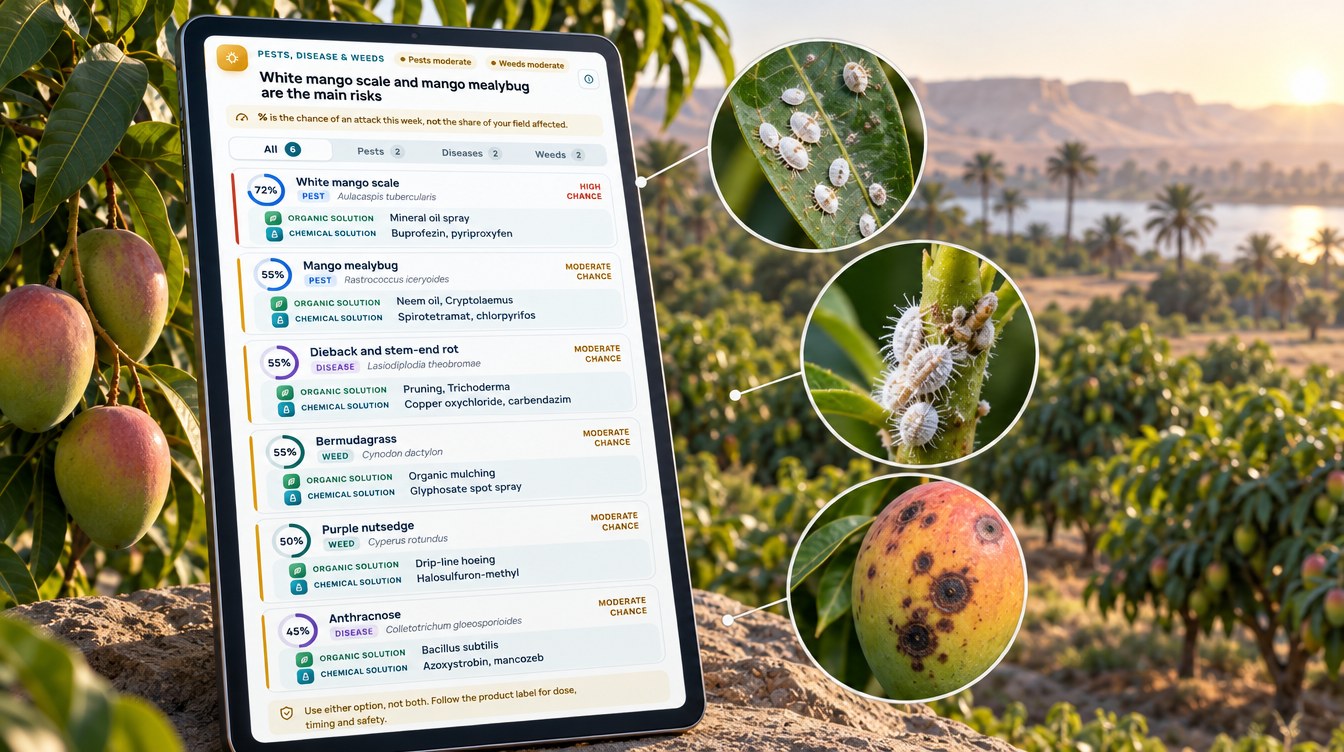
Across the 2026 cycle the advisories scored anthracnose most often (220 times), followed by scale insects (176), fruit flies (168), powdery mildew (136), mango hoppers (59) and mealybugs (49). Each score is a modelled probability built from the orchard’s canopy, moisture and temperature data, and it tells the grower where and when to look first. Always follow the product label and local rules for any control option.

▶ Organic mealybug control on fruit crops · 13:22
Fruit flies
The fruit fly score was the highest of all, averaging 89% to 93% each month from March to July, then falling to 60% in October after harvest. The advisories named the peach fruit fly, Bactrocera zonata, most often, along with the Mediterranean fruit fly. The EPPO Global Database lists the peach fruit fly as present and widespread in Egypt, so a high score through fruit growth is a reason to keep traps and orchard hygiene on schedule.
White mango scale and mealybugs
Scale scores stayed between 65% and 78% all season. The advisories named the white mango scale, Aulacaspis tubercularis, most often. The EPPO database records this scale in Egypt, and an Egyptian field study found it on mango leaves in Ismailia. Mealybug scores averaged 63% to 75% from February to August. The advisory cards paired each pest with an organic option, such as mineral oil for scale and neem oil or the ladybird Cryptolaemus for mealybugs, and a conventional one.
Powdery mildew and anthracnose
Powdery mildew scores were highest at flowering, 85% in February and 86% in March, then fell to 47% by June. UF/IFAS describes the fungus attacking leaves, flowers and young fruit in dry spring weather, which matches that early peak. Anthracnose followed the fruit instead. Its score climbed from 58% in February to 79% in May and 78% in July, as fruit grew and ripened. UF/IFAS calls anthracnose the most important mango disease in Florida, and notes that it also shows up as a storage disease of mature fruit.
Malformation and bud mite at bud induction
The newest advisories turned to the next crop. In October 2026, as the orchards moved into bud dormancy and induction, the mango malformation score averaged 65% and the mango bud mite score 66%. UF/IFAS explains that malformation is caused by the fungus Fusarium mangiferae, and that affected panicles become short and clustered, do not set fruit and dry up. Checking new shoots and early panicles in the cool months gives the grower time to prune out affected growth before flowering.
Weeds under the drip line
Weeds were scored in every advisory too. Bermudagrass was the weed named most often, with an average score of about 64%, followed by field bindweed (49%) and purple nutsedge (54%). The advisory notes explained why: when the canopy thins for a few weeks, more light reaches the moist soil along the drip lines, and these perennial weeds spread there first. The cards gave organic options such as mulching the drip line and hoeing, next to a spot spray. Follow the product label and local rules for any herbicide.
Chart
Modelled mango risk by month
Average risk score across four orchards, %, March to October 2026
Water in a near-rainless climate
Luxor gets almost no rain. The WMO 1991–2020 climate normals for the Luxor station give 8.25 mm of rain a year, with a mean daily maximum of 41.2°C in June and 41.4°C in July. In a climate like this the irrigation plan does all the work.
Chart
Heat vs planned water by month
Luxor mean daily maximum (x) and planned drip per orchard per day (y), selected months, February to October
The irrigation part of each advisory plans a drip amount for each of the next several days. When advisories overlapped, we kept the newest plan for each orchard and day. That left 984 orchard-days of planned irrigation from February to October 2026. On 312 of them, or 31.7%, the advisory planned no water at all.
The plan followed the trees more than the thermometer. Planned water rose from an average of 2.8 mm a day in February to 5.8 to 5.9 mm a day in May and June, when fruit was sizing. After harvest it fell to 2.1 mm a day in September and 1.7 mm in October, even though September in Luxor is still as hot as May. Dry days followed the same curve: 17% of days were planned dry in June, and 51% to 53% in September and October.
The newest cards also show the same plan for three methods. On the 54 orchard-days where all three were listed, the basin amount was usually about 1.3 to 1.5 times the drip amount, with micro-sprinkler in between. For a grower still on basin irrigation in part of the farm, that gap is a simple way to see what a move to drip could mean.
Planned water compared with a daily routine
To compare, we worked out what each orchard would have received if it had been given its own average watering dose every day of the season. Against that same-dose routine, the advisory plan used 26% to 38% less water per orchard, and about 32% less across all four. In the cubic metres per feddan Egyptian growers use, each orchard’s plan came to about 3,900 to 4,800 m³ per feddan for the season (9,300 to 11,400 m³ per hectare), against about 5,700 to 6,700 m³ per feddan with a same-dose daily routine. This is a comparison of plans, not a metered saving, but it shows how much of the season’s water depends on timing.
Chart
Season water per field: plan vs daily routine
Planned m³ per feddan; mango Feb–Oct 2026, grapes Jan–Oct (Luxor) and Mar–Oct (Delta)
Nutrition and soil
The fertilizer part of each advisory compares the orchard’s modelled nutrient levels with the ideal range for the current growth stage, then gives a rate for each nutrient that is short. From February to October 2026 the mango advisories listed 1,239 nutrient lines. Of these, 788 called for a dose, with the most in April during fruit growth, and every one of those 788 came with an organic source as well as a conventional fertilizer. Near harvest and in the post-harvest flush the cards often said no fertilizer was needed, because the trees were not at a stage that responds to it.
The soil section rated the orchards at pH 7.2 to 7.8 with moderate salinity and low organic carbon, about 0.15% to 0.24%. These are modelled values, so a soil test is the best way to confirm them. The low carbon rating is the reason the advisories leaned on compost-based options. The yield card put the orchards at a median of about 4,800 kg per acre, or about 5.0 tonnes per feddan (11.9 t/ha), close to Egypt’s 2024 national average. This is a modelled estimate rather than a forecast.
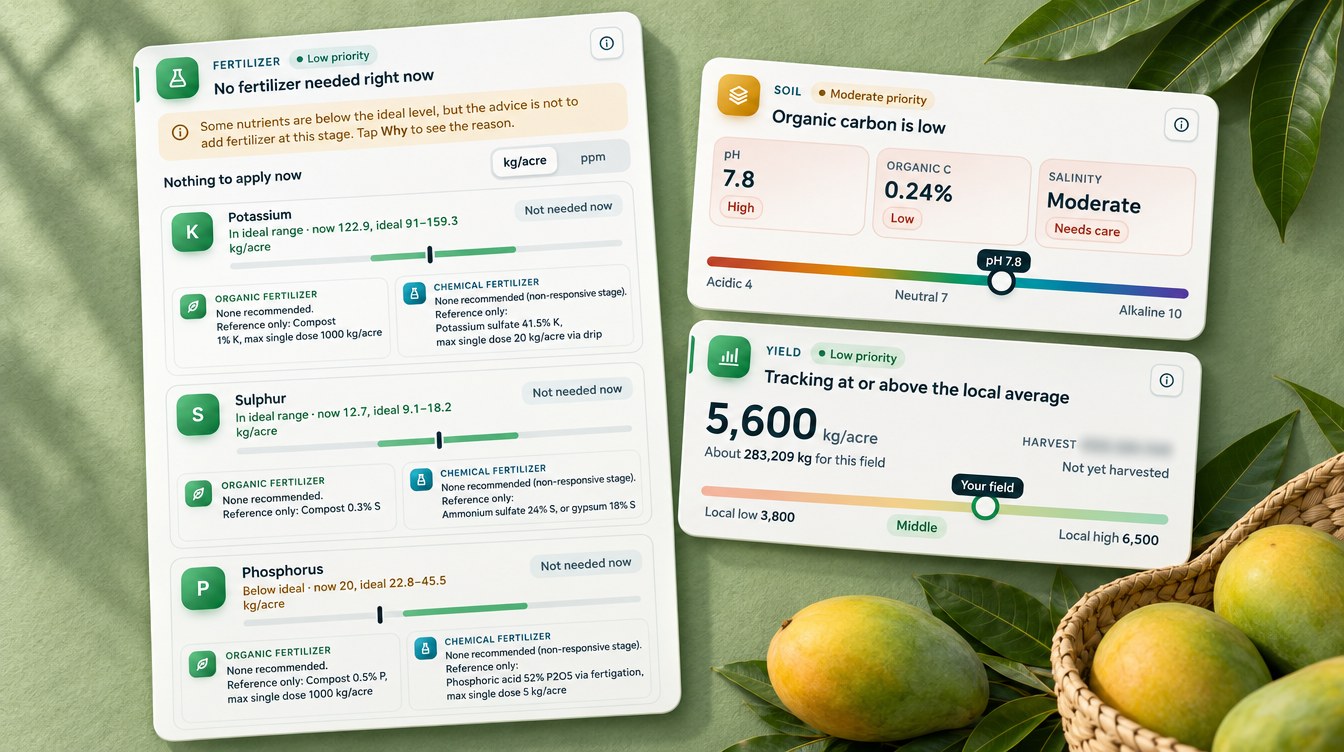
Reading an advisory on a mango orchard
The advisory is most useful when it becomes part of the weekly routine. This is how a farm team can work through it in a few minutes.
- Start with the health map. Look for patches that changed colour since the last image, and send someone to check those trees first.
- Set the week’s water. Read the planned millimetres and the skip days, then turn millimetres into run time with your emitter flow rate. One millimetre over one feddan is about 4.2 m³ of water.
- Check the top three risks. Compare the highest scores with what traps and leaf checks show in the orchard. A high score is a reason to look, not proof of a pest.
- Match nutrients to the stage. Apply only the nutrients the card marks as short, and choose the organic or the conventional source, not both.
- Note the yield band. Watch whether the estimate moves up or down between advisories, and look for the cause.
Table grapes in Luxor and the Nile Delta
The grower’s three table-grape fields received their own advisories. Near Luxor, the two fields went from budburst in February to flowering and fruit set in March and April, then to ripening and harvest from July. In 2026 their plans left 26.4% of field-days dry and used about 26% less water than a same-dose routine, about 3,300 to 3,400 m³ per feddan to the end of October.
The top grape threats were mealybugs and powdery mildew. Near Luxor, the powdery mildew score peaked at 90% in March and fell to 65% by June. UC IPM says the fungus grows best between 70 and 85°F (21 to 29°C) and slows when temperatures stay above 95°F (35°C) for 12 hours or more. Luxor’s mean daily maximum passes 35°C in April. In the Delta field, the score stayed at 89% in May and June. Mealybug scores in the Delta reached 92% in June. UC IPM notes that vine mealybug produces honeydew that drops onto the bunches, which matters for table grapes sold fresh.
A second grower in Al Qalyubiya, north of Cairo, follows grape and orange fields with the same system, which shows the advisories working from the southern Delta to Upper Egypt.
What other mango growers can take from it
Three lessons stand out from this grower’s data.
Chart
Share of days planned with no irrigation
All four mango orchards, by month, %
- Water by stage, not by heat alone. The plan put the most water on the trees during fruit sizing in May and June and cut it back after harvest, even in hot September.
- Watch risk by stage. Powdery mildew peaked at flowering, fruit flies and anthracnose during fruit growth, and malformation and bud mite at bud induction.
- Keep organic options on the table. Every nutrient dose came with an organic source, which suits low-carbon Nile valley soils.
If you grow mangoes yourself, the calculator below estimates how many cubic metres planned dry days could save on your orchard, and what that water is worth at your own cost per cubic metre. You can also compare this case with our mango orchard case study from East Java, or try the Farmonaut Satellite + AI Farm Monitoring System on your own fields.
Try the numbers for your own farm below.
Calculator
How much water could planned dry days save on your orchard?
Enter your own orchard size, daily drip dose, season length, share of dry days and water cost.
- Water with a same-dose daily routine: 100,800 m³
- Water with planned dry days: 70,560 m³
- Saving per feddan: 1,512 m³/feddan
- Saving per hectare: 3,600 m³/ha
- Value of water not applied: 60,480 EGP
- Value in US dollars: $1,210
Example values only, not a benchmark or forecast. Enter your own water or pumping cost and today’s exchange rate. 1 mm of water over 1 feddan (about 4,200 m²) is about 4.2 cubic metres, and over 1 hectare it is 10 cubic metres (fixed in the formula).
FAQ
Does satellite monitoring help mango farming in Egypt?
It gives each orchard a regular view of canopy vigour and moisture, plus a weekly irrigation plan and pest and disease risk scores. In this case study the plan left 31.7% of orchard-days dry from February to October 2026. The grower still checks the trees on the ground.
How much water does a mango orchard in Upper Egypt need?
It depends on tree age, soil and stage. In this case study the advisories planned about 3,900 to 4,800 m³ per feddan from February to October, with the most water during fruit sizing in May and June. These are planned amounts, not metered use.
Can a satellite see fruit flies or mango malformation?
Not directly. A satellite sees changes in the canopy, not the insect or the fungus. The advisory combines canopy data with temperature and the growth stage to score the risk, and the grower confirms any problem in the orchard.
How often does an orchard get a new advisory?
In this case study each orchard received an advisory about every five days, in line with the Sentinel-2 revisit time. Radar images filled the gaps when no clear optical image was ready.
Does it work for table grapes too?
Yes. The same grower follows three table-grape fields in Luxor and the Nile Delta. Each received its own irrigation plan and its own powdery mildew and mealybug scores.
Farmonaut orchard monitoring
Get an orchard-by-orchard plan for your mango farm
Draw your orchards once, and Farmonaut sends a satellite-based irrigation, nutrient and pest-risk plan for each one every few days on web, Android or iOS.




Keep reading
Sources
- Farmonaut advisory records for mango and table-grape fields in Luxor Governorate and the Nile Delta (2025–2026): sat.farmonaut.com
- ESA, Sentinel-2 facts and figures: esa.int
- Copernicus SentiWiki, Sentinel-1 mission: sentiwiki.copernicus.eu
- NASA Earth Observatory, Measuring vegetation (NDVI and EVI): science.nasa.gov
- FAOSTAT, Crops and livestock products (QCL), Egypt mango and grape data to 2024: fao.org
- FAO, Water scarcity needs urgent and massive response in North Africa and Near East (Cairo, 9 March 2017): fao.org
- FAO, Irrigation and Drainage Paper 56, Chapter 3: Meteorological data (Hargreaves equation): fao.org
- WMO Climatological Standard Normals 1991–2020, Luxor station 62405 (NOAA NCEI accession 0253808): ncei.noaa.gov
- EPPO Global Database, Bactrocera zonata world distribution: gd.eppo.int
- EPPO Global Database, Aulacaspis tubercularis world distribution: gd.eppo.int
- ScaleNet, Hashem (2021), Some scale insects and fungi infesting mango trees in Ismailia, Egypt: scalenet.info
- UF/IFAS Extension, Mango growing in the Florida home landscape (HS2/MG216): edis.ifas.ufl.edu
- UC IPM, Grape powdery mildew: ipm.ucanr.edu
- UC IPM, Vine mealybug in grapes: ipm.ucanr.edu
Discussion
Questions, corrections or field experience? Share them below. First-time comments are reviewed before they appear, and your email is never published.
No comments yet. Be the first to add a question or your experience.

 Cazlv
 HIPSAC
 ZOL Zimbabwe
 Juligerm
 AdBio
 MISE Maroc
 Drift-Sense
 NWNS
 Red August Group
 Farm Inc
 WeMe Global
 Agrotoken
 Blue BearX
 Insignito
 Croptimum
 DnCubed
 Field Capacity
 Indosistim Teknologi

 Licence holder · Niger · Gold
 Licence holder · Nigeria · Gold + lithium










